|
|
|
Tharp's Thoughts
Weekly Newsletter
|
|
|
-
Feature: Market Update:
Neutral Normal Market Type, by Van K. Tharp, Ph.D.
-
Workshops: Get a Sneak Peek at January 2017 Schedule
-
Trading Tip: September 2016 SQN Report, by Van K. Tharp, Ph.D.
-
FREE BOOK!: Trading Beyond the Matrix
|
|
|
|
This October Learn Two Robust Day Trading Systems
|
|
|
|
Day and Live Trading Workshops
|
|
Day Trading System I - Frog Trading System Origins
Ken Long, a long-time active trader and observer of the markets, noticed the consistent habit of prices for particular issues to move a certain amount. Much like a frog jumps when it hears a loud noise, prices tend to move a certain amount before they pause or move again. Different frogs are able to jump different distances, but each one tends to jump about the same distance as it did last time. Would it be possible to know about how far a stock’s price would move on any given day? This is the way his Frog trading systems works
The Frog system presents multiple intraday opportunities almost every day the market is open. Positions are closed by the end of the day, so there’s no overnight risk or worrying about positions while you lay in bed at night. There’s also no requirement to look at dozens of charts every night or every morning (trading homework time). Trades are usually initiated within the first hour after the opening bell and they last anywhere from half an hour to nearly the entire trading day. The system delivers a win rate of slightly better than 50%, but the winning trades are typically one and a half times the size of the losing trades.
Once in a while, the system will catch a higher R-multiple trade, but typically, it generates consistent, small-multiple trades. The rules take both long and short trades. Because the system is nearly 50/50 on winning and losing, drawdowns tend to be relatively short and relatively shallow. Ken has only traded this system intraday in the stock market but believes the concept could be applied to different time frames and used in different markets. (An Indian client has confirmed the system is working well with the Nifty 50 stocks.) With only a few rules, the system is easy to understand and execute. It does require discipline to follow the rules, but if you do, you have the potential to generate a
consistent return.
|
|
Two Days of Live Trading
If the Day Trading Workshop is the classroom training course, then the Live Day Trading Workshop is the in-the-field learning experience where students have a master trading coach by their side and have the chance to apply their newfound trading knowledge in the real world.
This is not a sit-back-and-listen kind of workshop—it’s hands-on.
In this workshop, you will craft your own daily trading plan based on Ken Long’s Frog, RLCO, or swing system signals and trade your own platform with your own money—all under the guidance of Ken, who will offer thorough direction and individualized feedback.
|
|
|
|
|
|
Follow These Day Trading Moves With
The Pros
|
|
|
|
Until the next Day Trading Workshop (Oct 28), Ken will share a daily video summary of his day trading systems at work in the market. In addition, he will share trade charts posted by him and his chatroom traders so you can see how his day trading systems function for other people. You can even receive access to complimentary copies of his daily trade screening report at the link below.
|
|
|
|
September 2016 Market Update:
Neutral Normal Market Type
By Van K. Tharp, Ph.D.
|
|
|
|
I always say that people do not trade the markets; they trade their beliefs about the markets. In that same way, I'd like to point out that these updates reflect my beliefs. I find the market update information useful for my trading, so I do the work each month and am happy to share that information with my readers. If your beliefs are not similar to mine, however, then this information may not be useful to you. Thus, if you are inclined to go through some sort of intellectual exercise to prove one of my beliefs wrong, simply remember that everyone can usually find lots of evidence to support their beliefs and refute others. Simply know that I admit that these are my beliefs and that your beliefs might be different.
These monthly updates are in the first issue of Tharp's Thoughts each month which allows us to get the closing data from the previous month. These updates cover 1) the market type (first mentioned in the April 30, 2008 edition of Tharp's Thoughts), 2) the debt statistics for the US, 3) the five-week status on each of the major US stock market indices, 4) our four-star inflation-deflation model, and 5) tracking the US dollar. I also write a report on the strongest and weakest areas of the overall market as a separate SQN™ Report. Significant market charges may mean the SQN Report comes out more than once a month.
|
|
Part I: The Big Picture
So what are the markets telling us now?
Over the last 100 days, the S&P 500 is up 4.69 %. The Market SQN score for the last 100 days shows a Neutral market and the same holds for the 200 day SQN® Score.
Both the 25 day and the 50 day SQN® scores have moved to bearish territory.
|
|
|
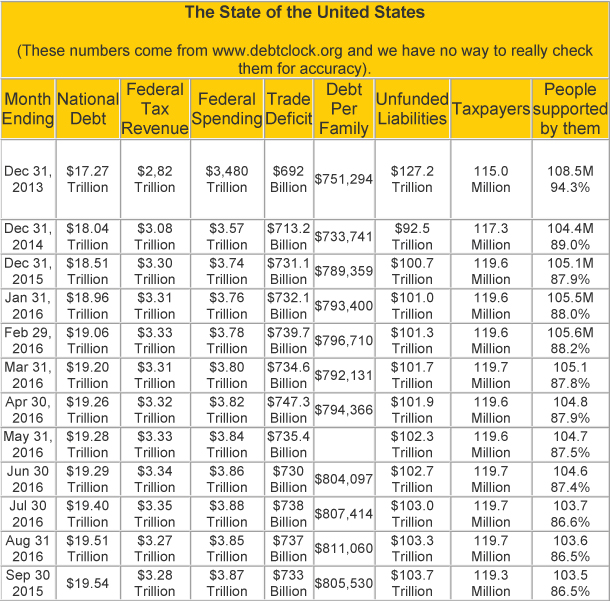
In late April 2016, usdebtclock.org said our official debt went over the $19 trillion mark and now we are at $19.5 trillion. Our politicians are doing their usual “wonderful” job of spending our money plus money they don’t have.
Who Pays Taxes?
Incidentally, their website says there are 119.3 million U.S. taxpayers. I add together US Retirees (50.0 million) food stamp recipients (42.8 million) and disabled people drawing social security (10.7 million). I don’t think there is any overlap here. Those groups total 103.5 million and that’s why I say that they constitute a group that’s 86.5% of the number of taxpayers. I could also include all government employees (23.5 million) as among those supported by taxpayers — but they do pay taxes. Remember about 10% of the taxpayers (11.93 million) pay most of the tax revenue. By the way, the debt clock lists Medicaid, Medicare, and several other sources of benefits that I don’t include because I assume they are overlaps and thus lists 162.5 million people as receiving
benefits.
Part II: The Current Stock Market Type Is Neutral Normal
My market type classification is not predictive but descriptive — rather than telling us what’s going to happen, it simply tells us what’s going on now. When you see a trend, you might say, well, right now it’s going down, however, you also know that in a few days the direction could change.
The market has been going up since February, but it’s rather flat right now so we are calling it a neutral to bull market.
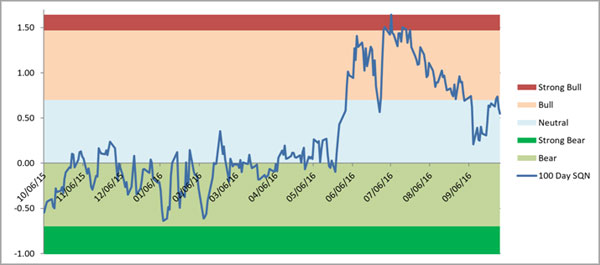
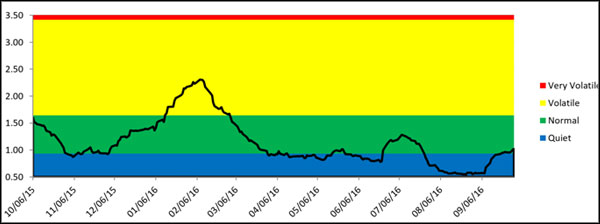
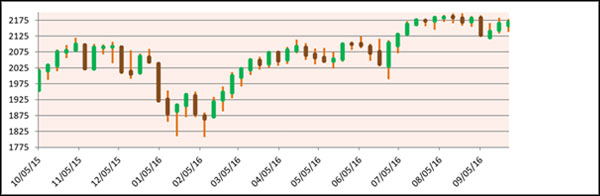
The graphs below include a chart of weekly price bars for the S&P 500 over the last year, the Market SQN® score for 100 days, and the ATR percent volatility.
|
|
|
The price chart above shows the S&P has been flat since July.
The chart below shows that rise lifted the Market SQN score out of the bear territory where it spent most of the last year. 2016 is a presidential campaign year and the market usually does well in such years (no matter how bad the candidates might seem). It hit strong bull territory briefly in July and has been going down since that time. It is now neutral and was for most of September.
|
|
The third chart shows market volatility has been quiet for most of August and September, but it’s now moved into normal volatility conditions.
|
|
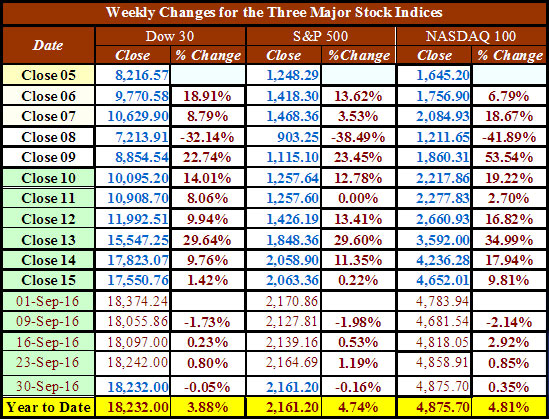
Below is a chart of the recent weekly changes in the three major US Indices. All three market indices are up for the year, but not by a lot. The Dow is up 3.88%, the S&P 500 is up 4.74%, and the NASDAQ is up 4.81%. We now have two of our three major indices for the US up slightly for the year.
You are missing profits if you are not long in this market!
|
|
Part III: Our Four Star Inflation-Deflation Model
In the simplest terms, inflation means that stuff gets more expensive, and deflation means that stuff gets cheaper. There’s a correlation between the inflation rate and market behavior so understanding inflation and deflation can help traders understand some important big-picture processes.
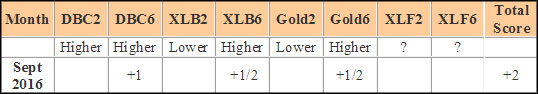
See the tracking table below.
|
|
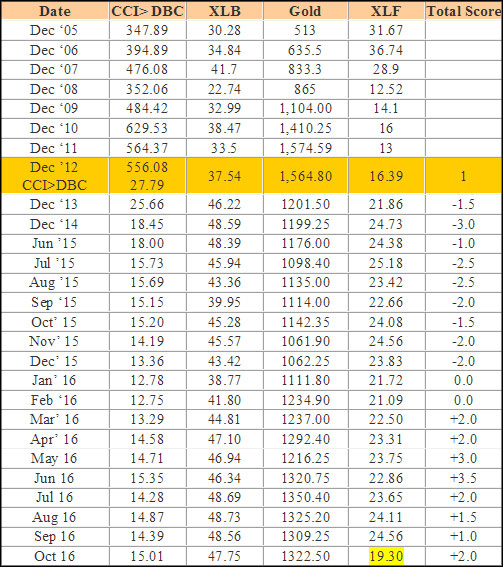
Here are the model components and how the prices looked at the end of February compared with two months back and six months back.
|
|
|
XLF recently did a stop split and declared a dividend. As a result, I don’t have adjusted back prices to compare for our data and I will only use three components of the model until I have six months of adjusted data, however, the score of 2.0 out of a possible 3.0 is still an inflationary market.
I checked with shadowstats.com this month and they report that real inflation based upon the 1980 CPI methodology as produced in 1980 is about 9%. The site still show GDP growth (real inflation adjusted at -2%) and it indicates that we have been in an recession for the last 16 years with the exception of the 4th quarter of 2003.
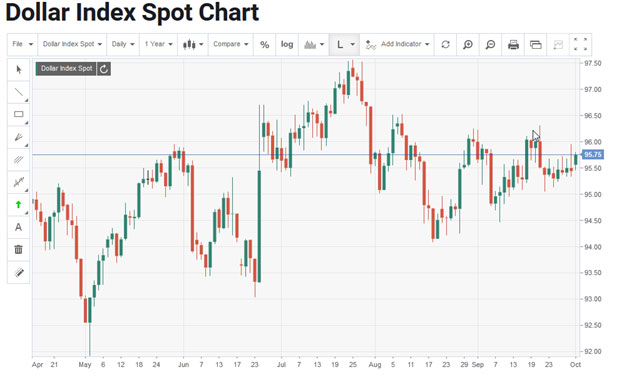
Part IV: Tracking the Dollar
The US Dollar Index has been fairly flat for the last two months, trading around 95.5, way off from its July high of around 97.5. The Brexit vote caused a huge up day and then USD continued to rise until the end of July when it fell sharply until August 18th. Since that time it has recovered a little bit. So we have Brexit in Europe and we have Clinton vs Trump in the US. While the US Dollar is known as a safe haven currency, its current 100-day Market SQN score is neutral at +0.24.
|
|
|
Conclusion
The stock market has been going down since mid-July and is now neutral, although we are still up slightly on the year. The impact of the presidential election should play out strongly over the next month with the stock market favoring Hillary Clinton. It’s an interesting situation with perhaps the most corrupt politician to run for president in some time (Clinton) versus a total wildcard (Trump). Remember that as president, Bill Clinton was actually impeached but found not guilty. His wife was at the back of all sorts of nasty shenanigans probably including the alleged murder of Vince Foster. And there are now other links to her corrupt activities but of course, nothing will ever come of those.
I’ve already expressed that Trump probably ran for President originally just for publicity and then found he could win primaries and get a lot of press attention by making outlandish statements. At this point, it’s hard to imagine that he would win. Clinton has received $44 million from about 250 wealthy Americans through a legal loophole and has been able to target key states like North Carolina with massive anti-Trump advertising on television. We get ads about Trump being anti-female; ads about Trump being anti-black, and ads about Trump being an unfit wildcard. Almost no ad, however, actually says anything good about Clinton. I turn them off because all of the election advertising people see is very one sided right now — Trump has no war chest.
I once said I’d leave the country if Hillary ever became president but now the choice is either Hillary or Trump. Wow! But, no, I won’t be leaving the country. I actually collected my first social security check last month which I thought would never happen, so who knows what the future will bring.
Until next month’s update, this is Van Tharp.
|
|
|
|
|
About the Author: : Trading coach, and author, Dr. Van K. Tharp is widely recognized for his best-selling books and his outstanding Peak Performance Home Study program—a highly regarded classic that is suitable for all levels of traders and investors. You can learn more about Van Tharp www.vantharp.com.
|
|
|
|
|
|
October 9-11
Tuesday-Friday
|
|
|
|
|
|
|
October 28-30
Friday-Sunday
|
|
|
|
|
|
|
October 31-November 1
Monday-Tuesday
|
|
|
|
|
Exclusive Event for Super Traders
Dec 3-4 (Sat/Sun) SUMMIT
Dec 5 (Mon) Day Off
Dec 6-8 (Tu-Thr) Systems Thinking
Dec 9 (Thurs) Day Off
Dec 10-12 (Sat-M) Oneness Turbo
|
|
|
|
December 3-12
Saturday-Monday
|
|
|
|
|
January 2017 Sneak Peek
These workshops are not yet confirmed and may change. But this is a likely schedule for January.
|
|
|
|
Presented by Van Tharp
with co-presenter RJ Hixson
|
|
|
|
|
|
Presented by Van Tharp
and RJ Hixson
|
|
|
|
|
|
September 2016
System Quality Number™ Report
The SQN™ Report
by Van K. Tharp, Ph.D.
|
|
|
|
|
There are numerous ETFs that track everything from countries, commodities, currencies and stock market indices to individual market sectors. ETFs provide a wonderfully easy way to discover what’s happening in the world markets. I apply a version of my System Quality NumberTM (SQNTM) score to measure the relative performance of numerous markets in a world model.
The Market SQN score uses the daily percent change for input over a 100-day period. Typically, a Market SQN score over 1.47 is strongly bullish and a score below -0.7 is very weak. The following color codes help communicate the strengths and weaknesses of the ETFs in this report:
- Dark Green: ETFs with very strong SQN 100 scores > 1.47
- Light Green: ETFs with strong SQN 100 scores (0.70 to 1.47).
- Yellow: ETFs with slightly positive Market SQN scores (0 to 0.70). These are Neutral/Sideways
- Brown: ETFs with slightly negative Market SQN scores (0 to -0.7).
- Red: Very weak ETFs that earn negative Market SQN scores (< -0.7).
This is basically the same rating scale that we use for the Market SQN Score in the Market Update. The world market model spreadsheet report below contains most currently available ETFs; excluding inverse funds and leveraged funds. In short, it covers equity markets around the globe, major asset classes, equity market segments, industrial sectors, and major currencies.
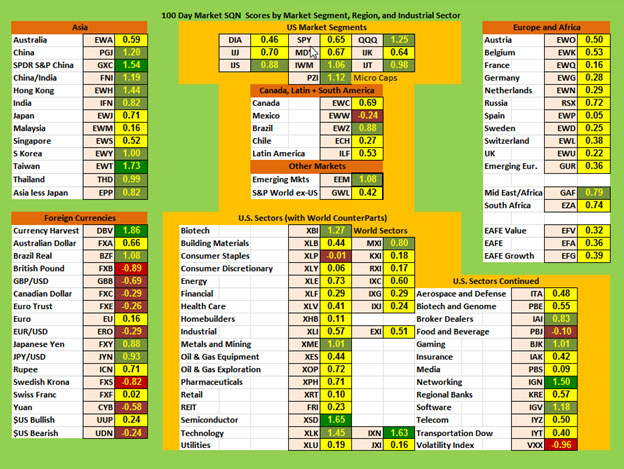
World Market Summary — Equities & Currencies
Each month we look at the equities markets across the globe by segment, region, and sector. This month everything is green and yellow. Everything in the Americas is light green and yellow now with the exception of Mexico which is brown.
At our far left Asia region section of the model, China and Taiwan are dark green, but everything else is either light green or yellow.
This month Europe was mostly yellow with one light green area, which includes the mid-East and Africa
The US sector view is now mostly yellow or neutral. There are two dark green areas — networking and semi-conductors. The light green areas include gaming, biotech, metals and mining, technology, and software. There are two brown areas, consumer staples and food and beverage. The VXX (volatility) is red.
In currencies, one is dark green (which is a currency harvest). There are two light green currencies — the Brazilian Real and the Japanese Yen. There are two red areas — the British Pound and the Swedish Krona. And there are six brown areas: including 1) the pound vs the dollar; 2) the Canadian dollar, the Euro, the Yuan, and the US Dollar down.
|
|
|
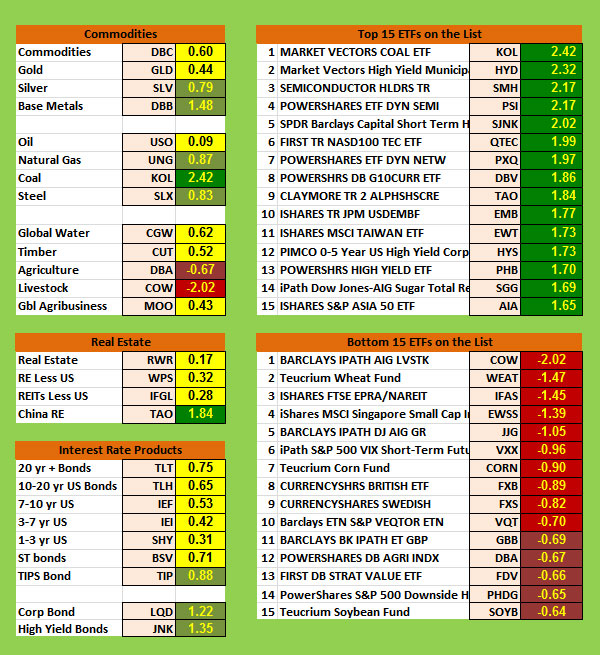
Commodities, Real Estate, Debt, Top and Bottom Lists
The next chart shows real estate, debt instruments, commodities and the top and bottom ETFs for the past 100 days.
The whole commodities section illustrates what the inflation deflation model in the Market Update articles have been showing for the last six months — we are again in an inflationary environment. Coal is dark green. Light green commodities include Base Metals, Silver, Natural Gas, and Steel. Everything else is yellow except agriculture (brown) and livestock (red).
Chinese real estate is doing very well (dark green), but most real estate sections (including REITS above) are yellow.
Debt instruments were all green two months ago, but have now turned neutral (yellow). The only green ones are inflation protected bonds (TIPS), corporate bonds and junk bonds. Suddenly, over the last two months, big money likes junk bonds and corporate debt.
The Top Ranking Lists:
The top ranking ETFs in the database are now all dark green. Last month we had one over 3.0 and the top 15 were all over 2.0. This month the top ETF is coal at 2.42. Only five ETFs are now above 2.0. And mini bonds are no longer dominating the top ETFs.
The Bottom Ranking Lists:
Last month only four of the ETFs were red and only two were worse than 1.0. This month the worst one is Livestock (-2.02) and four more of them are worse that minus 1.0. There are 10 (of the 15) that are red, and they suggest that life on the farm is not so good right now. Livestock, wheat, soybeans, agriculture and corn are all in the bottom.
|
|
|
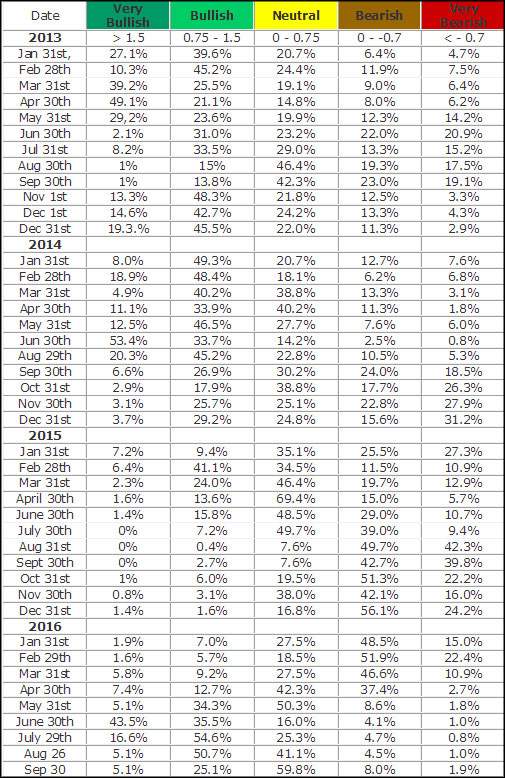
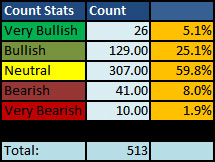
Summary
Let’s look at the summary table which measures the percentage of ETFs in each of the strength categories.
|
|
|
|
We now have nearly four years of data on the 500 ETF rankings, which show you what percentage are bullish, neutral and bearish. This month we have moved down from 55.8% of the ETFs we track being bullish to 30.1%. But the bearish haven’t gone up much. Last month it was 5.5% bearish and this month it’s 9.9% bearish.
Be careful to base your actions upon what IS happening, not what you think might happen.
Until next month, this is Van Tharp.
The markets always offer opportunities, but to capture those opportunities, you MUST know what you are doing. If you want to trade these markets, you need to approach them as a trader, not a long-term investor. We’d like to help you learn how to trade professionally because trying to navigate the markets without an education is hazardous to your wealth. All the beliefs given in this update are my own. Though I find them useful, you may not. You can only trade your own beliefs about the markets.
|
|
|
|
FREE Book!
We pay for the book, you pay for shipping.
Read Van’s Latest Book —
TRADING BEYOND THE MATRIX
The Red Pill for Traders and Investors
Eleven traders tell their stories about transforming
their trading results and lives, in this 400 plus page book.
Below is a brief video on how powerful this book is to traders.
|
|
|
|
Swing Trading Systems E-Learning Course
|
|
|
|
|
|
Ken Long's systematic approach to swing trading with 5 distinct trading systems. This course has over 10 hours of instruction with significant follow-along documents included for students to download.
Review the videos as many times, and as often as you like, for one full year. Plus, you receive a bonus workshop at no extra charge—Dr. Van Tharp's Tharp Think Essentials!
You can complete this course at your own pace, from the comfort of your own home or office, and access the materials as many times as you wish during your 1-year subscription period.
|
|
|
|
Take a look at this video from Ken to learn more about this course.
|
|
We have extensive information about the Swing Trading System e-learning course, including how to purchase...click the link below!
|
|
|
|
Cary, NC
For a list of nearby hotels for our Cary, North Carolina locations,
click here.
Book your flight arriving to the Raleigh-Durham International Airport (RDU).
When traveling to a three-day course, it's best to arrive the evening before.
To help determine your arrival and departure times, see:
Questions? Click Here to Ask Van...
CONTACT US
If you no longer wish to receive our email updates, click the unsubscribe link in the bottom-left corner of this email.
This is a supplement to our subscription based newsletter, Tharp's Thoughts.
800-385-4486 * 919-466-0043 * Fax 919-466-0408
|
|
|
|
|