|
|
|
Tharp's Thoughts
Weekly Newsletter
|
|
|
|
-
Feature: Revisiting Tom Basso: How Important
is Your Entry Really? Part II, by Justin Paolini
-
Workshops: $700 Early Enrollment Discount Ends Today on Van's Infinite Wealth Workshop!
-
Trading Tip: Dividend & Defensive Stock Danger, by D.R. Barton, Jr.
-
FREE BOOK!: Trading Beyond the Matrix
|
|
|
|
|
New! Follow These Day Trading Moves With The Pros
Until the next Day Trading Workshop (Oct 28), Ken will share a daily video summary of his day trading systems at work in the market. In addition, he will share trade charts posted by him and his chatroom traders so you can see how his day trading systems function for other people. You can even receive access to complimentary copies of his daily trade screening report at the link below.
|
|
|
|
|
Day and Live Trading Workshops
|
|
Day Trading System I - Frog Trading System Origins
Ken Long, a long-time active trader and observer of the markets, noticed the consistent habit of prices for particular issues to move a certain amount. Much like a frog jumps when it hears a loud noise, prices tend to move a certain amount before they pause or move again. Different frogs are able to jump different distances, but each one tends to jump about the same distance as it did last time. Would it be possible to know about how far a stock’s price would move on any given day? This is the way his Frog trading systems works
The Frog system presents multiple intraday opportunities almost every day the market is open. Positions are closed by the end of the day, so there’s no overnight risk or worrying about positions while you lay in bed at night. There’s also no requirement to look at dozens of charts every night or every morning (trading homework time). Trades are usually initiated within the first hour after the opening bell and they last anywhere from half an hour to nearly the entire trading day. The system delivers a win rate of slightly better than 50%, but the winning trades are typically one and a half times the size of the losing trades.
Once in a while, the system will catch a higher R-multiple trade, but typically, it generates consistent, small-multiple trades. The rules take both long and short trades. Because the system is nearly 50/50 on winning and losing, drawdowns tend to be relatively short and relatively shallow. Ken has only traded this system intraday in the stock market but believes the concept could be applied to different time frames and used in different markets. (An Indian client has confirmed the system is working well with the Nifty 50 stocks.) With only a few rules, the system is easy to understand and execute. It does require discipline to follow the rules, but if you do, you have the potential to generate
a consistent return.
|
|
|
|
|
Revisiting Tom Basso: How Important
is Your Entry Really? Part II
By Justin Paolini
|
|
|
|
|
Editor’s Note: In last week’s Part I article "Revisiting Tom Basso: How Important is Your Entry Really?", Justin described the inspiration for testing Tom Basso and Van Tharp’s random entry system that Van wrote about in his Trade your Way... book. Using recent Forex and gold price data, the system still tested profitable but those results then led to additional questions. This week, we rejoin Justin as he describes the results of further research into the effects of more entry randomness and several other changes to the rules.
|
|
Basso Test Variation — Pure Random Random Entry
The first robustness check we performed, was to make the entry method more random than in Basso’s original system. We ran the iterations again with the following algorithm: a number from 1 to 20 was randomly extracted but only a “1” (Buy) or “2” (Sell) opened a position. So this system was effectively random in time, direction, and price. This system was not in the market the whole time of the test period. We also lengthened the ATR parameters. Instead of using a 10 Day ATR, which is much closer to the current market’s volatility conditions, we adopted a 200 Day ATR which would be less biased by volatility clusters in the data. Also, instead of using a fixed 3xATR initial & trailing
stop, we used a 1xATR Initial Stop and a 2xATR Trailing stop. The idea was to give back less profit in trending situations, and get out of the market early in choppy situations.
|
|
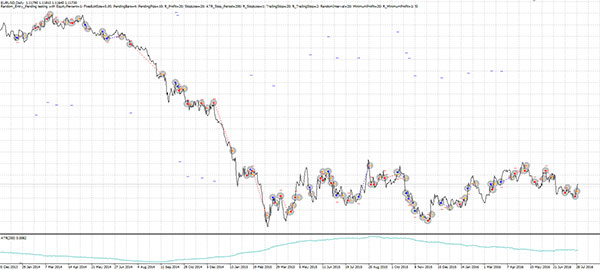
“Random Random” Trades with our new rules, coded by Craig Consulting on MT4
|
|
|
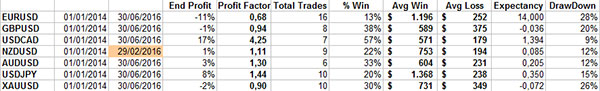
An example of the output in Excel – our own Random-Random Entry
Running various iterations of our “Random-Random” system, we got much closer to the “random” results we would expect. Some interesting outcomes —
- Results ended up being much more variable. Equity curves were more of a mix between end profit and end loss compared to Basso’s settings. This is to be expected because we were voluntarily adding randomness to the method.
- The total number of trades was higher. Of course, we were not in the market as long as Basso’s system was and we had tighter stops - so we have more trades. This increased our sample size and added robustness to the results — we think.
- Using a smaller trailing stop than Basso, our drawdowns were smaller yet our average profit was still larger (double) than our average loss. So the trailing stop still worked very much in our favor.
- Strangely, the profit factor was still positive. We wouldn’t expect this if the market was purely random. That result wasn’t just confined to one iteration; it was consistent over all runs we performed.
At this point in our journey, Craig & I started to see through the data. We were effectively observing Forex’s “tendency to trend” characteristic that commodities also display. So any variation of a random entry and trailing stop should yield similar results. The trailing stop is in fact a simple trade management vehicle to “capture trends” and we continued to find this tendency through more and more testing.*
The Most Important Thing
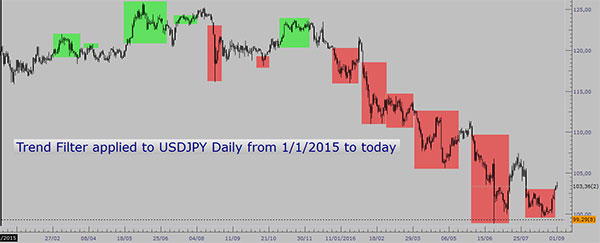
After thinking through our observations, we re-ran the tests but this time we gave the random entry generator a “trend filter”. Of course, one could debate what kind of trend filter to use because there are many variations on the theme but we wanted it to be as robust and non-discretionary as possible. We told the algorithm to look for situations like this:
|
|
|
The non-discretional trend-filter, as applied on USD/JPY daily chart since 1/1/2015
As with many tools, the methodology is not perfect but it gets the job done. The unshaded areas were considered “range” periods. Remember that when we applied our random entry to the filtered market states:
- Entries were still random in time so the beginning of a trend state does not imply any trade initiation
- Entries were still random in direction, so the model also looked at long entries in downward trends and short entries in upward trends.
We were attempting to maintain the random-random nature of the signals to verify further whether “filtering trending markets” could enhance the performance of the signals. Our logic was as follows: if the market state is truly the most important factor, then by only entering the market in those moments (albeit randomly) we should get better results than entering at random just anywhere, anytime. In other words, we’re trying to “help” the trailing stop do its work.
Here is a sample of the results:
|
|
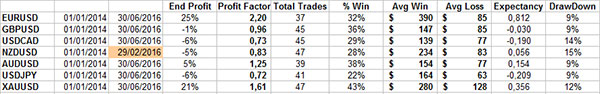
|
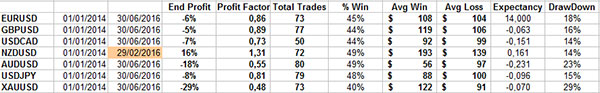
Sample run of Tom Basso’s random entry and trailing stop combined with our trend filter
We applied Tom Basso’s random entry settings combined with our Trend Filter and these were our main takeaways after multiple runs:
- The profit factor was more stable.
- Wins were much higher on average which compensated for a lower hit rate.
- End profit distribution skewed more to the positive side when compared to our runs of Basso’s original random entry rule.
The trend filter worked to a certain extent but to find out if what we were seeing was really non-random, we needed to verify the opposite: the results should be “bad” if we used a random entry with the trailing stop (best for trending markets) inside a range.
|
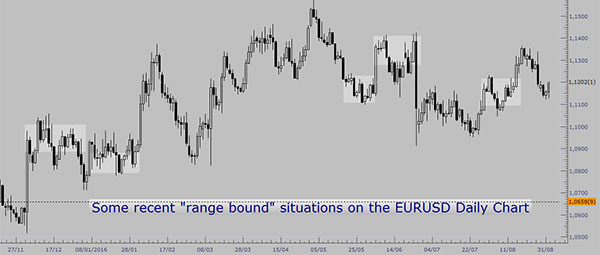
|
Some recent “range” situations as identified by our non-discretional trend filter.
A range is defined as “not in trend”.
Here is a sample of the results:
|
|
|
Sample run of a random entry in a “no trend” environment
From this set of runs, the main takeaways are evident:
- The final profit was consistently negative which was interesting considering that we were using “random” entries.
- The profit factor was decisively lower than on any other random entry test.
- The average win was no longer consistently larger than the average loss.
Summary Conclusions
After all of these test runs, it’s quite easy to forget the original objective of the test runs. We were attempting to find out how important the entry was for trading FX.
Our main conclusions were –
- A random entry with a volatility-based trailing stop on average makes money over long enough sample sizes in Forex and commodities because those markets trend for extended periods.
- Random entry positions get chopped up inside a range.
- The Market Type (Trend or Range) is the overriding variable affecting system performance in our tests.
So what are some of the implication for traders?
- Focus more on identifying market types and then deploy an appropriate trading system in line with that market type.
- While a purely random entry strategy may be viable on paper, it’s impractical and tough to stomach in real life. You can do much better than random for an entry strategy – and still not spend most of your time refining it.
- Keeping losses small is not enough of a strategy to make money over time since you can easily “die from a thousand paper cuts”.
Over to You
This is our first evidence-based piece and I do need to thank our resident programmer Craig Drury for his efforts. We would appreciate any comments on our tests and if you have ideas on how to make the results even more robust, or if you have other feedback, it would be very much appreciated.
*(for all results and iterations, please feel free to contact Craig at [email protected]).
|
|
|
|
|
|
About the Author: Justin Paolini has 10 years of experience trading FX. He has studied Van Tharp’s trading principles and incorporates many of those in the weekly blog posts he writes. He currently works for Forex signal provider FX Renew as a trading coach.
|
|
|
|
|
|
|
Our $700 Early Enrollment Discount for Van's Infinite Wealth Workshop Ends Today!
|
|
|
|
|
When Van Tharp first started teaching this workshop his co-instructor was Robert Kiyosaki, who soon went on to become famous for his Rich Dad, Poor Dad book. Van has recently reintroduced this course with many updates.
This workshop has years of Dr. Tharp's, and his colleagues' shared knowledge about wealth, modeling wealth and most importantly, information about how our beliefs about money and wealth influence our ability to obtain wealth.
Attend this workshop and reshape your attitudes toward wealth, money, scarcity and abundance.
You'll be surprised at the impact these three days will have on you and how beliefs running in your unconscious background may be holding you back.
Workshop Objectives:
|
To define what a game is so that you can see that most games cause you to lose.
To illustrate the elements of the money game so you can begin to awaken to how winners play the game.
To help you understand the domain at which you play the money game.
To awaken you to a new way to play the wealth game. To give you choice with respect to how you play the wealth game in the future.
|
|
|
|
|
October
$700 Early Enrollment Discount Ends Today On Infinite Wealth
|
|
|
|
|
Presented by Van Tharp
with co-presenter RJ Hixson
|
|
|
|
|
Sept. 30-October 2
Friday-Sunday
|
|
|
|
|
|
Presented by Libby Adams
and RJ Hixson
|
|
|
|
|
October 4-7
Tuesday-Friday
|
|
|
|
|
|
|
|
October 9-11
Tuesday-Friday
|
|
|
|
|
|
|
|
October 28-30
Friday-Sunday
|
|
|
|
|
|
|
|
October 31-November 1
Monday-Tuesday
|
|
|
|
|
|
Exclusive Event for Super Traders
Dec 3-4 (Sat/Sun) SUMMIT
Dec 5 (Mon) Day Off
Dec 6-8 (Tu-Thr) Systems Thinking
Dec 9 (Thurs) Day Off
Dec 10-12 (Sat-M) Oneness Turbo
|
|
|
|
|
December 3-12
Saturday-Monday
|
|
|
|
|
|
January 2017 Sneak Peak
These workshops are not yet confirmed and may change. But this is a likely schedule for January.
|
|
|
|
|
Presented by Van Tharp
with co-presenter RJ Hixson
|
|
|
|
|
|
|
Presented by Van Tharp
and RJ Hixson
|
|
|
|
|
|
|
Presented by RJ Hixson
and Van Tharp
|
|
|
|
|
|
|
Dividend & Defensive Stock Danger
by D. R. Barton, Jr.
|
|
|
|
|
|
The market responded favorably last Wednesday when the Federal Open Market Committee (FOMC) chose to hold off on an interest rate hike. The follow through, however, only lasted through Thursday.
This has brought us to a point where the markets appear poised for a continued sideways to slightly upward grinding manner that we have experienced since the Brexit vote.
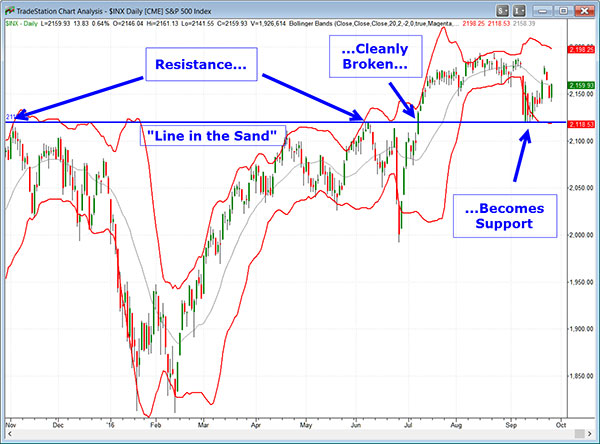
Today, I’d like to show the index in relation to the line in the sand that’s been drawn and then update you on a theme that we have highlighted previously – the relative strength of high dividend and defensive sectors. Let’s dig in.
The Line in the Sand Still Holds
Last week we looked at the 2120 zone on the S&P 500 cash index as an important support area. Price has moved up a bit but nothing much has really changed:
|
|
|
Sector Rotation Pending
With the continued accommodating news from the Fed, the probabilities slant more in the favor of a grinding up market - at least into the election. From where we are now, let’s see if we can really get a full-blown sector rotation into more “risk on” sectors while utilities (high dividend stocks) and consumer staples (the traditional defensive plays) pull back. So far in 2016, high dividend and defensive stocks have been strong and only recently started to weaken.
The following chart is one we look at regularly to gauge relative sector strength:
|
|
|
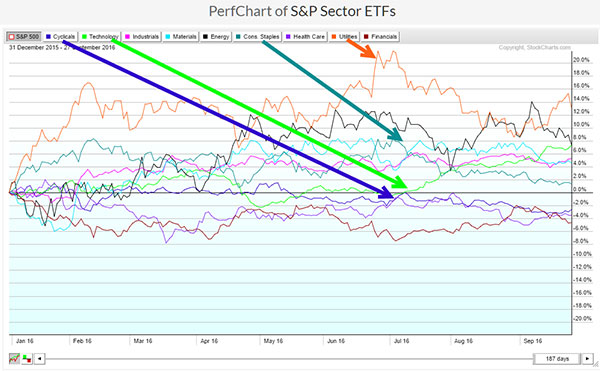
Relative Strength Chart for Sectors
Risk On: Cyclicals (blue) and Technology (lime), Risk Off: Cons. Stapes (forest) and Utilities (orange)
Here we see the utility stocks (orange line) and consumer staples (forest green) showing strong outperformance through the first half of the year and pulling back since July. The technology sector (lime green) has started to outperform over the last three months while the cyclical sector (in blue and otherwise known as consumer discretionary) has continued to lag.
As we head into election day on November 8 and consider the possibility of an interest rate hike in December, I’ll be watching three things very closely:
|
- Fed-related news of any sort.
Weaker than expected economic data would imply further delays in a rate hike which would push stock prices higher. Also, continuing accommodative comments by Fed governors during scheduled lectures imply a delayed rate hike — and continued market grinding sideways or up.
- Strength in the “risk on” tech and consumer discretionary sectors.
Risk on sectors strength signals that investors are counting on more upward price movement in coming months.
- Trouble in the utilities and consumer staples sectors.
These defensive sectors have had a great run and could be a looking at a pullback even if the broader market is neutral or in a mild uptrend.
|
|
In the next article, we’ll look more at high dividend and defensive sectors. Some very interesting and useful data hint at how those sectors’ strength could lead to their upcoming decline.
Please send your thoughts and comments to drbarton “at” vantharp.com – I always appreciate hearing from you!
Great Trading,
D. R.
|
|
|
|
|
|
|
About the Author: A passion for the systematic approach to the markets and lifelong love of teaching and learning have propelled D.R. Barton, Jr. to the top of the investment and trading arena. He is a regularly featured analyst on Fox Business’ Varney & Co. TV show (catch him most Thursdays between 12:30 and 12:45), on Bloomberg Radio Taking Stock and MarketWatch’s Money Life Show. He is also a frequent guest analyst on CNBC’s Closing Bell, WTOP News Radio in Washington, D.C., and has been a guest on China Central Television — America and Canada’s Business News Network. His articles have appeared on SmartMoney.com MarketWatch.com and Financial Advisor magazine. You may
contact D.R. at "drbarton" at "vantharp.com".
|
|
|
|
|
FREE Book!
We pay for the book, you pay for shipping.
Read Van’s Latest Book —
TRADING BEYOND THE MATRIX
The Red Pill for Traders and Investors
Eleven traders tell their stories about transforming
their trading results and lives, in this 400 plus page book.
Below is a brief video on how powerful this book is to traders.
|
|
|
|
|
Swing Trading Systems E-Learning Course
|
|
|
|
|
|
|
Ken Long's systematic approach to swing trading with 5 distinct trading systems. This course has over 10 hours of instruction with significant follow-along documents included for students to download.
Review the videos as many times, and as often as you like, for one full year. Plus, you receive a bonus workshop at no extra charge—Dr. Van Tharp's Tharp Think Essentials!
You can complete this course at your own pace, from the comfort of your own home or office, and access the materials as many times as you wish during your 1-year subscription period.
|
|
|
|
|
Take a look at this video from Ken to learn more about this course.
|
|
We have extensive information about the Swing Trading System e-learning course, including how to purchase...click the link below!
|
|
|
|
|
Cary, NC
For a list of nearby hotels for our Cary, North Carolina locations,
click here.
Book your flight arriving to the Raleigh-Durham International Airport (RDU).
When traveling to a three-day course, it's best to arrive the evening before.
To help determine your arrival and departure times, see:
Questions? Click Here to Ask Van...
CONTACT US
If you no longer wish to receive our email updates, click the unsubscribe link in the bottom-left corner of this email.
This is a supplement to our subscription based newsletter, Tharp's Thoughts.
800-385-4486 * 919-466-0043 * Fax 919-466-0408
|
|
|
|
|
|