Tharp's Thoughts Weekly Newsletter
-
Article: February 2016 Market Update:
Bear Volatile Market Type by Van K. Tharp, Ph.D.
-
Workshops: Early Enrollment Discounts End TODAY! on Australian Workshops!
-
-
Tip: February 2016 System Quality Number ® Report by Van K. Tharp, Ph.D.
-
$700 Early Enrollment Discounts END TODAY!
We still have a seat for you! Register TODAY while early enrollment discounts are still available. Plus, see our recently reduced pricing on two of the events below!

Australian Dollar to US Dollar Exchange Rate Relief!
We are REDUCING prices on two workshops in Sydney this month.
We have dropped the price by more than $800 (AUD) on Peak Performance 101 and Blueprint for Trading Success to help offset the current exchange rate.
Learn more...
Feature Article
February 2016 Market Update:
Bear Volatile Market Type
by Van K. Tharp, Ph.D.
Click here to resolve formatting problems
I always say that people do not trade the markets; they trade their beliefs about the markets. In that same way, I'd like to point out that these updates reflect my beliefs. If my beliefs and your beliefs are not the same, you may not find them useful. I find the market update information useful for my trading, so I do the work each month and am happy to share that information with my readers.
However, if your beliefs are not similar to mine, then this information may not be useful to you. Thus, if you are inclined to do some sort of intellectual exercise to prove one of my beliefs wrong, simply remember that everyone can usually find lots of evidence to support their beliefs and refute others. Just simply know that I admit that these are my beliefs and that your beliefs might be different.
These monthly updates are in the first issue of Tharp's Thoughts each month. This allows us to get the closing month's data. These updates cover 1) the market type (first mentioned in the April 30, 2008 edition of Tharp's Thoughts), 2) the five week status on each of the major US stock market indices, 3) our four star inflation-deflation model plus John Williams' statistics, and 4) tracking the dollar. I will now report on the strongest and weakest areas of the overall market as a separate SQN™ Report. And that may come out twice a month if there are significant market charges.
Part I: The Big Picture
So what’s going on in the world? First, we have China experiencing massive economic problems. Second, we have Europe falling apart with people in many European nations thinking that the European Union will end. Third we have negative interest rates in Japan. Fourth, we are having a crash in oil and commodities. And even though the US has been in a recession that started in 2000 (based upon real numbers), we have the strongest economy around despite our massive debt.
So what are the markets telling us now? Over the last 100 days, the S&P 500 went down -2.76%. The Market SQN score for 100 day periods was bearish for 14 out of 20 trading days in the month of February. The remaining 6 days showed a sideways market. The S&P 500 remained in the volatile category throughout the entire month of February. Nevertheless, if the rally that started at the end of the February continues, that could easily push the market into sideways territory again soon.
Three out of our four Market SQN periods are bearish right now — 200 days, 100 days, and 50 days. The 25 day score is sideways. Thus, in my opinion, we are in a bear market. This is still, however, not an “official” bear market (down 20% or more) but that could easily change within a month.
Debt Clock
The State of the United States |
Month Ending |
National Debt |
Federal Tax Revenue |
Federal Spending |
Trade Deficit |
Debt Per Family |
Unfunded Liabilities |
Taxpayers |
People supported by them |
July 31 2012 |
$15.93 trillion |
$2.364 trillion |
$3.632 trillion |
$810 billion |
$684,405 |
|
|
|
Dec 30 2012 |
$16.42 trillion |
$2.452 trillion |
$3.540 trillion |
$740.7 billion |
$732,086 |
|
|
|
July 31, 2013 |
$16.89
Trillion |
$2.73
trillion |
$3.535 trillion |
$703 billion |
$748,458 |
Unfunded Liabilities |
115.2 million |
109.9M
95.4% |
Dec 31, 2013 |
$17.27 trillion |
$2,82 trillion |
$3,480 trillion |
$692 billion |
$751,294 |
$127.2 trillion |
115.0 million |
108.5M
94.3% |
Aug 31, 2014 |
$17.70 trillion |
$2.97 trillion |
$3.53 trillion |
$706 billion |
$757,297 |
$118.0
trillion |
116.5 million |
104.5M
90.0% |
Dec 31, 2014 |
$18.04 trillion |
$3.08 trillion |
$3.57 trillion |
$713.2 billion |
$733,741 |
$92.5 trillion |
117.3 million |
104.4M
89.0% |
Jul 31, 2015 |
$18.32 trillion |
$3.15 trillion |
$3.65 trillion |
$723.4 billion |
$753,212 |
$97.2 trillion |
118.7 million |
105.0M
88.4% |
Aug 31, 2015 |
$18.37 trillion |
$3.16 trillion |
$3.66 trillion |
$729.7 billion |
$753,533 |
$97.5 trillion |
118.9 million |
104.9M 88.2% |
Sep 30, 2015 |
$18.41 trillion |
$3.18 trillion |
$3.68 trillion |
$726.6 billion |
$800,855 |
$97.7 trillion |
119.0 million |
105M
88.2% |
Oct 31, 2015 |
$18.43 trillion |
$3.26 trillion |
$3.70 trillion |
$736.9
billion |
$805,560 |
$98.8 trillion |
119.2 million |
105M
88.1% |
Nov 30, 2015 |
$18.71 trillion |
$3.29 trillion |
$3.72 trillion |
$732.4 billion |
$810,044 |
$100.3 trillion |
119.4 million |
105.1M
88.0% |
Dec 31, 2015 |
$18.51 trillion |
$3.30 trillion |
$3.74 trillion |
$731.1 billion |
$789,359 |
$100.7 trillion |
119.6 million |
105.1M
87.9% |
Jan 31, 2016 |
$18.96 trillion |
$3.31 trillion |
$3.76 trillion |
$732.1 billion |
$793,400 |
$101.0 trillion |
119.6
Million |
105.5M
88.0% |
Feb 29, 2016 |
$19.06 trillion |
$3.33 trillion |
$3.78 trillion |
$739.7 billion |
$796,710 |
$101.3 trillion |
119.6 million |
105.6M
88.2% |
So in February, usdebtclock.org says our official debt went over the $19 trillion mark and stands now at $19.06 trillion. To put that number in a different form — your family’s share of the US debt went up about $3,300 last month. Subtract that from your taxes and what you earned last month and it really gives you a good estimate of how unprofessional our government is. And by the way, politics is a game where candidates argue over non-relative issues and stir up the public. Anyone who campaigns on real reform — such as starting a plan to eliminate deficit spending (much less the debt) is considered to be too far out there to be a legitimate candidate. That’s why I tend to consider politics as a joke. The voting choice for President of the United States this year might come down to Hillary Clinton and Donald Trump? Come on.
Incidentally, the website says there are 119.6 million taxpayers. It also says 161.2 million receive government support, however, I’m not sure how they determine that figure as some of the sections there are certainly duplicated. As a result, I add together US Retirees (49.5 million) food stamp recipients (45.2 million) and disabled people drawing social security (10.8 million). I don’t think there is any overlap here. Those groups total 105.6 million and that’s why I say that they constitute a group that’s 88.2% of the number of taxpayers. I could also include all government employees (23.8 million) as among those supported by taxpayers — but they do pay taxes. Remember about 10% of the taxpayers (12.0 million) pay most of the tax revenue.
Part II: The Current Stock Market Type Is Bear Volatile
My market type classification is not predictive but descriptive — rather than telling us what’s going to happen, it simply tells us what’s going on now. Using it is like looking at a trend. You can say, well, it’s going down right now, however, that doesn’t mean that in a few days that the trend might turn up.
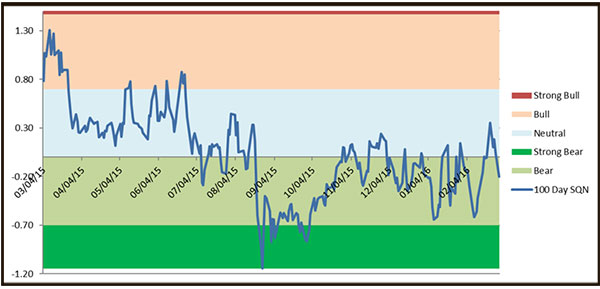
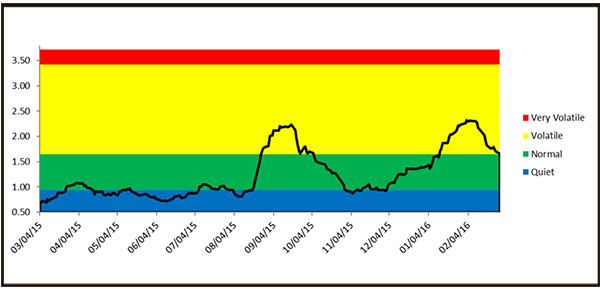
The graphs below include a chart of weekly bars for the S&P 500 over the last year, the Market SQN® score for 100 days, and the ATR percent volatility.
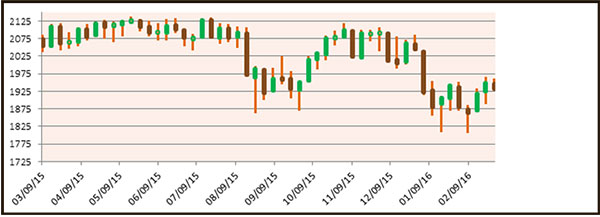
The chart below shows that during the four months the market has been in bear territory and that it spent most of 2015 in either neutral or bear territory. Most of last month was in bear territory but my expectation for a strong bear by the end of the month did not happen.
The third chart shows the volatility and while it was starting to look quite ominous at the beginning of February, it has been declining and moving toward the normal range which is a sign of perhaps a more sideways market condition.
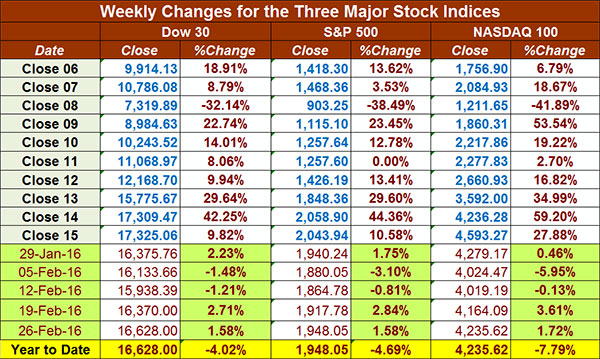
Below is a chart of the recent weekly changes in the three major US Indices. After a very weak January, some new lows in February, the DOW is now down 4.0%, the S&P 500 is down 4.7%, and the NASDAQ 100 is down 7.8% from the start of the new year.
Part III: Our Four Star Inflation-Deflation Model
In the simplest terms, inflation means that stuff gets more expensive, and deflation means that stuff gets cheaper. There’s a correlation between the inflation rate and market levels, so understanding inflation and deflation can help traders understand some important big-picture processes.
See the tracking table below.
Date |
CCI> DBC |
XLB |
Gold |
XLF |
Total Score |
Dec ‘05 |
347.89 |
30.28 |
513 |
31.67 |
|
Dec ‘06 |
394.89 |
34.84 |
635.5 |
36.74 |
|
Dec ‘07 |
476.08 |
41.7 |
833.3 |
28.9 |
|
Dec ‘08 |
352.06 |
22.74 |
865 |
12.52 |
|
Dec ‘09 |
484.42 |
32.99 |
1,104.00 |
14.1 |
|
Dec ‘10 |
629.53 |
38.47 |
1,410.25 |
16 |
|
Dec ‘11 |
564.37 |
33.5 |
1,574.59 |
13 |
|
Dec ’12
CCI>DBC |
556.08
27.79 |
37.54 |
1,564.80 |
16.39 |
1 |
Dec ‘13 |
25.66 |
46.22 |
1201.50 |
21.86 |
-1.5 |
Dec ‘14 |
18.45 |
48.59 |
1199.25 |
24.73 |
-3.0 |
Jun ’15 |
18.00 |
48.39 |
1176.00 |
24.38 |
-1.0 |
Jul ’15 |
15.73 |
45.94 |
1098.40 |
25.18 |
-2.5 |
Aug ’15 |
15.69 |
43.36 |
1135.00 |
23.42 |
-2.5 |
Sep ‘15 |
15.15 |
39.95 |
1114.00 |
22.66 |
-2.0 |
Oct’ 15 |
15.20 |
45.28 |
1142.35 |
24.08 |
-1.5 |
Nov’ 15 |
14.19 |
45.57 |
1061.90 |
24.56 |
-2.0 |
Dec’ 15 |
13.36 |
43.42 |
1062.25 |
23.83 |
-2.0 |
Jan’ 16 |
12.78 |
38.77 |
1111.80 |
21.72 |
0.0 |
Feb ‘16 |
12.75 |
41.80 |
1234.90 |
21.09 |
0.0 |
Here are the model components and how the prices looked at the end of February compared with two months back and six months back.
Month |
DBC2 |
DBC6 |
XLB2 |
XLB6 |
Gold2 |
Gold6 |
XLF2 |
XLF6 |
Total Score |
|
Lower |
Lower |
Lower |
Lower |
Higher |
Higher |
Lower |
Lower |
|
Feb 16 |
|
-1 |
|
-1 |
|
+1 |
|
+1 |
0.0 |
So the first two months of 2016 have been completely neutral. The Federal Reserve started to raise interest rates but they are also very cautious. What they’ve done so far has had little impact on the economy.
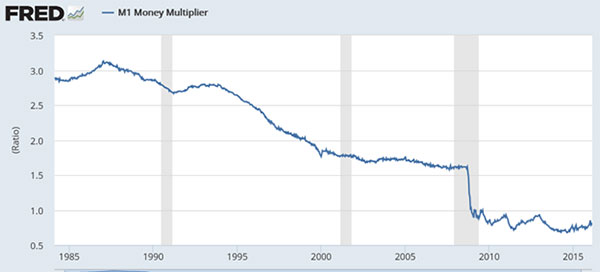
Banks are still not lending money — which is a deflationary sign. This chart from the St. Louis Fed’s website shows the M-1 money multiplier is about 0.785 which means banks are lending about 78% of the money supplied by the Fed. The money multiplier figure used to be more than twice that amount in the years before the global financial crisis. It needs to be much higher than that to really stimulate the economy (and bring back inflation). Around 1987, just to put things in perspective, the money multiplier was over 3.
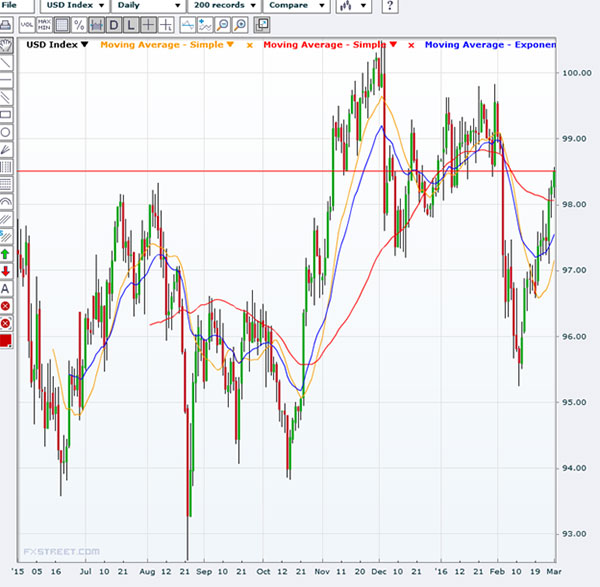
Part IV: Tracking the Dollar
The US Dollar Index was rising throughout most of February and is now close to 99. It’s still quite strong and I’d expect that to continue if the Fed continues to raise interest rates.
Conclusion
The market spent almost all of 2015 in a neutral to down mode. That is the market was sideways and relatively quiet. Those are about the hardest market climates in which to make money trading.
Now, the Chinese economy is not doing well, with their stock market hitting a 13 month low. The US dollar (because we’ve raised interest rates) is the strongest currency, despite our official debt now topping $19 trillion. And although our debt continues to grow at unsustainable rates, we have a deflationary to neutral climate in which the dollar seems to purchase more (meaning that the impact of the debt is growing). Europe is not in good shape. We have a major bear market in commodities. Energy is in a major decline.
While we use market type only to understand what’s happening now, many fundamental factors would suggest that we are due for a significant bear market in 2016. Watch volatility. If it climbs back up, we will finally have a much easier climate in which to make a lot of money in the market.
Harry Dent is predicting a major bear market. Nothing new. Elliot Wave International is predicting a major bear market. Nothing new. And I saw the following headline today.
“Historical Pattern Says the Risk of a 2016 Bear Market Is Zero”
The author’s premise is based on a few days in mid-February. On Feb. 12, 16 and 17, the S&P 500 gained more than 1.5% a day for three consecutive days. Since 1970, this has happened only eight other times. Every single time the S&P 500 gained more than 1.5% a day for three consecutive days, it traded higher a year later. In 1970, 1987 and 2011, the S&P 500 closed at a 52-week low just before soaring higher. In February, 2016, the S&P 500 closed at a 52-week low. So obviously, the conclusion is that the market is going higher.
My conclusion? The market type right now is Bear Volatile. Right now we have a short term rally. Who knows what it will be at the end of next month
Can you make money in this climate? If yes, then do what you do. If no, then your best bet is probably the US dollar — especially in a deflationary environment with a strengthening US dollar.
I will be in Australia at the end of March, so next month’s update will be written by RJ Hixson.
About the Author: Trading coach and author Van K. Tharp, Ph.D. is widely recognized for his best-selling books and outstanding Peak Performance Home Study Program—a highly regarded classic that is suitable for all levels of traders and investors. You can learn more about Van Tharp at www.vantharp.com. His new book, Trading Beyond The Matrix, is available now at matrix.vantharp.com.
|
Workshops
Combo Discounts available for all back-to-back workshops!
See our workshop page for details.
Trading Video
NEW! Swing Trading Video From Ken Long
In July, Dr. Ken Long will teach two new Van Tharp Institute workshops in Cary, North Carolina one of which is titled “Advanced Swing Trading”. In preparation for that new workshop, Dr. Long is running a group of traders through a similar agenda online as the new workshop. The group has been reviewing the swing trading systems rules, evaluating setup opportunities, making trades, and working on their trading skills. In this 16 minute video recorded on March 1, Dr. Long talks about more than a dozen recent swing trade setups, reviews each opportunity, and provides some trade management insights in the issues where entries were triggered.
Trading Tip
February 2016 System Quality Number® Report
The SQN® Report
by D. R. Barton, Jr.
Click here to resolve formatting problems
There are numerous ETFs that now track everything from countries, commodities, currencies and stock market indices to individual market sectors. ETFs provide a wonderfully easy way to discover what’s happening in the world markets. Consequently, I now apply a version of my System Quality Number® (SQN®) score to measure the relative performance of numerous markets in a world model.
The Market SQN score uses the daily percent change for input over a 100-day period. Typically, a Market SQN score over 1.47 is strongly bullish and a score below -0.7 is very weak. The following color codes help communicate the strengths and weaknesses of the ETFs in this report:
- Dark Green: ETFs with very strong SQN® 100 scores > 1.47
- Light Green: ETFs with strong SQN 100 scores (0.70 to 1.47).
- Yellow: ETFs with slightly positive Market SQN scores (0 to 0.70). These are Neutral/Sideways
- Brown: ETFs with slightly negative Market SQN scores (0 to -0.7).
- Red: Very weak ETFs that earn negative Market SQN scores (< -0.7).
This is basically the same ratings that we use for the Market SQN® Score. The world market model spreadsheet report below contains most currently available ETFs; excluding inverse funds and leveraged funds. In short, it covers equity markets around the globe, major asset classes, equity market segments, industrial sectors and major currencies.
World Market Summary – Equities & Currencies
Each month, we look at the equities markets across the globe by region, segment, and sector. Overall, February looks a little weaker than last month.
All of the major US equity groupings are brown (negative) except for the large cap DIA which is at 0.0. The equity markets in the rest of the Americas are also all brown — nothing really “positive” about this picture.
In Asia, three countries are yellow — China, Malaysia, and Thailand. India is red while the remainder of the region is brown. This region is much worse than in January when eight of thirteen Asian ETFs were green or yellow and none were red.
Europe is mostly brown with four red countries — Spain, France, the UK, and Switzerland. There is no yellow this month and again, this is much worse than last month.
The US sector view is quite mixed. There are no greens and only a few yellows — building materials, consumer staples, industrial, REITS, semiconductors, technology, utilities, aerospace, gaming and telecom. To me yellow means sideways and stay away unless you want to short — or go bargain hunting. Homebuilders, biotech, oil and gas exploration, biotech and genome, and regional banks are all red.
The Japanese Yen is the strongest currency despite their negative interest rate policy. The Aussie Dollar, the Brazilian Real, the Euro, and the US Dollar are all yellow (meaning going nowhere). Every other currency is down. Right now the British Pound (because of the perception that the UK is leaving the European Union) is very weak. The Indian Rupee is also weak as is the Indian economy.
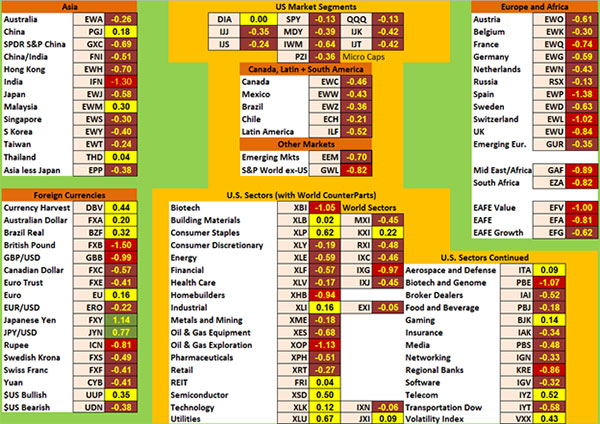
Click here for a larger image.
Commodities, Real Estate, Debt, Top and Bottom Lists
The next table shows real estate, debt instruments, commodities, the top and bottom ETFs for the past 100 days.
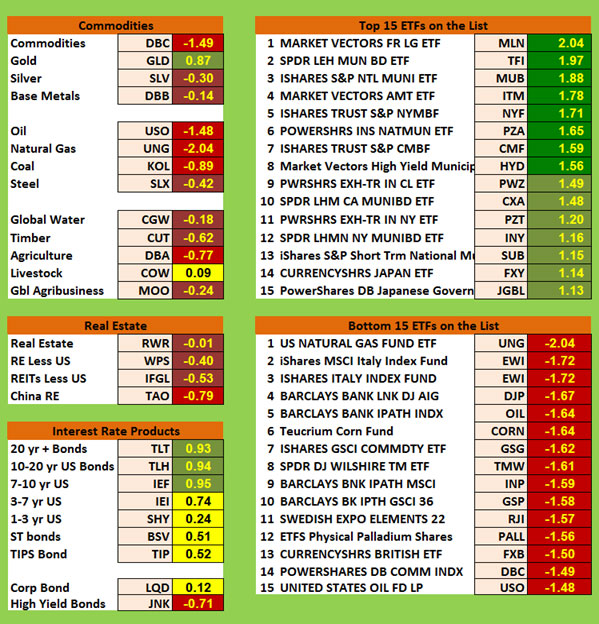
Commodities are still red and brown, with two exceptions — Gold (green) and Livestock (yellow). Everything else is either brown or red. Because there is a lot of fear in the world, gold has finally gained some strength but silver is still down.
Real estate is not doing well. Long term and intermediate term bonds are light green while shorter term bonds are yellow. Corporate bonds are neutral while junk bonds are red.
The top ranking ETFs in the database are now showing eight dark green ETFs — again, mostly municipal bonds this month and they dominate the top ETFs. Six of the ETFs were over +2.0 last month, but only one of them is this month — MLN, long term municipal bonds.
Various commodities, Italy ETFs, and bank ETFs make up the bottom list. Natural gas is the weakest ETF with a score of less than -2.
Summary
Now let’s look at the summary table which measures the percentage of ETFs in each of the strength categories.
Date |
Very
Bullish |
Bullish |
Neutral |
Bearish |
Very
Bearish |
2013 |
> 1.5 |
0.75 - 1.5 |
0 - 0.75 |
0 - -0.7 |
< - 0.7 |
Jan 31st, |
27.1% |
39.6% |
20.7% |
6.4% |
4.7% |
Feb 28th |
10.3% |
45.2% |
24.4% |
11.9% |
7.5% |
Mar 31st |
39.2% |
25.5% |
19.1% |
9.0% |
6.4% |
Apr 30th |
49.1% |
21.1% |
14.8% |
8.0% |
6.2% |
May 31st |
29,2% |
23.6% |
19.9% |
12.3% |
14.2% |
Jun 30th |
2.1% |
31.0% |
23.2% |
22.0% |
20.9% |
Jul 31st |
8.2% |
33.5% |
29.0% |
13.3% |
15.2% |
Aug 30th |
1% |
15% |
46.4% |
19.3% |
17.5% |
Sep 30th |
1% |
13.8% |
42.3% |
23.0% |
19.1% |
Nov 1st |
13.3% |
48.3% |
21.8% |
12.5% |
3.3% |
Dec 1st |
14.6% |
42.7% |
24.2% |
13.3% |
4.3% |
Dec 31st |
19.3.% |
45.5% |
22.0% |
11.3% |
2.9% |
2014 |
|
|
|
|
|
Jan 31st |
8.0% |
49.3% |
20.7% |
12.7% |
7.6% |
Feb 28th |
18.9% |
48.4% |
18.1% |
6.2% |
6.8% |
Mar 31st |
4.9% |
40.2% |
38.8% |
13.3% |
3.1% |
Apr 30th |
11.1% |
33.9% |
40.2% |
11.3% |
1.8% |
May 31st |
12.5% |
46.5% |
27.7% |
7.6% |
6.0% |
Jun 30th |
53.4% |
33.7% |
14.2% |
2.5% |
0.8% |
Aug 29th |
20.3% |
45.2% |
22.8% |
10.5% |
5.3% |
Sep 30th |
6.6% |
26.9% |
30.2% |
24.0% |
18.5% |
Oct 31st |
2.9% |
17.9% |
38.8% |
17.7% |
26.3% |
Nov 30th |
3.1% |
25.7% |
25.1% |
22.8% |
27.9% |
Dec 31st |
3.7% |
29.2% |
24.8% |
15.6% |
31.2% |
2015 |
|
|
|
|
|
Jan 31st |
7.2% |
9.4% |
35.1% |
25.5% |
27.3% |
Feb 28th |
6.4% |
41.1% |
34.5% |
11.5% |
10.9% |
Mar 31st |
2.3% |
24.0% |
46.4% |
19.7% |
12.9% |
April 30th |
1.6% |
13.6% |
69.4% |
15.0% |
5.7% |
June 30th |
1.4% |
15.8% |
48.5% |
29.0% |
10.7% |
July 30th |
0% |
7.2% |
49.7% |
39.0% |
9.4% |
Aug 31st |
0% |
0.4% |
7.6% |
49.7% |
42.3% |
Sept 30th |
0% |
2.7% |
7.6% |
42.7% |
39.8% |
Oct 31st |
1% |
6.0% |
19.5% |
51.3% |
22.2% |
Nov 30th |
0.8% |
3.1% |
38.0% |
42.1% |
16.0% |
Dec 31st |
1.4% |
1.6% |
16.8% |
56.1% |
24.2% |
2016 |
|
|
|
|
|
Jan 31st |
1.9% |
7.0% |
27.5% |
48.5% |
15.0% |
Feb 29th |
1.6% |
5.7% |
18.5% |
51.9% |
22.4% |
Four months ago 92% of the ETFs we track were either in bear territory or strong bear territory. That number was 78.3% two months ago, and 63.5% last month. This month, ETFs in the bear and strong bear categories moved back up to 74.3%. We are in a mild bear market which could get worse. Watch volatility.
Be careful to base your actions upon what is happening, not what you think might happen.
The March SQN Report will be written by RJ Hixson as I will be in Australia. Oh, and watch the Aussie Dollar while I’m there. I’d expect an uptrend as that typically happens when I travel overseas.
The markets always offer opportunities, but to capture those opportunities, you MUST know what you are doing. If you want to trade these markets, you need to approach them as a trader, not a long-term investor. We’d like to help you learn how to trade professionally because trying to navigate the markets without an education is hazardous to your wealth. All the beliefs given in this update are my own. Though I find them useful, you may not. You can only trade your own beliefs about the markets.
Free Book We're Giving You a FREE Book!
TRADING BEYOND THE MATRIX
The Red Pill for Traders and Investors
We pay for the book, you pay for shipping.
ALL YOU HAVE TO DO IS CLICK HERE!
Below is a brief video on how powerful this book is to traders.

Swing Trading Systems E-Learning Course
 The new Swing Trading Systems home study course is now available! Learn with Dr. Ken Long as he teaches his Swing Trading Systems Workshop via streaming video! The new Swing Trading Systems home study course is now available! Learn with Dr. Ken Long as he teaches his Swing Trading Systems Workshop via streaming video!
This new e-learning course includes Ken Long's Swing Trading Workshop, 5 swing trading systems and a bonus workshop featuring Van Tharp on Tharp Think principles. The course also includes extensive downloadable files to support your learning.
You can complete this course at your own pace, from the comfort of your own home or office, and access the materials as many times as you wish during your 1 year subscription period.
Take a look at this video from Ken to learn more about this course.

We have extensive information about the Swing Trading System e-learning course, including how to purchase...click the link below!
Learn More About The Swing E-Learning Course...
Matrix Contest
 Enter the Matrix Contest Enter the Matrix Contest
for a chance to win a free workshop!
We want to hear about the one most profound insight that you got from reading Van's new book, Trading Beyond the Matrix, and how it has impacted your life. If you would like to enter, send an email to [email protected].
If you haven't purchased Trading Beyond the Matrix yet, click here.
For more information about the contest, click here.
Ask Van...
Everything we do here at the Van Tharp Institute is focused on helping you improve as a trader and investor. Consequently, we love to get your feedback, both positive and negative!
Send comments or ask Van a question by clicking here.
Also, Click here to take our quick, 6-question survey.
Back to Top
Contact Us
Email us at [email protected]
The Van Tharp Institute does not support spamming in any way, shape or form. This is a subscription based newsletter.
To change your e-mail Address, e-mail us at [email protected].
To stop your subscription, click on the "unsubscribe" link at the bottom left—hand corner of this email.
How are we doing? Give us your feedback! Click here to take our quick survey.
Call us at: 800-385-4486 * 919-466-0043 * Fax 919-466-0408
SQN® and the System Quality Number® are registered trademarks of the Van Tharp Institute and the International Institute of Trading Mastery, Inc.
Be sure to check us out on Facebook and Twitter!
 
Back to Top |
|
March 2, 2016 #774

Our Mission
Van's Top-Twelve Favorite Trading Books
Van's Favorite Non-Trading Books
Viewing on-line eliminates spacing, and formatting problems that you may experience in your email program.
Ongoing Contest: Learn how you could win a $50 coupon and a grand prize of a free workshop!
www.youtube.com/vantharp
How are we doing?
Give us your feedback!
Click here to take our quick survey.
From our reader survey...
"I think the newsletter is
extremely generous and it is a resource I utilize constantly.
I have saved every single one
since I first subscribed."
Trouble viewing this issue?
View Online. »
Van Tharp You Tube Channel
Tharp Concepts Explained...
-
Trading Psychology
-
System Development
-
Risk and R-Multiples
-
Position Sizing
-
Expectancy
-
Business Planning
Learn the concepts...
Trouble viewing this issue?
View Online. »


Check out our home study materials, e-learning courses, and best-selling books.
Click here for products and pricing
What Kind of Trader
Are You? Click below
to take the test.
Tharp Trader Test
Back to Top

Introduction to Position Sizing™ Strategies
E-Learning Course
Perfect for auditory/visual learners who learn more effectively from an instructional format that is full of interactive features!
Only $149
Learn More
Buy Now
SQN® and the System Quality Number® are registered trademarks
of the Van Tharp Institute
|