Tharp's Thoughts Weekly Newsletter
-
Article: January 2016 Market Update:
Sideways/Bear Volatile Market Type, by Van K. Tharp
-
Workshops: Forex Early Discount Ends Next Week!
-
-
Tip: January 2016 SQN ® Report, by Van K. Tharp
-
$700 Early Registration
Discount Ends Next Week!
Forex Trading and Forex Live—Dates Are Confirmed
February 19-23!

Learn to Trade Three Forex Trading Systems with an Edge
Join us for this three-day workshop, and leave prepared to use three different trading systems in the currency markets. Professional Forex Trader and Super Trader graduate Gabriel Grammatidis, teaches these systems that have proven to be profitable in live market trading over the last few years.
Have you ever attended a trading workshop that taught a lot of methodology, and then you found that you had trouble trading the system at home because you had so little experience with it? Gabriel has had that experience, and wants the traders at his workshop to be able to trade the systems when they get back home so he takes a slightly different approach.
Students in his course come away with a solid understanding of the trading process because they practice the setups, entries, and exits in groups with other students in the class. Gabriel makes extensive use of a trading simulator (live history replay) with which actual trades are traded in class as if “live.” So, you leave the workshop already having a good idea on how to trade the systems.
After a thorough review of each system, he slowly walks you through a number of trades on each system that has multiple time frame charts—basically the same screen setup that Gabriel uses to identify setups, entries and exits. All of these trades use recorded historical data run on a software system that reproduces the price charts from the date and time in the live market. You will be able to watch the setups happen as he explains how to get ready for and make the entry, and then how to get ready for and make the exit. After walking the class through several simulations, Gabriel involves the students in the decision process for pattern detection, entry and exits as the acquire competence.
When you get home, you’ll already have a good sense of trading each system—which means you’ll have a running start. And just to be sure, Gabriel provides everyone with pages of additional example trades to take home and study.
Plus, you also have the option to continue with your training in two days of live Forex trading so you can trade the systems live!
Learn more...
Feature Article
January 2016 Market Update:
Sideways/Bear Volatile Market Type
by Van K. Tharp, Ph.D.
Click here to resolve formatting problems
I always say that people do not trade the markets; they trade their beliefs about the markets. In that same way, I'd like to point out that these updates reflect my beliefs. If my beliefs and your beliefs are not the same, you may not find them useful. I find the market update information useful for my trading, so I do the work each month and am happy to share that information with my readers.
However, if your beliefs are not similar to mine, then this information may not be useful to you. Thus, if you are inclined to do some sort of intellectual exercise to prove one of my beliefs wrong, simply remember that everyone can usually find lots of evidence to support their beliefs and refute others. Just simply know that I admit that these are my beliefs and that your beliefs might be different.
These monthly updates are in the first issue of Tharp's Thoughts each month. This allows us to get the closing month's data. These updates cover 1) the market type (first mentioned in the April 30, 2008 edition of Tharp's Thoughts), 2) the five week status on each of the major US stock market indices, 3) our four star inflation-deflation model plus John Williams' statistics, and 4) tracking the dollar. I will now report on the strongest and weakest areas of the overall market as a separate SQN™ Report. And that may come out twice a month if there are significant market charges.
Part I: The Big Picture
So what’s going on in the world?
First, we have had shale oil “fracking” revolution in the US which allowed us to unlock great quantities of domestic oil and become the world’s largest oil producing nation. Saudi Arabia then entered into a production war with the US (against shale oil) to keep production quantity high. This has driven the price of oil down to a level that will drive most of the “fracking” companies out of business. Many simply cannot produce oil profitably at $20 a barrel and about 30% of all American oil exploration and production companies will need to file for bankruptcy. This will cause the high yield bonds from these companies (and junk bonds as a whole) to collapse. This could be deadly for the entire bond market and could actually spill over to the stock market.
There is some long term risk to the strong US Dollar at this point because the Chinese currency will be part of the world’s reserve currency this year and then Saudi Arabia might only accept payments in that currency instead of the dollar. This would remove one of the major props to the US dollar.
China has finally seen a major slowdown. There is no longer a large demand in oil nor a big demand in commodities from China. As a result, the world is in a commodities bear market. Most emerging markets are crashing and they are all doing their best do devalue their currencies (especially with respect to the US Dollar). As a result, US products will become much more expensive to overseas buyers and this will probably impact S&P 500 earnings.
What are the markets telling us now? Over the last 100 days, the S&P 500 went up 0.99% so we are now in a sideways market type. We are sideways, however, only because the S&P 500 went up 2% on the last day of January. The month of January had four days where the market measured sideways (including the last days) and 15 days where it measured bear. Throughout December, there were 4 days that the market type was neutral (sideways) and the rest of the days were all bear. The market is volatile now so that is another sign of bearishness. The Market SQN score for 200 days has also become Bear Volatile.
The Market SQN scores for 25 days and 50 days are both Bear Volatile but they were Strong Bear Volatile before the 2% up move on the last day of the month. Thus in my opinion, we are now in a bear market even though this is still not an “official” bear market (down 20% or more).
Debt Clock
The State of the United States |
Month Ending |
National Debt |
Federal Tax Revenue |
Federal Spending |
Trade Deficit |
Debt Per Family |
Unfunded Liabilities |
Taxpayers |
People supported by them |
July 31 2012 |
$15.93 trillion |
$2.364 trillion |
$3.632 trillion |
$810 billion |
$684,405 |
|
|
|
Dec 30 2012 |
$16.42 trillion |
$2.452 trillion |
$3.540 trillion |
$740.7 billion |
$732,086 |
|
|
|
July 31, 2013 |
$16.89
Trillion |
$2.73
trillion |
$3.535 trillion |
$703 billion |
$748,458 |
Unfunded Liabilities |
115.2 million |
109.9M
95.4% |
Dec 31, 2013 |
$17.27 trillion |
$2,82 trillion |
$3,480 trillion |
$692 billion |
$751,294 |
$127.2 trillion |
115.0 million |
108.5M
94.3% |
Aug 31, 2014 |
$17.70 trillion |
$2.97 trillion |
$3.53 trillion |
$706 billion |
$757,297 |
$118.0
trillion |
116.5 million |
104.5M
90.0% |
Dec 31, 2014 |
$18.04 trillion |
$3.08 trillion |
$3.57 trillion |
$713.2 billion |
$733,741 |
$92.5 trillion |
117.3 million |
104.4M
89.0% |
Jul 31, 2015 |
$18.32 trillion |
$3.15 trillion |
$3.65 trillion |
$723.4 billion |
$753,212 |
$97.2 trillion |
118.7 million |
105.0M
88.4% |
Aug 31, 2015 |
$18.37 trillion |
$3.16 trillion |
$3.66 trillion |
$729.7 billion |
$753,533 |
$97.5 trillion |
118.9 million |
104.9M 88.2% |
Sep 30, 2015 |
$18.41 trillion |
$3.18 trillion |
$3.68 trillion |
$726.6 billion |
$800,855 |
$97.7 trillion |
119.0 million |
105M
88.2% |
Oct 31, 2015 |
$18.43 trillion |
$3.26 trillion |
$3.70 trillion |
$736.9
billion |
$805,560 |
$98.8 trillion |
119.2 million |
105M
88.1% |
Nov 30, 2015 |
$18.71 trillion |
$3.29 trillion |
$3.72 trillion |
$732.4 billion |
$810,044 |
$100.3 trillion |
119.4 million |
105.1M
88.0% |
Dec 31, 2015 |
$18.51 trillion |
$3.30 trillion |
$3.74 trillion |
$731.1 billion |
$789,359 |
$100.7 trillion |
119.6 million |
105.1M
87.9% |
Jan 31, 2016 |
$18.96 trillion |
$3.31 trillion |
$3.76 trillion |
$372.1 billion |
$793,400 |
$101.0 trillion |
$119.6 |
105.2M
88.0% |
The usdebtclock.org website says our official debt in January went from $18.51 trillion to $18.96 trillion or up by $450 billion. Since December 31, 2014, our official debt went up $920 billion but almost half of that amount was just in the last month. Furthermore, the tendency for the government to manipulate our unfunded debt amount seems to have tapered off as it’s now the highest it’s been since November 2014 and has gone over $100 trillion again.
Incidentally, the website says there are 119.6 million taxpayers. It also says there are 161.0 million people receiving government support, however, I’m not sure how they determine that figure as some of the categories certainly seem duplicated. My figure for people receiving government support comes by adding US Retirees (49.3 million), food stamp recipients (45.1 million), and disabled people drawing social security (10.8 million). I don’t think there is any overlap with these groups — which total 105.2 million. This makes a group which constitutes 88.0% of the number of taxpayers. I could also include all government employees (23.9 million) as among those supported by taxpayers — but they do pay taxes. Remember that about 10% of the taxpayers (12.0 million) pay most of the tax revenue in the country.
Part II: The Current Stock Market Type Is Sideways Volatile / Bear Volatile
My market type classification is not predictive but rather descriptive. Rather than telling us what’s going to happen, it simply tells us what’s going on now — which is very much like looking at a trend on a chart. You can say, well, it’s going down, however, in a few days the trend might change.
In this case, my market type looks back 100 days which puts us at September 8th — close to the last lows. The market went up quite a bit over the next 30 days into October 2015. Without a strong move up now, I suspect we could be in strong bear volatile market type by next month.
The graphs below include a chart of weekly bars for the S&P 500 over the last year, the Market SQN® score for 100 days, and the ATR percent volatility.
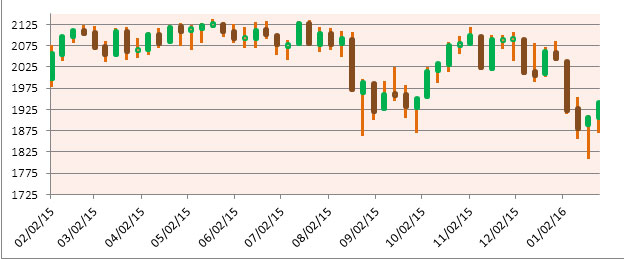
The chart below shows that during the four months the market has been in bear territory and that it spent most of 2015 in either neutral or bear territory. But most of January was in bear territory.
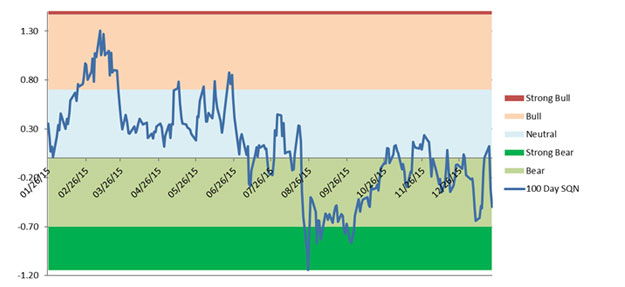
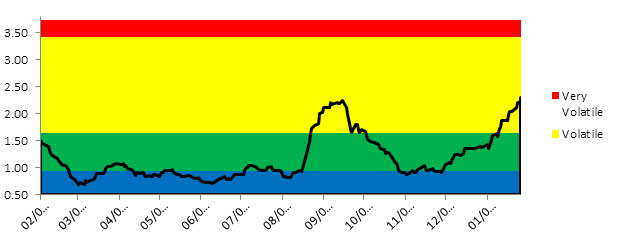
The third chart shows that this market is starting to look quite ominous with a strong trend toward more volatility which is a sign of the bear.
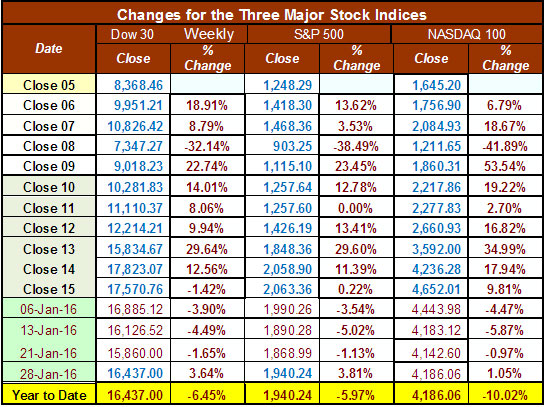
Below is a chart of the recent weekly changes in the three major US Indices. Despite a strong close to the month of January, the DOW is down 6.4%, the S&P500 is down 6%, and NASDAQ 100 is down over 10% for the new year.
Part III: Our Four Star Inflation-Deflation Model
In the simplest terms, inflation means that stuff gets more expensive, and deflation means that stuff gets cheaper. There’s a correlation between the inflation rate and market levels, so understanding inflation and deflation can help traders understand some important big-picture processes.
See the tracking table below.
Date |
CCI> DBC |
XLB |
Gold |
XLF |
Total Score |
Dec ‘05 |
347.89 |
30.28 |
513 |
31.67 |
|
Dec ‘06 |
394.89 |
34.84 |
635.5 |
36.74 |
|
Dec ‘07 |
476.08 |
41.7 |
833.3 |
28.9 |
|
Dec ‘08 |
352.06 |
22.74 |
865 |
12.52 |
|
Dec ‘09 |
484.42 |
32.99 |
1,104.00 |
14.1 |
|
Dec ‘10 |
629.53 |
38.47 |
1,410.25 |
16 |
|
Dec ‘11 |
564.37 |
33.5 |
1,574.59 |
13 |
|
Dec ’12 CCI>DBC |
556.08
27.79 |
37.54 |
1,564.80 |
16.39 |
1 |
Dec ‘13 |
25.66 |
46.22 |
1201.50 |
21.86 |
-1.5 |
Dec ‘14 |
18.45 |
48.59 |
1199.25 |
24.73 |
-3.0 |
Jun ’15 |
18.00 |
48.39 |
1176.00 |
24.38 |
-1.0 |
Jul ’15 |
15.73 |
45.94 |
1098.40 |
25.18 |
-2.5 |
Aug ’15 |
15.69 |
43.36 |
1135.00 |
23.42 |
-2.5 |
Sep ‘15 |
15.15 |
39.95 |
1114.00 |
22.66 |
-2.0 |
Oct’ 15 |
15.20 |
45.28 |
1142.35 |
24.08 |
-1.5 |
Nov’ 15 |
14.19 |
45.57 |
1061.90 |
24.56 |
-2.0 |
Dec’ 15 |
13.36 |
43.42 |
1062.25 |
23.83 |
-2.0 |
Jan’ 16 |
12.78 |
38.77 |
1111.80 |
21.72 |
0.0 |
Here are the model components and how the prices looked at the end of September compared with two months back and six months back.
Month |
DBC2 |
DBC6 |
XLB2 |
XLB6 |
Gold2 |
Gold6 |
XLF2 |
XLF6 |
Total Score |
|
Lower |
Lower |
Lower |
Lower |
Higher |
Higher |
Lower |
Lower |
|
Jan 16 |
|
-1 |
|
-1 |
|
+1 |
|
+1 |
0.0 |
Every month during 2015 was deflationary according to our model except for May. Yet despite that, the Federal Reserve started raising interest rates in December. That suggests down markets for 2016 and more deflation, however, the first month of 2016 was neutral.
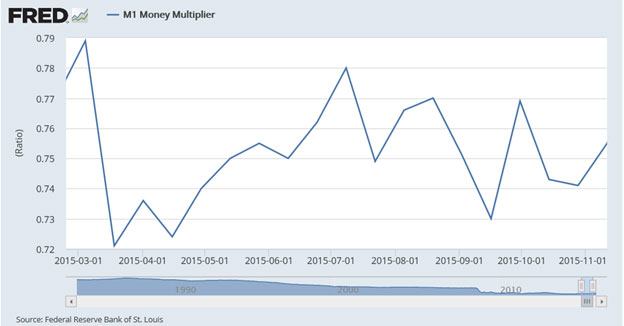
Banks are still not lending money — which is a deflationary sign. This chart from the St. Louis Fed’s website shows the M-1 money multiplier is about 0.75 which means banks are lending about 75% of the money supplied by the Fed. The money multiplier figure used to be more than twice that amount in the years before the global financial crisis. It needs to be much higher (two to three times higher) than that to really stimulate the economy (and bring back inflation).
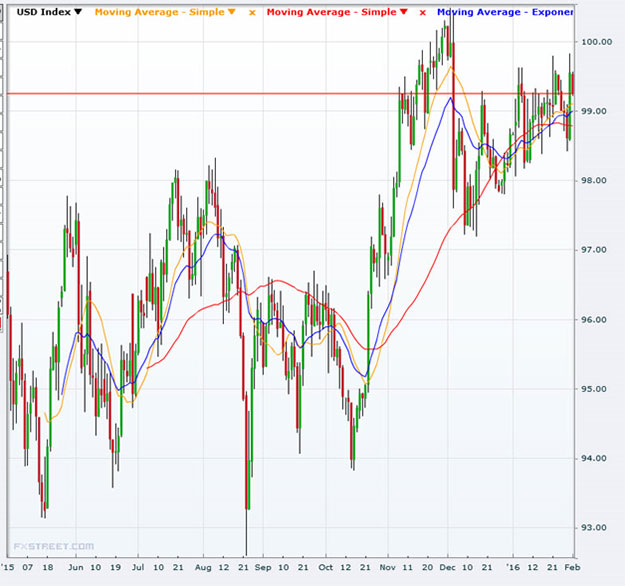
Part IV: Tracking the Dollar
The US Dollar Index has gone down about 2 points since its highs last month. But it is still in a general uptrend and I’d expect that to continue if the Fed continues to raise interest rates.
Conclusion
The market spent almost all of 2015 in a neutral to slightly down direction. That is, the market was sideways with relatively quiet volatility. Those are about the hardest market climates in which to make money. The Chinese economy is not doing well, with their stock market hitting a 13-month low. The US dollar (because we’ve raised interest rates) is the strongest currency despite our official debt reaching nearly $19 trillion. And although our debt continues to grow at unsustainable rates, we have a deflationary climate in which the dollar seems to purchase more (meaning that the impact of the debt is growing). Europe is not in good shape. Energy is in a major decline and we have a major bear market in commodities.
While we do not use market type to predict, just to tell us what is happening right now, the fundamentals would suggest that we are due for a significant bear market in 2016. Watch volatility. If it continues to climb, then we will finally have an easy climate in which to make a lot of money in the market.
As I say every month, notice what the market is doing. Right now the market is Sideways Volatile to Bear Volatile. Can you make money in this climate? If yes, then do what you do. If no, then your best bet is probably the US dollar — especially in a deflationary environment with a strong US dollar.
Until next month’s update, this is Van Tharp.
About the Author: Trading coach and author Van K. Tharp, Ph.D. is widely recognized for his best-selling books and outstanding Peak Performance Home Study Program—a highly regarded classic that is suitable for all levels of traders and investors. You can learn more about Van Tharp at www.vantharp.com. His new book, Trading Beyond The Matrix, is available now at matrix.vantharp.com.
|
Workshops
Combo Discounts available for all back-to-back workshops!
See our workshop page for details.
Trading Video
Trading Videos From Ken Long
Ken goes through several case studies in this 16 minute video describing his approach to “swing trading, one day at a time”. The market type is his starting point and Ken goes on to describe how he looks at his daily report to find swing trade setups that present good intraday trade opportunities. He explains how several trades worked on January 28 last week based on this approach.
Ken details a series of RLCO trades in the inverse volatility ETF (XIV) and some scaling-in considerations in this 13 minute video from Monday evening, February 1. He also shares some trades from one of the traders in the chat room who was trading the breakout from sideways quiet channels in two different symbols. Ken finishes with a short review of his daily market report from Monday evening. 
Trading Tip
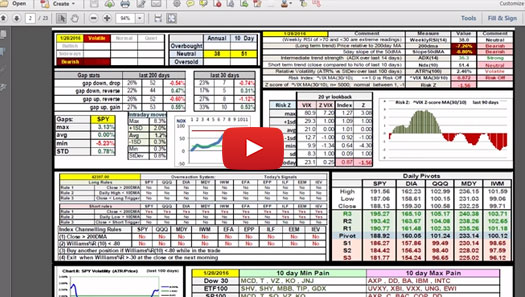
January 2016 System Quality Number® Report
The SQN® Report
by Van K. Tharp, Ph.D.
Click here to resolve formatting problems
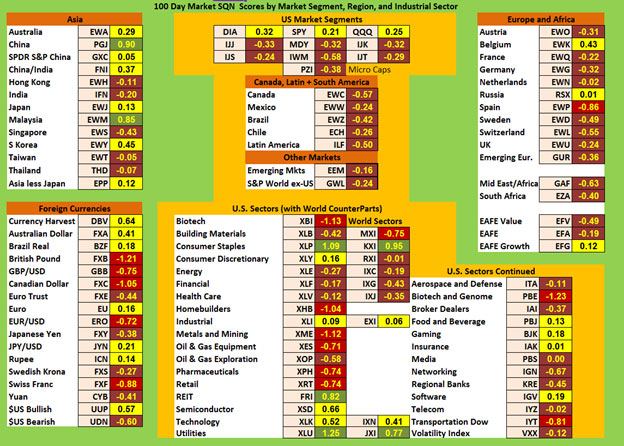
There are numerous ETFs that now track everything from countries, commodities, currencies and stock market indices to individual market sectors. ETFs provide a wonderfully easy way to discover what’s happening in the world markets. Consequently, I now apply a version of my System Quality Number® (SQN®) score to measure the relative performance of numerous markets in a world model.
The Market SQN score uses the daily percent change for input over a 100-day period. Typically, a Market SQN score over 1.47 is strongly bullish and a score below -0.7 is very weak. The following color codes help communicate the strengths and weaknesses of the ETFs in this report:
- Dark Green: ETFs with very strong SQN® 100 scores > 1.47
- Light Green: ETFs with strong SQN 100 scores (0.70 to 1.47).
- Yellow: ETFs with slightly positive Market SQN scores (0 to 0.70). These are Neutral/Sideways
- Brown: ETFs with slightly negative Market SQN scores (0 to -0.7).
- Red: Very weak ETFs that earn negative Market SQN scores (< -0.7).
This is basically the same ratings that we use for the Market SQN® Score. The world market model spreadsheet report below contains most currently available ETFs; excluding inverse funds and leveraged funds. In short, it covers the geographic world, the major asset classes, the equity market segments, the industrial sectors and the major currencies. World Market Summary — Equities & Currencies
Each month, we look at the equities markets across the globe by segment, region and sector. This month looks a little stronger overall than last month.
All of the market segments in the US are brown except for the three large cap ETFs — DIA, SPY and QQQ which are slightly positive. The rest of the countries in the Americas — Mexico, Canada, Latin America, Brazil, and Chile are brown. But last month they were red.
In Asia there is a little bit a green (China and Malaysia) and quite a bit of yellow. The only brown areas are Hong Kong, India, Singapore, Taiwan, and Thailand.
Europe is mostly brown with one red country — Spain and two yellow countries - Belgium and Russia. Everything else is brown. This is also stronger than last month.
The US sector view is quite mixed. There are a few greens — REITS, Utilities, and Consumer Staples. There are also a few yellows — Consumer Discretionary, Industrial, Semiconductors, Technology, Food and Beverage, Gaming, Insurance, and Software. There are also a number of reds (down a lot) which include Biotech, Homebuilders, Metals and Mining, Oil and Gas Equipment, Pharmaceuticals, Retail, Biotech and Genome, and Transportation. The rest of the sectors are brown.
Seven currencies are yellow, while five are now red. The US Dollar is the highest, followed by the Australian Dollar, the Rupee, the Real, and the Euro. The British Pound, the Canadian Dollar, and the Swiss Franc are all very weak. The Yuan will be given reserve currency status in 2016 by the IMF — which could have long term bearish implications for the US Dollar.
Commodities, Real Estate, Debt, Top and Bottom Lists
The next chart shows real estate, debt instruments, commodities and the top and bottom ETFs for the past 100 days.
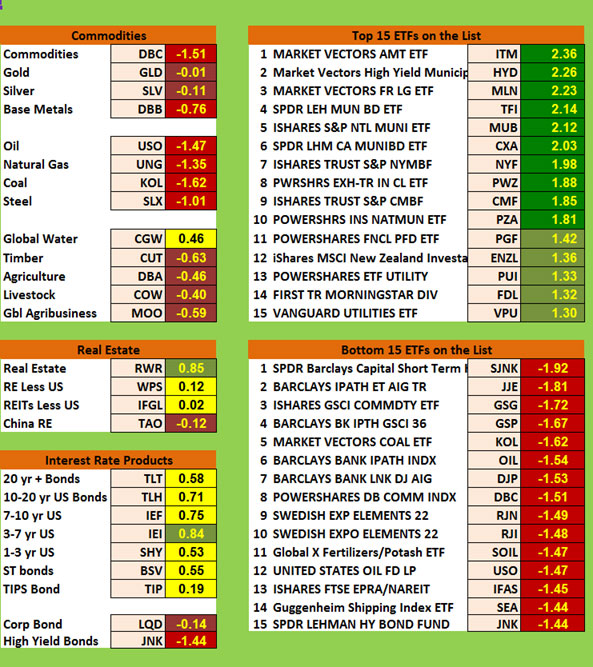
Commodities are still red and brown, with global water at +.46 as the only exception. Coal, commodities, natural gas, steel and base metals are all red. Timber, agriculture, livestock, and global agriculture are all brown. Natural gas, steel, and commodities in general are all below -1.0.
In real estate, U.S. real estate is light green while Chinese real estate is brown.
Debt was mostly light green two months ago but now it is mostly yellow. Junk bonds are now red, indicating a lack of faith in them, however, many muni bonds show up in the strongest ETF list.
The top ranking ETFs in the database now show 10 ETFs that are dark green -- mostly municipal bonds. And municipal bond ETFs dominate the top list. None of the ETFs were over +2.0 last month, but six of them are over 2.0 this month.
The bottom list no longer includes any ETFs with SQN scores below -2.0. The bottom 15 are all at or below negative 1.4.
Summary
Now let’s look at the summary table which measures the percentage of ETFs in each of the strength categories.
Date |
Very
Bullish |
Bullish |
Neutral |
Bearish |
Very
Bearish |
2013 |
> 1.5 |
0.75 - 1.5 |
0 - 0.75 |
0 - -0.7 |
< - 0.7 |
Jan 31st, |
27.1% |
39.6% |
20.7% |
6.4% |
4.7% |
Feb 28th |
10.3% |
45.2% |
24.4% |
11.9% |
7.5% |
Mar 31st |
39.2% |
25.5% |
19.1% |
9.0% |
6.4% |
Apr 30th |
49.1% |
21.1% |
14.8% |
8.0% |
6.2% |
May 31st |
29,2% |
23.6% |
19.9% |
12.3% |
14.2% |
Jun 30th |
2.1% |
31.0% |
23.2% |
22.0% |
20.9% |
Jul 31st |
8.2% |
33.5% |
29.0% |
13.3% |
15.2% |
Aug 30th |
1% |
15% |
46.4% |
19.3% |
17.5% |
Sep 30th |
1% |
13.8% |
42.3% |
23.0% |
19.1% |
Nov 1st |
13.3% |
48.3% |
21.8% |
12.5% |
3.3% |
Dec 1st |
14.6% |
42.7% |
24.2% |
13.3% |
4.3% |
Dec 31st |
19.3.% |
45.5% |
22.0% |
11.3% |
2.9% |
2014 |
|
|
|
|
|
Jan 31st |
8.0% |
49.3% |
20.7% |
12.7% |
7.6% |
Feb 28th |
18.9% |
48.4% |
18.1% |
6.2% |
6.8% |
Mar 31st |
4.9% |
40.2% |
38.8% |
13.3% |
3.1% |
Apr 30th |
11.1% |
33.9% |
40.2% |
11.3% |
1.8% |
May 31st |
12.5% |
46.5% |
27.7% |
7.6% |
6.0% |
Jun 30th |
53.4% |
33.7% |
14.2% |
2.5% |
0.8% |
Aug 29th |
20.3% |
45.2% |
22.8% |
10.5% |
5.3% |
Sep 30th |
6.6% |
26.9% |
30.2% |
24.0% |
18.5% |
Oct 31st |
2.9% |
17.9% |
38.8% |
17.7% |
26.3% |
Nov 30th |
3.1% |
25.7% |
25.1% |
22.8% |
27.9% |
Dec 31st |
3.7% |
29.2% |
24.8% |
15.6% |
31.2% |
2015 |
|
|
|
|
|
Jan 31st |
7.2% |
9.4% |
35.1% |
25.5% |
27.3% |
Feb 28th |
6.4% |
41.1% |
34.5% |
11.5% |
10.9% |
Mar 31st |
2.3% |
24.0% |
46.4% |
19.7% |
12.9% |
April 30th |
1.6% |
13.6% |
69.4% |
15.0% |
5.7% |
June 30th |
1.4% |
15.8% |
48.5% |
29.0% |
10.7% |
July 30th |
0% |
7.2% |
49.7% |
39.0% |
9.4% |
Aug 31st |
0% |
0.4% |
7.6% |
49.7% |
42.3% |
Sept 30th |
0% |
2.7% |
7.6% |
42.7% |
39.8% |
Oct 31st |
1% |
6.0% |
19.5% |
51.3% |
22.2% |
Nov 30th |
0.8% |
3.1% |
38.0% |
42.1% |
16.0% |
Dec 31st |
1.4% |
1.6% |
16.8% |
56.1% |
24.2% |
2016 |
|
|
|
|
|
Jan 31st |
1.9% |
7.0% |
27.5% |
48.5% |
15.0% |
Four months ago 92% of the ETFs we track are either in bear territory or strong bear territory. That number was 78.3% last month. And this month it has moved down to 63.5%. We are in a mild bear market which could get worse. Watch volatility
Be careful to base your actions upon what is happening, not what you think might happen.
Until the February SQN Report this is Van Tharp.
The markets always offer opportunities, but to capture those opportunities, you MUST know what you are doing. If you want to trade these markets, you need to approach them as a trader, not a long-term investor. We’d like to help you learn how to trade professionally because trying to navigate the markets without an education is hazardous to your wealth. All the beliefs given in this update are my own. Though I find them useful, you may not. You can only trade your own beliefs about the markets.
Free Book We're Giving You a FREE Book!
TRADING BEYOND THE MATRIX
The Red Pill for Traders and Investors
We pay for the book, you pay for shipping.
ALL YOU HAVE TO DO IS CLICK HERE!
Below is a brief video on how powerful this book is to traders.

Swing Trading Systems E-Learning Course
 The new Swing Trading Systems home study course is now available! Learn with Dr. Ken Long as he teaches his Swing Trading Systems Workshop via streaming video! The new Swing Trading Systems home study course is now available! Learn with Dr. Ken Long as he teaches his Swing Trading Systems Workshop via streaming video!
This new e-learning course includes Ken Long's Swing Trading Workshop, 5 swing trading systems and a bonus workshop featuring Van Tharp on Tharp Think principles. The course also includes extensive downloadable files to support your learning.
You can complete this course at your own pace, from the comfort of your own home or office, and access the materials as many times as you wish during your 1 year subscription period.
Take a look at this video from Ken to learn more about this course.

We have extensive information about the Swing Trading System e-learning course, including how to purchase...click the link below!
Learn More About The Swing E-Learning Course...
Matrix Contest
 Enter the Matrix Contest Enter the Matrix Contest
for a chance to win a free workshop!
We want to hear about the one most profound insight that you got from reading Van's new book, Trading Beyond the Matrix, and how it has impacted your life. If you would like to enter, send an email to [email protected].
If you haven't purchased Trading Beyond the Matrix yet, click here.
For more information about the contest, click here.
Ask Van...
Everything we do here at the Van Tharp Institute is focused on helping you improve as a trader and investor. Consequently, we love to get your feedback, both positive and negative!
Send comments or ask Van a question by clicking here.
Also, Click here to take our quick, 6-question survey.
Back to Top
Contact Us
Email us at [email protected]
The Van Tharp Institute does not support spamming in any way, shape or form. This is a subscription based newsletter.
To change your e-mail Address, e-mail us at [email protected].
To stop your subscription, click on the "unsubscribe" link at the bottom left—hand corner of this email.
How are we doing? Give us your feedback! Click here to take our quick survey.
Call us at: 800-385-4486 * 919-466-0043 * Fax 919-466-0408
SQN® and the System Quality Number® are registered trademarks of the Van Tharp Institute and the International Institute of Trading Mastery, Inc.
Be sure to check us out on Facebook and Twitter!
 
Back to Top |
|
February 3, 2016 #770

Our Mission
Van's Top-Twelve Favorite Trading Books
Van's Favorite Non-Trading Books
Viewing on-line eliminates spacing, and formatting problems that you may experience in your email program.
Ongoing Contest: Learn how you could win a $50 coupon and a grand prize of a free workshop!
www.youtube.com/vantharp
How are we doing?
Give us your feedback!
Click here to take our quick survey.
From our reader survey...
"I think the newsletter is
extremely generous and it is a resource I utilize constantly.
I have saved every single one
since I first subscribed."
Trouble viewing this issue?
View Online. »
Van Tharp You Tube Channel
Tharp Concepts Explained...
-
Trading Psychology
-
System Development
-
Risk and R—Multiples
-
Position Sizing
-
Expectancy
-
Business Planning
Learn the concepts...
Trouble viewing this issue?
View Online. »


Check out our home study materials, e-learning courses, and best-selling books.
Click here for products and pricing
What Kind of Trader
Are You? Click below
to take the test.
Tharp Trader Test
Back to Top

Introduction to Position Sizing™ Strategies
E-Learning Course
Perfect for auditory/visual learners who learn more effectively from an instructional format that is full of interactive features!
Only $149
Learn More
Buy Now
SQN® and the System Quality Number® are registered trademarks
of the Van Tharp Institute
|