Tharp's Thoughts Weekly Newsletter
-
Article: December 2015 Market Update:
Bear Normal Market Type, by Van K. Tharp, Ph.D.
-
Workshops: $700 Early Enrollment Discounts End Next Week on Jan Events!
-
-
Tip: December 2015 System Quality Number ® Report
The SQN ® Report by Van K. Tharp, Ph.D.
-
Last Chance...Our 20% Off Sale Ends TODAY!

And, the $700 Early Enrollment Discounts Expire Next Week on January Workshops.
Today is the last day to order VTI's home study materials at a significant discount. Some package prices are reduced even more.
Click here to see which items you'd like to get today.
Also, Remember to ask for a free Trading Beyond the Matrix Book with your order.
Feature Article
December 2015 Market Update:
Bear Normal Market Type
by Van K. Tharp, Ph.D.
Click here to resolve formatting problems
I always say that people do not trade the markets; they trade their beliefs about the markets. In that same way, I'd like to point out that these updates reflect my beliefs. If my beliefs and your beliefs are not the same, you may not find them useful. I find the market update information useful for my trading, so I do the work each month and am happy to share that information with my readers.
However, if your beliefs are not similar to mine, then this information may not be useful to you. Thus, if you are inclined to do some sort of intellectual exercise to prove one of my beliefs wrong, simply remember that everyone can usually find lots of evidence to support their beliefs and refute others. Just simply know that I admit that these are my beliefs and that your beliefs might be different.
These monthly updates are in the first issue of Tharp's Thoughts each month. This allows us to get the closing month's data. These updates cover 1) the market type (first mentioned in the April 30, 2008 edition of Tharp's Thoughts), 2) the five week status on each of the major US stock market indices, 3) our four star inflation-deflation model plus John Williams' statistics, and 4) tracking the dollar. I will now report on the strongest and weakest areas of the overall market as a separate SQN™ Report. And that may come out twice a month if there are significant market charges.
Part I: The Big Picture
Over the last 100 days, the market went up 2.86% though we are now in a bear market type. Throughout December, we had 4 days of neutral (sideways) direction but the rest was all bear. Volatility, however, did not pick up that much in December.
The short term market type based on the 25 day Market SQN score is Bear Normal, the 50 day market type is Neutral Normal, and both the 100 and 200 day market types are Bear Normal.
By my classification system, the market spent several months in bear territory starting in late August but the most it was ever down was about 10%. Thus, that period never had what people call an official bear market — when the market is down 20% or more. That could easily happen in 2016, however, because the Federal Reserve started raising interest rates in December.
Debt Clock
The State of the United States |
Month Ending |
National Debt |
Federal Tax Revenue |
Federal Spending |
Trade Deficit |
Debt Per Family |
Unfunded Liabilities |
Taxpayers |
People supported by them |
July 31 2012 |
$15.93 trillion |
$2.364 trillion |
$3.632 trillion |
$810 billion |
$684,405 |
|
|
|
Dec 30 2012 |
$16.42 trillion |
$2.452 trillion |
$3.540 trillion |
$740.7 billion |
$732,086 |
|
|
|
July 31, 2013 |
$16.89
Trillion |
$2.73
trillion |
$3.535 trillion |
$703 billion |
$748,458 |
Unfunded Liabilities |
115.2 million |
109.9M
95.4% |
Dec 31, 2013 |
$17.27 trillion |
$2,82 trillion |
$3,480 trillion |
$692 billion |
$751,294 |
$127.2 trillion |
115.0 million |
108.5M
94.3% |
Aug 31, 2014 |
$17.70 trillion |
$2.97 trillion |
$3.53 trillion |
$706 billion |
$757,297 |
$118.0
trillion |
116.5 million |
104.5M
90.0% |
Dec 31, 2014 |
$18.04 trillion |
$3.08 trillion |
$3.57 trillion |
$713.2 billion |
$733,741 |
$92.5 trillion |
117.3 million |
104.4M
89.0% |
Jul 31, 2015 |
$18.32 trillion |
$3.15 trillion |
$3.65 trillion |
$723.4 billion |
$753,212 |
$97.2 trillion |
118.7 million |
105.0M
88.4% |
Aug 31, 2015 |
$18.37 trillion |
$3.16 trillion |
$3.66 trillion |
$729.7 billion |
$753,533 |
$97.5 trillion |
118.9 million |
104.9M 88.2% |
Sep 30, 2015 |
$18.41 trillion |
$3.18 trillion |
$3.68 trillion |
$726.6 billion |
$800,855 |
$97.7 trillion |
119.0 million |
105M
88.2% |
Oct 31, 2015 |
$18.43 trillion |
$3.26 trillion |
$3.70 trillion |
$736.9
billion |
$805,560 |
$98.8 trillion |
119.2 million |
105M
88.1% |
Nov 30, 2015 |
$18.71 trillion |
$3.29 trillion |
$3.72 trillion |
$732.4 billion |
$810,044 |
$100.3 trillion |
119.4 million |
105.1M
88.0% |
Dec 31, 2015 |
$18.51 trillion |
$3.30 trillion |
$3.74 trillion |
$731.1 billion |
$789,359 |
$100.7 trillion |
119.6 million |
105.1M
87.9% |
So in 2015, usdebtclock.org says our official debt went from $18.04 trillion to $18.51 trillion or up by $470 billion. Furthermore, the tendency for the government to manipulate our unfunded debt amount seems to have tapered off as it’s now the highest it’s been since November 2014 and has gone over $100 trillion again.
Part II: The Current Stock Market Type Is Bear Normal.
My market type classification is not predictive but rather descriptive. Rather than telling us what’s going to happen, it simply tells us what’s going on now — which looks like a trend. You can say, well, it’s going down, however, that doesn’t mean that it will keep going down. In a few days, that trend might change.
The graphs below include a chart of weekly bars for the S&P 500 over the last year, the Market SQN® score for 100 days, and the ATR percent volatility.
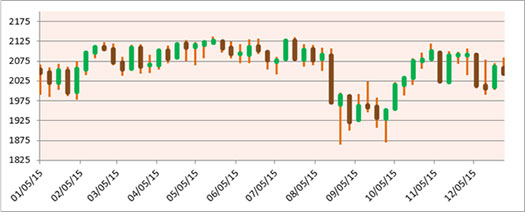
While the market was in bear territory for about four months, it spent most of 2015 in neutral. 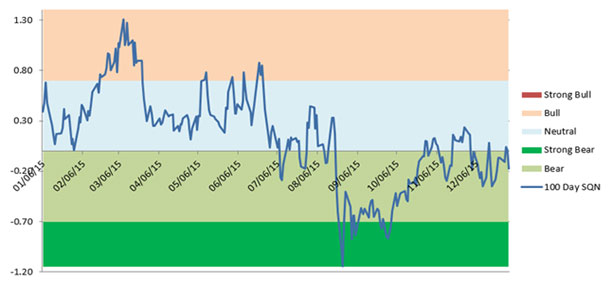
The third chart shows that this is not a regular bear/sideways market because about half of 2015 was spent in the green area which is a normal amount of volatility on a historical basis. The market spent some time in the quiet area (blue) but when it made its 10% decline, it entered the volatile category. 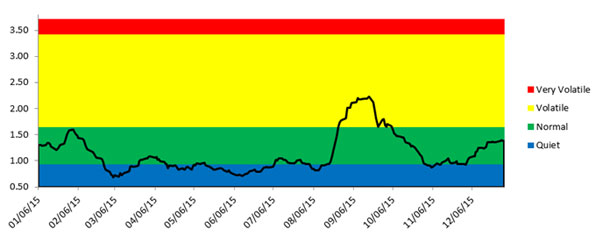
Below is a chart of the recent weekly changes in the three major US Indices. The NASDAQ 100 finished up 8.4% for the year, while the S&P 500 was down 0.73% and the DOW 30 was down 2.38%. Just like the market type, 2015 was a flat to slightly down year. It’s very hard to make money trading a sideways to slightly down market without much volatility. 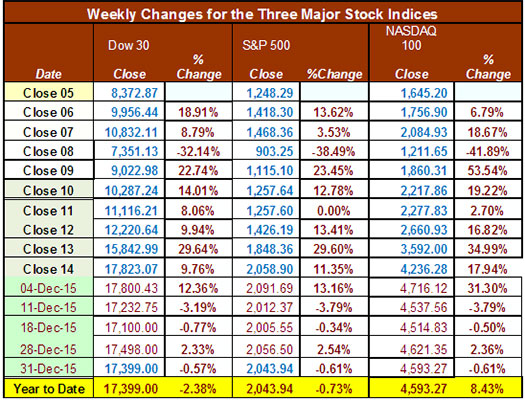
Part III: Our Four Star Inflation — Deflation Model
In the simplest terms, inflation means that stuff gets more expensive, and deflation means that stuff gets cheaper. There’s a correlation between the inflation rate and market levels, so understanding inflation and deflation can help traders understand some important big-picture processes. See the tracking table below for the price levels of the model components.
Date |
CCI> DBC |
XLB |
Gold |
XLF |
Total Score |
Dec ‘05 |
347.89 |
30.28 |
513 |
31.67 |
|
Dec ‘06 |
394.89 |
34.84 |
635.5 |
36.74 |
|
Dec ‘07 |
476.08 |
41.7 |
833.3 |
28.9 |
|
Dec ‘08 |
352.06 |
22.74 |
865 |
12.52 |
|
Dec ‘09 |
484.42 |
32.99 |
1,104.00 |
14.1 |
|
Dec ‘10 |
629.53 |
38.47 |
1,410.25 |
16 |
|
Dec ‘11 |
564.37 |
33.5 |
1,574.59 |
13 |
|
Dec ’12 CCI>DBC |
556.08
27.79 |
37.54 |
1,564.80 |
16.39 |
1 |
Dec ‘13 |
25.66 |
46.22 |
1201.50 |
21.86 |
-1.5 |
Dec ‘14 |
18.45 |
48.59 |
1199.25 |
24.73 |
-3.0 |
Jan ‘15 |
17.40 |
47.69 |
1260.25 |
23.01 |
-3.0 |
Feb ‘15 |
18.17 |
51.49 |
1213.70 |
24.35 |
-1.0 |
Mar ’15 |
17.01 |
48.78 |
1187.00 |
24.11 |
-3.0 |
Apr ’15 |
18.29 |
50.42 |
1180.25 |
24.13 |
-1.5 |
May ‘15 |
17.71 |
50.61 |
1190.50 |
24.60 |
+0.5 |
Jun ’15 |
18.00 |
48.39 |
1176.00 |
24.38 |
-1.0 |
Jul ’15 |
15.73 |
45.94 |
1098.40 |
25.18 |
-2.5 |
Aug ’15 |
15.69 |
43.36 |
1135.00 |
23.42 |
-2.5 |
Sep ‘15 |
15.15 |
39.95 |
1114.00 |
22.66 |
-2.0 |
Oct’ 15 |
15.20 |
45.28 |
1142.35 |
24.08 |
-1.5 |
Nov’ 15 |
14.19 |
45.57 |
1061.90 |
24.56 |
-2.0 |
Dec’ 15 |
13.36 |
43.42 |
1062.25 |
23.83 |
-2.0 |
Here are the prices at the end of September compared with two months back and six months back.
Month |
DBC2 |
DBC6 |
XLB2 |
XLB6 |
Gold2 |
Gold6 |
XLF2 |
XLF6 |
Total Score |
|
Lower |
Lower |
Lower |
Lower |
Lower |
Lower |
Lower |
Lower |
|
Dec 15 |
|
-1 |
|
-1 |
|
-1 |
|
+1 |
-2.0 |
According to our model, every month during 2015 except for May was deflationary. Yet despite that, the Federal Reserve has started to raise interest rates which — suggests a down market for 2016 and more deflation.
Banks are still not lending money — which is a deflationary force. The chart from the St. Louis Fed’s website shows the M-1 money multiplier is about 0.8 which means banks are lending about 80% of the money supplied by the Fed - slightly up from November’s data. It needs to be much higher than that, however, to really stimulate the economy (and bring back inflation). For perspective, the money multiplier was around 3 for much of the 1980s. 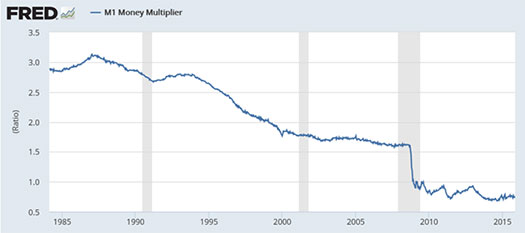
Part IV: Tracking the Dollar
The US Dollar Index has gone down about 2 points since its highs in late November but it is still in a general uptrend and I’d expect that to continue if the Fed continues to raise interest rates. 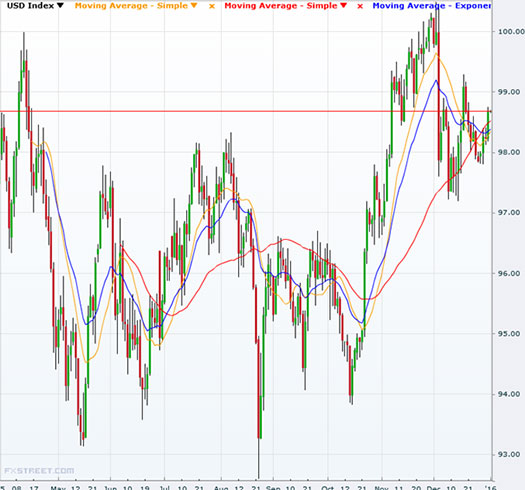
Click here for a larger image.
Conclusion
The market spent almost all of 2015 in the neutral or down categories. Volatility for most of the year was normal or quiet. The major US Index, the S&P 500, closed down just under 1% for the entire year. Although faulty, my memory is that much of last year was pretty much the same. As a result; I decided to make up a table of the market type was for each month of the year to see how many of monthly market types were actually the same.
Month |
Market Type Observed |
Change |
Amount of Change |
Jan 2015 |
Sideways Quiet |
|
|
Feb 2015 |
Bull Quiet |
Yes |
+1 |
Mar 2015 |
Sideways Normal |
Yes |
+2 |
Apr 2015 |
Sideways Quiet |
Yes |
+1 |
May 2015 |
Sideways Quiet |
No |
0 |
Jun 2015 |
Sideways Quiet |
No |
0 |
Jul 2015 |
Sideways Quiet |
No |
0 |
Aug 2015 |
Bear Quiet |
Yes |
+1 |
Sep 2015 |
Bear Volatile |
Yes |
+2 |
Oct 2015 |
Bear Quiet |
Yes |
+2 |
Nov 2015 |
Sideways Quiet |
Yes |
+1 |
Dec 2015 |
Bear Normal |
Yes |
+2 |
- So remember that the observed column above has the market type on the last day of the prior month.
Overall we said the market direction was sideways in seven months, bearish for four months and bullish for one month.
- Volatility was quiet for nine months, normal in two months and volatile in just one month.
- We had four straight months of no change in type when the market was Sideways Quiet.
- We had four months in which there was just one change in the market type (i.e., quiet to normal or bull to sideways).
- And we had four months in which there were two changes in market type (i.e., quiet to volatile; or both volatility and direction changed one unit).
Now I generally state that market type is not a prediction but an observation of what is happening. With changes in market type for eight months in 2015, that’s seems to remain the case. The entire year also had pretty similar market conditions - we had a sideways direction in seven of the twelve months and quiet volatility in nine of the months.
As I have said many times over the last year, notice what the market is doing now. Right now the market is Bear Normal. Can you make money in a Bear Normal market? If yes, then do what you do. If no, then your best bet is probably cash.
Until next month’s update, this is Van Tharp.
About the Author: Trading coach and author Van K. Tharp, Ph.D. is widely recognized for his best-selling books and outstanding Peak Performance Home Study Program—a highly regarded classic that is suitable for all levels of traders and investors. You can learn more about Van Tharp at www.vantharp.com. His new book, Trading Beyond The Matrix, is available now at matrix.vantharp.com.
|
Workshops
Combo Discounts available for all back-to-back workshops!
See our workshop page for details.
Free Book We're Giving You a FREE Book!
TRADING BEYOND THE MATRIX
The Red Pill for Traders and Investors
We pay for the book, you pay for shipping.
ALL YOU HAVE TO DO IS CLICK HERE!
Below is a brief video on how powerful this book is to traders.

Trading Tip
December 2015 System Quality Number® Report
The SQN® Report
by Van K. Tharp, Ph.D.
Click here to resolve formatting problems There are numerous ETFs that now track everything from countries, commodities, currencies and stock market indices to individual market sectors. ETFs provide a wonderfully easy way to discover what’s happening in the world markets. Consequently, I now apply a version of my System Quality Number® (SQN®) score to measure the relative performance of numerous markets in a world model.
The Market SQN score uses the daily percent change for input over a 100-day period. Typically, a Market SQN score over 1.47 is strongly bullish and a score below -0.7 is very weak. The following color codes help communicate the strengths and weaknesses of the ETFs in this report:
-
Dark Green: ETFs with very strong SQN® 100 scores > 1.47
- Light Green: ETFs with strong SQN 100 scores (0.70 to 1.47).
- Yellow: ETFs with slightly positive Market SQN scores (0 to 0.70). These are Neutral/Sideways
- Brown: ETFs with slightly negative Market SQN scores (0 to -0.7).
- Red: Very weak ETFs that earn negative Market SQN scores (< -0.7).
This is basically the same ratings that we use for the Market SQN® Score. The world market model spreadsheet report below contains most currently available ETFs excluding inverse and leveraged funds. In short, it covers the geographic world, the major asset classes, the equity market segments, the industrial sectors and the major currencies.
World Market Summary — Equities & Currencies
Each month, we look at the equities markets across the globe by segment, region and sector. Once again the world is mostly brown and yellow. But part of this might be due to the rise in the US Dollar which would cause the rest of the world to seem to be going down (i.e., as their currencies depreciate).
This month the equity markets across the Americas are worse than last month. All of the US market segments are brown except for DIA and QQQ which are both slightly positive. All of the rest of the Americas — Mexico, Canada, Latin America, Brazil, and Chile are all red — meaning down a lot.
In Asia everything is brown except for two reds - India and Singapore (way down) and two yellows — China and South Korea. It’s not a promising picture for buy and hold. Remember that this is in the face of a stronger dollar.
In Europe, everything is red except for three browns (moderately down) in Austria, Russia, and Sweden and one yellow Belgium. This is a much weaker picture than we saw last month.
With a strong dollar, US sectors should be doing well but there are no green sectors at all. The view shows mostly yellow or brown and there are five red areas — Metals and Mining; Oil and Gas Exploration; Gaming; Retail (despite the Christmas season just ending); and the Dow Transports. The strongest US sector is Volatility — which means that although the market type shows just a normal level of volatility on a historical basis, volatility has gone up over the last 100 days.
In currencies this month, three are yellow while four are now red. The Japanese Yen is the highest at 0.65; followed by the Swedish krona at 0.34; and the US dollar at 0.16. The weakest currencies are the Canadian Dollar (-1.32; the British Pound (-1.1) and the Chinese Yuan (-1.14) despite the fact that the Yuan will be given reserve currency status in 2016 by the IMF. The last event could have long term bearish implications for the US Dollar.
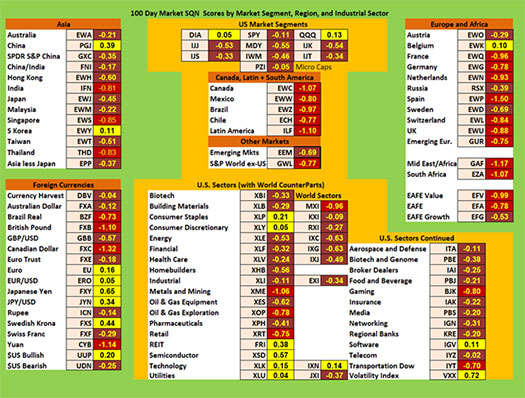
Click here for a larger image.
Commodities, Real Estate, Debt, Top and Bottom Lists
The next chart shows real estate, debt instruments, commodities and the top and bottom ETFs for the past 100 days.
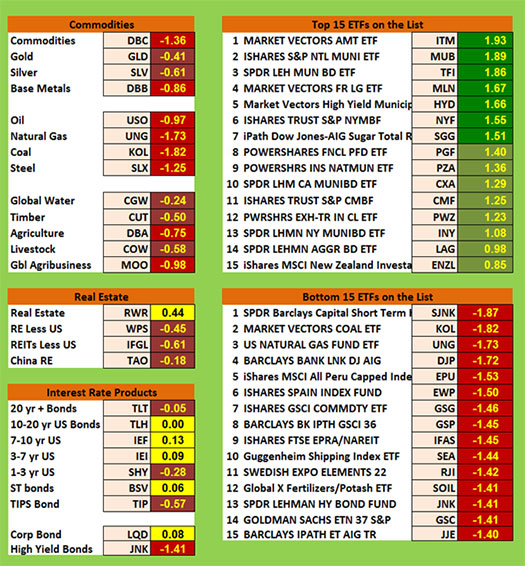
Commodities are still red and brown with no exceptions. Coal, natural gas, steel, and commodities in general are all below -1.0. The least weak commodity is global water at -0.24. U.S. real estate is still yellow, while Chinese real estate is brown. So many Chinese invested in real estate and thought it could only go up.
Debt was mostly light green two months ago, but now it is mostly yellow. With interest rates now starting to go up, the longest term bonds are now brown. Junk bonds are now red indicating a lack of faith, however, the strongest ETFs in the database are mostly muni bonds.
The top ranking ETFs in the database now show seven ETFs that are dark green — mostly municipal bonds and they dominate the top spots including the light green. None of the ETFs this month are over +2.0 but 13 of the 15 are over +1.0
The bottom ranking list no longer includes any ETFs with SQN scores below -2.0 as compared with four last months. The bottom 15 are all at or below negative 1.4.
Summary
Now let’s look at the summary table which measures the percentage of ETFs in each of the strength categories.
Date |
Very
Bullish |
Bullish |
Neutral |
Bearish |
Very
Bearish |
2013 |
> 1.5 |
0.75 - 1.5 |
0 - 0.75 |
0 - -0.7 |
< - 0.7 |
Jan 31st, |
27.1% |
39.6% |
20.7% |
6.4% |
4.7% |
Feb 28th |
10.3% |
45.2% |
24.4% |
11.9% |
7.5% |
Mar 31st |
39.2% |
25.5% |
19.1% |
9.0% |
6.4% |
Apr 30th |
49.1% |
21.1% |
14.8% |
8.0% |
6.2% |
May 31st |
29,2% |
23.6% |
19.9% |
12.3% |
14.2% |
Jun 30th |
2.1% |
31.0% |
23.2% |
22.0% |
20.9% |
Jul 31st |
8.2% |
33.5% |
29.0% |
13.3% |
15.2% |
Aug 30th |
1% |
15% |
46.4% |
19.3% |
17.5% |
Sep 30th |
1% |
13.8% |
42.3% |
23.0% |
19.1% |
Nov 1st |
13.3% |
48.3% |
21.8% |
12.5% |
3.3% |
Dec 1st |
14.6% |
42.7% |
24.2% |
13.3% |
4.3% |
Dec 31st |
19.3.% |
45.5% |
22.0% |
11.3% |
2.9% |
2014 |
|
|
|
|
|
Jan 31st |
8.0% |
49.3% |
20.7% |
12.7% |
7.6% |
Feb 28th |
18.9% |
48.4% |
18.1% |
6.2% |
6.8% |
Mar 31st |
4.9% |
40.2% |
38.8% |
13.3% |
3.1% |
Apr 30th |
11.1% |
33.9% |
40.2% |
11.3% |
1.8% |
May 31st |
12.5% |
46.5% |
27.7% |
7.6% |
6.0% |
Jun 30th |
53.4% |
33.7% |
14.2% |
2.5% |
0.8% |
Aug 29th |
20.3% |
45.2% |
22.8% |
10.5% |
5.3% |
Sep 30th |
6.6% |
26.9% |
30.2% |
24.0% |
18.5% |
Oct 31st |
2.9% |
17.9% |
38.8% |
17.7% |
26.3% |
Nov 30th |
3.1% |
25.7% |
25.1% |
22.8% |
27.9% |
Dec 31st |
3.7% |
29.2% |
24.8% |
15.6% |
31.2% |
2015 |
|
|
|
|
|
Jan 31st |
7.2% |
9.4% |
35.1% |
25.5% |
27.3% |
Feb 28th |
6.4% |
41.1% |
34.5% |
11.5% |
10.9% |
Mar 31st |
2.3% |
24.0% |
46.4% |
19.7% |
12.9% |
April 30th |
1.6% |
13.6% |
69.4% |
15.0% |
5.7% |
June 30th |
1.4% |
15.8% |
48.5% |
29.0% |
10.7% |
July 30th |
0% |
7.2% |
49.7% |
39.0% |
9.4% |
Aug 31st |
0% |
0.4% |
7.6% |
49.7% |
42.3% |
Sept 30th |
0% |
2.7% |
7.6% |
42.7% |
39.8% |
Oct 31st |
1% |
6.0% |
19.5% |
51.3% |
22.2% |
Nov 30th |
0.8% |
3.1% |
38.0% |
42.1% |
16.0% |
Dec 31st |
1.4% |
1.6% |
16.8% |
56.1% |
24.2% |
Three months ago 92% of the ETFs we track were either in bear territory or strong bear territory. That number decreased to 58% last month and this month it moved back up to 78.3%. We are in a mild bear market which could get worse. Watch volatility.
Be careful to base your actions upon what is happening, not what you think might happen.
Until the January SQN Report this is Van Tharp.
The markets always offer opportunities, but to capture those opportunities, you MUST know what you are doing. If you want to trade these markets, you need to approach them as a trader, not a long-term investor. We’d like to help you learn how to trade professionally because trying to navigate the markets without an education is hazardous to your wealth. All the beliefs given in this update are my own. Though I find them useful, you may not. You can only trade your own beliefs about the markets.
Swing Trading Systems E-Learning Course
20% Off Ends TODAY!
 The new Swing Trading Systems home study course is now available! Learn with Dr. Ken Long as he teaches his Swing Trading Systems Workshop via streaming video! The new Swing Trading Systems home study course is now available! Learn with Dr. Ken Long as he teaches his Swing Trading Systems Workshop via streaming video!
This new e-learning course includes Ken Long's Swing Trading Workshop, 5 swing trading systems and a bonus workshop featuring Van Tharp on Tharp Think principles. The course also includes extensive downloadable files to support your learning.
You can complete this course at your own pace, from the comfort of your own home or office, and access the materials as many times as you wish during your 1 year subscription period.
Take a look at this video from Ken to learn more about this course.

We have extensive information about the Swing Trading System e-learning course, including how to purchase...click the link below!
Learn More About The Swing E-Learning Course...
In the six minute video below, Ken analyzes several trades from the relatively quiet session on Monday, October 12. He opens with a swing trade that started last week on XIV talking about the entry, initial stop, target, and progress of the trade so far. That swing trade offers the opportunity trade XIV intraday with some confidence in the long bias. Ken provides two tradeable intraday scenarios for the XIV move during the Monday session and the position sizing ramifications for each. Ken then discusses a second trade where one of the traders in the chat room went short USO and earned a couple of R for the effort. 
Matrix Contest
 Enter the Matrix Contest Enter the Matrix Contest
for a chance to win a free workshop!
We want to hear about the one most profound insight that you got from reading Van's new book, Trading Beyond the Matrix, and how it has impacted your life. If you would like to enter, send an email to [email protected].
If you haven't purchased Trading Beyond the Matrix yet, click here.
For more information about the contest, click here.
Ask Van...
Everything we do here at the Van Tharp Institute is focused on helping you improve as a trader and investor. Consequently, we love to get your feedback, both positive and negative!
Send comments or ask Van a question by clicking here.
Also, Click here to take our quick, 6-question survey.
Back to Top
Contact Us
Email us at [email protected]
The Van Tharp Institute does not support spamming in any way, shape or form. This is a subscription based newsletter.
To change your e-mail Address, e-mail us at [email protected].
To stop your subscription, click on the "unsubscribe" link at the bottom left—hand corner of this email.
How are we doing? Give us your feedback! Click here to take our quick survey.
Call us at: 800-385-4486 * 919-466-0043 * Fax 919-466-0408
SQN® and the System Quality Number® are registered trademarks of the Van Tharp Institute and the International Institute of Trading Mastery, Inc.
Be sure to check us out on Facebook and Twitter!
 
Back to Top |
|
January 6, 2016 #766

Our Mission
Van's Top-Twelve Favorite Trading Books
Van's Favorite Non-Trading Books
Viewing on-line eliminates spacing, and formatting problems that you may experience in your email program.
Ongoing Contest: Learn how you could win a $50 coupon and a grand prize of a free workshop!
www.youtube.com/vantharp
How are we doing?
Give us your feedback!
Click here to take our quick survey.
From our reader survey...
"I think the newsletter is
extremely generous and it is a resource I utilize constantly.
I have saved every single one
since I first subscribed."
Trouble viewing this issue?
View Online. »
Van Tharp You Tube Channel
Tharp Concepts Explained...
-
Trading Psychology
-
System Development
-
Risk and R—Multiples
-
Position Sizing
-
Expectancy
-
Business Planning
Learn the concepts...
Trouble viewing this issue?
View Online. »


Check out our home study materials, e-learning courses, and best-selling books.
Click here for products and pricing
What Kind of Trader
Are You? Click below
to take the test.
Tharp Trader Test
Back to Top

Introduction to Position Sizing™ Strategies
E-Learning Course
Perfect for auditory/visual learners who learn more effectively from an instructional format that is full of interactive features!
Only $149
Learn More
Buy Now
SQN® and the System Quality Number® are registered trademarks
of the Van Tharp Institute
|