Tharp's Thoughts Weekly Newsletter
-
Article: Market Condition: Bear Volatile by Van K. Tharp, Ph.D.
-
Workshops: $500 Discount When Attending Back-to-Back in Nov
-
Tip: SQN ® (System Quality Number) Report by Van K. Tharp, Ph.D.
-
Trading Workshops in November Great for Bear Markets
Day Trading and Live Day Trading with Instructor Ken Long
Learn two complimentary trading systems (and trade them on a simulator in class!) that are great performers in volatile market conditions like we are experiencing right now!
In this three day workshop, Dr. Ken Long lectures on the first day about his general approach to intraday trading and about two specific day trading systems — the Frog and RLCO. You will learn the "why" behind each system and the rules for each. Over the next two days, you put your knowledge to work learning these trading systems the best way possible — actually trading them. Ken will review a series of case studies with you and then you make trades in a simulator — using historical price data. You’ll get plenty of practice so that before you get back home, you have already made numerous trades.
After three action-packed days of instruction and hands-on trading, you can opt to stay an additional two days and trade these systems live! See how these systems trade in real-time in the live markets with a successful, experienced coach in the room guiding you the entire way.
Trading in a Bear Market and Down Markets with Instructor Mark McDowell
Learn how to identify, prepare for, trade during, and profit from the next big bear market—or from any smaller market that’s heading down.
This workshop helps you learn how to think about trading broad bear markets and trading an asset class, sector or even one symbol that is moving down in bear mode. For a major bear market, think equities in 2008-2009. For a down move, think oil in 2014-2015. Imagine having had some ways you could have effectively traded those periods. Major bear markets don’t come that often but “lesser” down moves can be found almost anytime – including during bull markets. Start using the information from this workshop when you return back home — and also be prepared for the next big bear market.
| • |
|
Study in depth the concept of a bear market. |
| • |
|
Learn what a bear market truly is and learn several ways to define and measure the bear market type. |
| • |
|
Know when a bear market type might be starting and how to know when it might end. |
| • |
|
Learn 5 trading strategies suited for bear market conditions. |
| • |
|
Learn how options can be especially useful for bear market types. |
To register or to see the full workshop schedule, click here.
Feature Article
September 2015 Market Update:
Bear Volatile Market Type
by Van K. Tharp, Ph.D.
Click here to resolve formatting problems
I always say that people do not trade the markets; they trade their beliefs about the markets. In that same way, I'd like to point out that these updates reflect my beliefs. If my beliefs and your beliefs are not the same, you may not find them useful. I find the market update information useful for my trading, so I do the work each month and am happy to share that information with my readers.
However, if your beliefs are not similar to mine, then this information may not be useful to you. Thus, if you are inclined to do some sort of intellectual exercise to prove one of my beliefs wrong, simply remember that everyone can usually find lots of evidence to support their beliefs and refute others. Just simply know that I admit that these are my beliefs and that your beliefs might be different.
These monthly updates are in the first issue of Tharp's Thoughts each month. This allows us to get the closing month's data. These updates cover 1) the market type (first mentioned in the April 30, 2008 edition of Tharp's Thoughts), 2) the five week status on each of the major US stock market indices, 3) our four star inflation-deflation model plus John Williams' statistics, and 4) tracking the dollar. I will now report on the strongest and weakest areas of the overall market as a separate SQN™ Report. And that may come out twice a month if there are significant market charges.
Part I: The Big Picture
Over the last 100 days, the market went down 8.3% and there was only one new all-time high close – which was nearly 100 days ago. The S&P 500 made no new high closes in June, July, August, or September. This is no longer a very deceptive market as it might have seemed over the summer. It is quite clear now.
Debt Clock
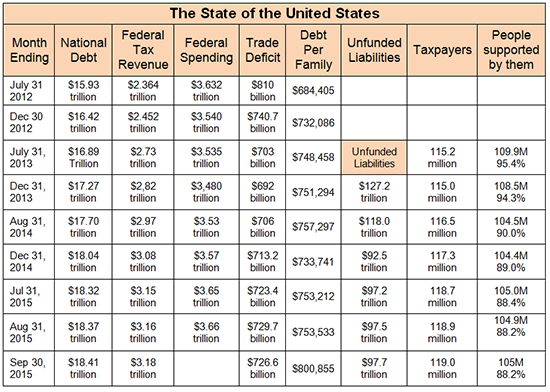
So in nine months, usdebtclock.org says our official debt has gone up by $370 billion. Furthermore, the tendency for the government to manipulate our unfunded debt amount seems to have tapered off as it’s now the highest it’s been since November 2014.
Incidentally, the website usdebtclock.org says there are 119 million taxpayers. It also says there are 160.2 million people receiving government support, however, I’m not sure how they determine that as some of the sections there are certainly duplicated. As a result, I add together US Retirees (48.9 million) food stamp recipients (45.3 million) and disabled people drawing social security (10.8 million). I don’t think there is any overlap here. Those groups total 105 million and that’s why I say that they constitute a group that’s 88.2% of the number of taxpayers. I could also include all government employees (23.7 million) as among those supported by taxpayers - but they do pay taxes. Remember about 10% of the taxpayers (11.9 million) pay most of the tax revenue.
Part II: The Current Stock Market Type Is Bear Volatile
My market type classification is not predictive but rather descriptive — rather than telling us what’s going to happen, it simply tells us what’s going on now.
I look at the Market SQN score for the 100 day period for the S&P 500 as my major indicator of market type. But we also look at the Market SQN® score for 25, 50 and 200 days. Right now the 200-day and 100-day market types are both Bear Volatile. The 50-day type is Strong Bear Volatile and the 25-day is Neutral Volatile. I looked at these market types after the close on Monday, October 5th — so after the market had gone up for five straight days. As of the close yesterday (Oct. 6), volatility (20 day ATR %) moved back down to normal.
The graphs below include a chart of weekly bars for the S&P 500 over the last year, the Market SQN® score for 100 days, and the ATR percent volatility.
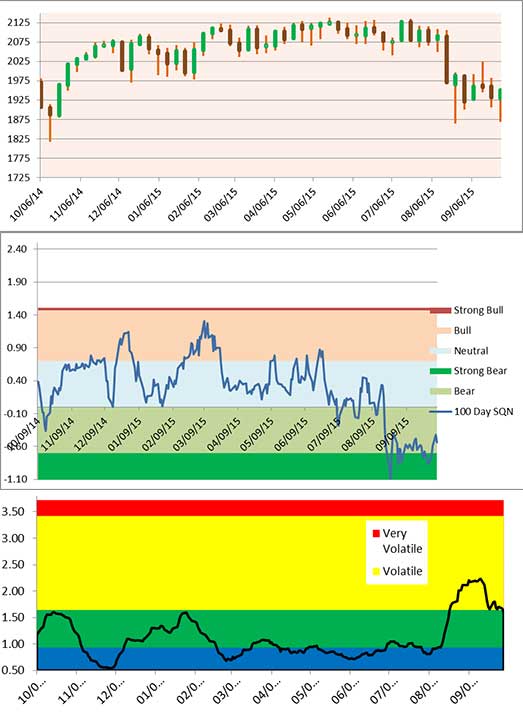
For a larger image CLICK HERE.
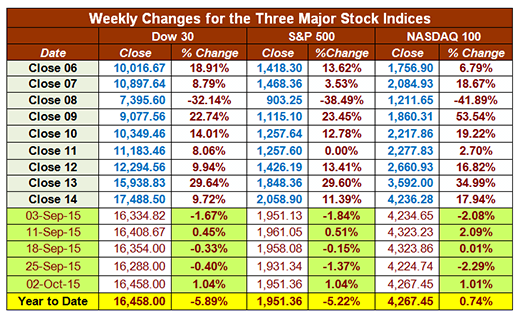
Below is a chart of the recent weekly changes in the three major US Indices. The Dow and S&P 500 are down for the year after a sharp drop in August and a mostly sideways September. The NASDAQ 100 is still up 0.74% since the beginning of the year.
Part III: Our Four Star Inflation-Deflation Model
In the simplest terms, inflation means that stuff gets more expensive, and deflation means that stuff gets cheaper. There’s a correlation between the inflation rate and market levels, so understanding inflation and deflation can help traders understand some important big-picture processes.
See the tracking table below.
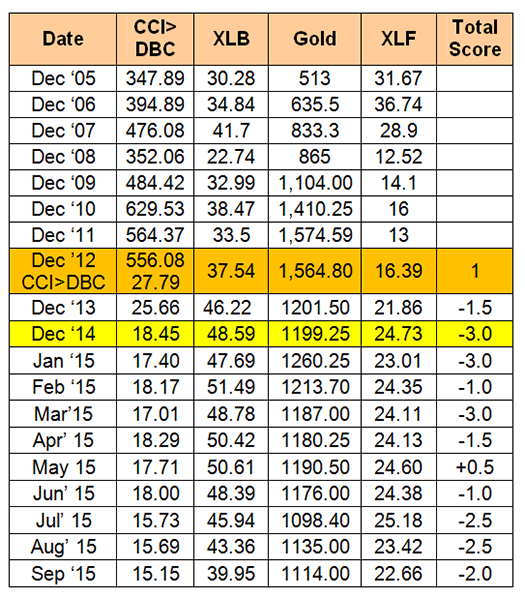
Here are the model components and how the prices looked at the end of September compared with two months back and six months back.
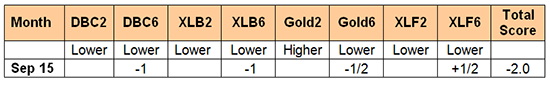
Notice that 12 out of the last 13 months have shown deflation. It’s interesting that in such a climate, Federal Reserve officials are still talking about raising interest rates in 2015. I’m not sure that’s going to happen.
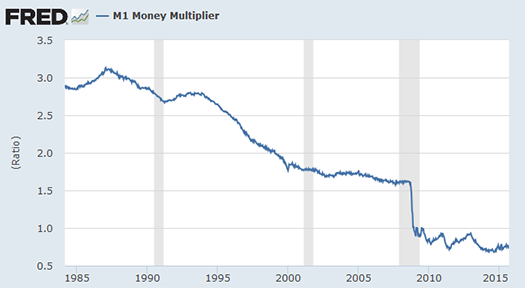
Also notice that banks are still not lending money — a deflationary force. This chart from the St. Louis Fed’s website shows the M-1 money multiplier is about 0.74 which means banks are lending about 75% of the money supplied by the Fed. The money multiplier figure used to be more than twice that amount in the years before the global financial crisis. It needs to be much higher than that to really stimulate the economy (and bring back inflation).
Part IV: Tracking the Dollar
The US Dollar Index is very choppy right now and is down about 2% from its August highs. The strong uptrend in USD that started mid-year 2014 definitely seems to have ended back in the spring. Right now, the dollar seems to be in a wide trading range from 98 to 93.
We have both a down market and a relatively weak dollar. What’s next? I have no idea as this letter is not about prediction, just what is happening.
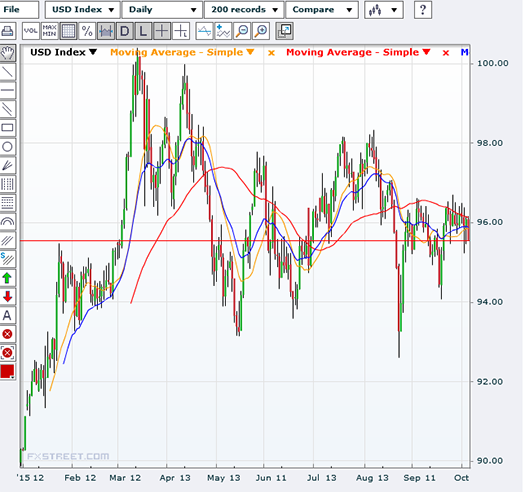
For a larger image CLICK HERE.
Conclusion
I find our current workshop situation ironic. We have a bear market workshop in November that shows traders how to deal with the huge market downturn that is coming — perhaps not right away, but it’s eventually inevitable. I would have expected a workshop that teaches all about bear markets and trading strategies that work well in bear markets to be packed but instead there is plenty of room. That same week, Ken Long will be teaching two great day trading systems. His systems are performing very well in these conditions but there is plenty of room in that workshop as well. This might just be an indicator that says we are seeing only the beginning of this downturn, not the end.
Also, I found an interesting Yahoo Finance headline today announcing that Citibank was calling on investors to buy stocks. I’ve seen a lot of commentary recently that says when the market drops suddenly like it did in August, the decline fails to follow through and that makes now a good time to buy stock. All of our indicators, however, say that we are still in a bear market. Don’t try to predict what the market will do! Watch what it is doing.
Until next month’s update, this is Van Tharp.
About the Author: Trading coach and author Van K. Tharp, Ph.D. is widely recognized for his best-selling books and outstanding Peak Performance Home Study Program—a highly regarded classic that is suitable for all levels of traders and investors. You can learn more about Van Tharp at www.vantharp.com. His new book, Trading Beyond The Matrix, is available now at matrix.vantharp.com.
Workshops
Combo Discounts available for all back-to-back workshops!
See our workshop page for details.
Trading Tip
September 2015 SQN® Report
by Van K. Tharp, Ph.D.
Click here to resolve formatting problems
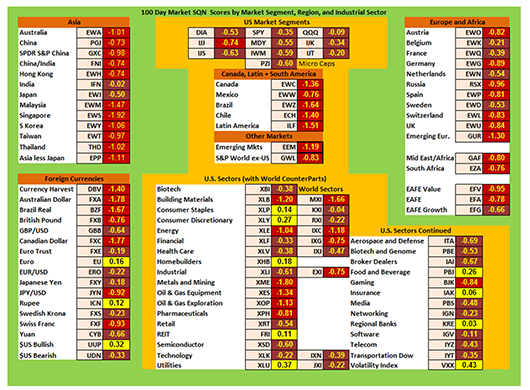
There are numerous ETFs that now track everything from countries, commodities, currencies and stock market indices to individual market sectors. ETFs provide a wonderfully easy way to discover what’s happening in the world markets. Consequently, I now apply a version of my System Quality Number® (SQN®) score to measure the relative performance of numerous markets in a world model.
The Market SQN score uses the daily percent change for input over a 100-day period. Typically, a Market SQN score over 1.47 is strongly bullish and a score below -0.7 is very weak. The following color codes help communicate the strengths and weaknesses of the ETFs in this report:
| |
• |
Dark Green: ETFs with very strong SQN® scores > 1.47 |
| |
• |
Light Green: ETFs with strong SQN scores (0.70 to 1.47). |
| |
• |
Yellow: ETFs with slightly positive Market SQN scores (0 to 0.70). These are Neutral/Sideways |
| |
• |
Brown: ETFs with slightly negative Market SQN scores (0 to -0.7). |
| |
• |
Red: Very weak ETFs that earn negative Market SQN scores (< -0.7).
|
This is basically the same ratings that we use for the Market SQN® Score. The world market model spreadsheet report below contains most currently available ETFs; including inverse funds, but excluding leveraged funds. In short, it covers the geographic world, the major asset classes, the equity market segments, the industrial sectors and the major currencies.
World Market Summary – Equities & Currencies
Each month, we look at the equities markets across the globe by segment, region and sector. September (as of the October 5 close) looks much the same as last month; the entire world is a sea of red and brown with a few yellows sprinkled in here and there. As I said last month, however, this is rather exciting for good traders because they can make a lot of money with a clear market direction. Read some of the first chapters of Trading Beyond the Matrix for a few insights on this topic (and we are currently offering the book for free. Order here).
This report will actually be much shorter than normal normal because there is little to say about each sector except that everything is bearish.
This month, equity markets in the Americas are totally red and brown. In the US only one segment is red (IJJ) and the rest are brown - which is an improvement from last month.
In Asia everything is red except for India and Japan which are both brown. This is truly a global downturn.
Europe tells the same story. Everything is red and brown — but mostly red. Belgium, France, the Netherlands and Sweden are brown. The rest are red.
The US sector view shows all red and brown with a few yellow areas — meaning weak and not (at least not yet) impacted as hard by the downturn. The yellow sectors are different than last month and they include Consumer Staples, Consumer Discretionary, Homebuilders, REITs, Utilities, Food and Beverage, Insurance, Regional banks, and Volatility. The last two are the only ones that were yellow last month.
Three currencies are yellow while the rest are red and brown — so even currencies are not exempt. The yellow ones include the Euro, the Rupee, and the US Dollar. The British pound vs the USD was light green last month but is now brown. And the British Pound by itself has moved from yellow to red.
For a larger image CLICK HERE.
Commodities, Real Estate, Debt, Top and Bottom Lists
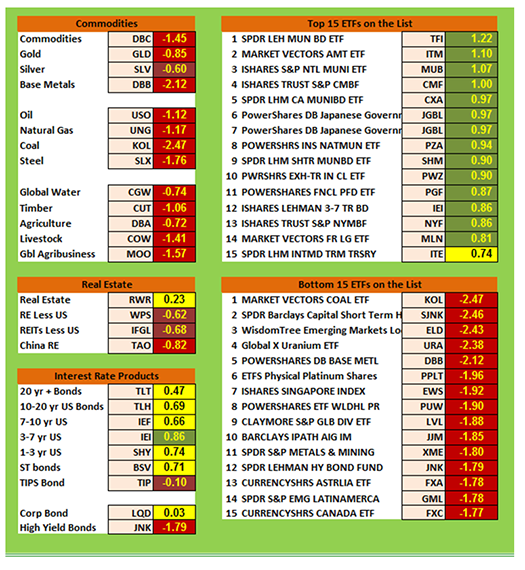
The next chart shows real estate, debt instruments, commodities and the top and bottom ETFs for the past 100 days.
Commodities have gone from bad to worse this month. Everything is red except for silver which is brown. Base metals and coal both have Market SQN scores that are below -2.0. Real estate overall moved to yellow but the rest of the real estate ETFs in the model are brown or red.
Debt last month didn’t look like a place to escape but this month it is yellow and 3-7 year treasuries are actually light green. It took a while for big money to flee there. Junk bonds are still red, but corporate bonds are yellow. The market is no longer expecting higher interest rates - or – despite that prospect, big money is still willing to flee to debt instruments.
The top ranking ETFs in the database are the second weakest I’ve seen since I’ve been doing these report (I didn’t do them during 2007-9 bear market). Why second weakest? They have improved slightly from last month — which had the weakest scores we have recorded. The top ETFs are all light green except for one yellow and four of them now rank above 1.0. But that is really weak overall compared with past charts.
The bottom list includes five sectors with SQN scores below -2.0 as compared with two last month. Everything (again) is below negative 1.5. Two months ago I could say that all the weakest ETFs were below negative 1.0.
Summary
Now let’s look at the summary table which measures the percentage of ETFs in each of the strength categories.
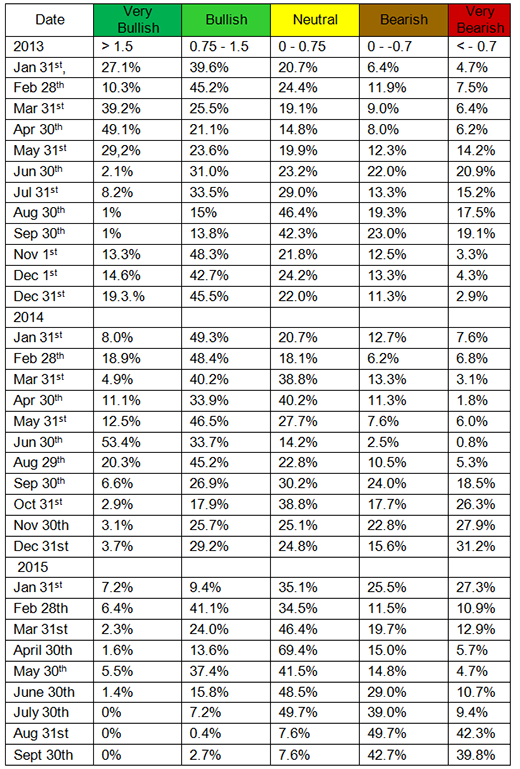
Last month 92% of the ETFs we track were either in bear territory or strong bear territory. Last month was the first month since we have been keeping records where no ETFs were in strong bull territory and that continues this month. Only 85.2% of the ETFs this month, however, are in bear or strong bear territory - but that’s not enough to get optimistic. This is a bear market. If you want to profit during bear markets, learn how at the workshops we have coming next month. We won't offer those two workshops again until April or May 2016 at the earliest.
Be careful to base your actions upon what is happening, not what you think might happen.
And right now that action is very obvious — down, down, down.
Until the next SQN Report this is Van Tharp.
The markets always offer opportunities, but to capture those opportunities, you MUST know what you are doing. If you want to trade these markets, you need to approach them as a trader, not a long-term investor. We’d like to help you learn how to trade professionally because trying to navigate the markets without an education is hazardous to your wealth.
All the beliefs given in this update are my own. Though I find them useful, you may not. You can only trade your own beliefs about the markets.
NEW! Swing Trading Systems E-Learning Course
 We are excited to announce that our new Swing Trading Systems home study course is now available! Learn with Dr. Ken Long as he teaches his Swing Trading Systems Workshop via streaming video! We are excited to announce that our new Swing Trading Systems home study course is now available! Learn with Dr. Ken Long as he teaches his Swing Trading Systems Workshop via streaming video!
This new e-learning course includes Ken Long's Swing Trading Workshop, 5 swing trading systems and a bonus workshop featuring Van Tharp on Tharp Think principles. The course also includes extensive downloadable files to support your learning.
You can complete this course at your own pace, from the comfort of your own home or office, and access the materials as many times as you wish during your 1 year subscription period.
Take a look at this video from Ken to learn more about this course.

We have extensive information about the Swing Trading System e-learning course, including how to purchase...click the link below!
Learn More About This Swing Workshop....
In the following 5 minute video, Ken highlights his swing trade of the week. Recognizing the broader trend in price, watching the regression line crossover, and getting a 5 days down failure signal generated a short entry in EWZ on July 22. Ken goes on to detail how the trade has been working out through this most recent Monday—August 24th.

Matrix Contest
 Enter the Matrix Contest Enter the Matrix Contest
for a chance to win a free workshop!
We want to hear about the one most profound insight that you got from reading Van's new book, Trading Beyond the Matrix, and how it has impacted your life. If you would like to enter, send an email to [email protected].
If you haven't purchased Trading Beyond the Matrix yet, click here.
For more information about the contest, click here.
Ask Van...
Everything we do here at the Van Tharp Institute is focused on helping you improve as a trader and investor. Consequently, we love to get your feedback, both positive and negative!
Send comments or ask Van a question by clicking here.
Also, Click here to take our quick, 6-question survey.
Back to Top
Contact Us
Email us at [email protected]
The Van Tharp Institute does not support spamming in any way, shape or form. This is a subscription based newsletter.
To change your e-mail Address, e-mail us at [email protected].
To stop your subscription, click on the "unsubscribe" link at the bottom left—hand corner of this email.
How are we doing? Give us your feedback! Click here to take our quick survey.
Call us at: 800-385-4486 * 919-466-0043 * Fax 919-466-0408
SQN® and the System Quality Number® are registered trademarks of the Van Tharp Institute and the International Institute of Trading Mastery, Inc.
Be sure to check us out on Facebook and Twitter!
 
Back to Top |