Tharp's Thoughts Weekly Newsletter
-
Article: April 2015 Market Update — Neutral Quiet by Van K. Tharp, Ph.D.
-
Workshops: Oneness Awakening Workshop This June
-
Tip: April 2015 SQN ® Report by Van K. Tharp, Ph.D.
-
Q & A: The Position Sizing Game, Some Questions Answered
Join Van Tharp For A Special Oneness Awakening Event
June 13-14, 2015
Participating in the Oneness Awakening Course is an extraordinary opportunity to benefit from some of the important journeys Dr. Tharp has taken to transform his life.
The course has become a fundamental tool in Dr. Tharp's mission to help his clients succeed. Don't miss a chance to learn more about how you can become more aware, positive, calm, centered, and successful.
• Learn about living in the Awakened State of Oneness with joy, freedom from the mind, and release from a sense of separation.
• Learn ancient meditation practices to help open, balance and clear the chakras (energy centers) and activate energy leading to higher states of consciousness.
• Learn the formula for success and happiness in inner and outer life and how to create what you want in your life experience.
• This two-day weekend is a Super Trader qualifying event. If you are interested in the Super Trader Program, you don't want to miss this.
Only $795
Learn More
Feature Article
 April 2015 Market Update:
Neutral Quiet
by Van K. Tharp, Ph.D.
View on-line to resolve formatting problems
I always say that people do not trade the markets; they trade their beliefs about the markets. In that same way, I'd like to point out that these updates reflect my beliefs. If my beliefs and your beliefs are not the same, you may not find them useful. I find the market update information useful for my trading, so I do the work each month and am happy to share that information with my readers.
However, if your beliefs are not similar to mine, then this information may not be useful to you. Thus, if you are inclined to do some sort of intellectual exercise to prove one of my beliefs wrong, simply remember that everyone can usually find lots of evidence to support their beliefs and refute others. Just simply know that I admit that these are my beliefs and that your beliefs might be different.
These monthly updates are in the first issue of Tharp's Thoughts each month. This allows us to get the closing month's data. These updates cover 1) the market type (first mentioned in the April 30, 2008 edition of Tharp's Thoughts), 2) the five week status on each of the major US stock market indices, 3) our four star inflation-deflation model plus John Williams' statistics, and 4) tracking the dollar. I will now report on the strongest and weakest areas of the overall market as a separate SQN™ Report. And that may come out twice a month if there are significant market charges. (Not sure what SQN means? Click here.)
Part I: The Big Picture
US equities have spent the last 100 days going up 1.59%. This is quite astonishing when you contrast it with the fact that the S&P 500 made 9 all-time high closes during those 100 days. Last month, however, the S&P was up a little over 2% with 23 all-time highs during the previous 100 day period.
Debt Clock
The State of the United States |
Month Ending |
National Debt |
Federal Tax Revenue |
Federal Spending |
Trade Deficit |
Debt Per Family |
Unfunded Liabilities |
Taxpayers |
People supported by them |
July 31 2012 |
$15.93 trillion |
$2.364 trillion |
$3.632 trillion |
$810 billion |
$684,405 |
|
|
|
Dec 30 2012 |
$16.42 trillion |
$2.452 trillion |
$3.540 trillion |
$740.7 billion |
$732,086 |
|
|
|
July 31, 2013 |
$16.89
Trillion |
$2.73
trillion |
$3.535 trillion |
$703 billion |
$748,458 |
Unfunded Liabilities |
115.2 million |
109.9
95.4% |
Dec 31, 2013 |
$17.27 trillion |
$2,82 trillion |
$3,480 trillion |
$692 billion |
$751,294 |
$127.2 trillion |
115.0 million |
108.5M
94.3% |
Aug 31, 2014 |
$17.70 trillion |
$2.97 trillion |
$3.53 trillion |
$706 billion |
$757,297 |
$118.0
trillion |
116.5 million |
104.5
90.0% |
Sep 30, 2014 |
$17.77 trillion |
$2.98 trillion |
$3.53 trillion |
$707 billion |
$730,321 |
$116.3
trillion |
116.7 million |
104.9
90.0% |
Oct 31, 2014 |
$17.9 trillion |
$3.05 trillion |
$3.53 trillion |
$703.5 billion |
$729,784 |
$115.4 trillion |
116.9 million |
105.1
89.9% |
Nov 29, 2014 |
$18.0 trillion |
$3.07 trillion |
$3.55 trillion |
$710.8 billion |
$729,477 |
$115.7 trillion |
117.1 million |
105.1
89.7% |
Dec 31, 2014 |
$18.04 trillion |
$3.08 trillion |
$3.57 trillion |
$713.2 billion |
$733,741 |
$92.5 trillion |
117.3 million |
104.4
89.0% |
Jan 31, 2015 |
$18.10 trillion |
$3.11 trillion |
$3.59 trillion |
$318.7 billion |
$732,620 |
$94.1 trillion |
117.5 million |
105.7
90.0% |
Feb 28, 2015 |
$18.14 trillion |
$3.13 trillion |
$3.60 trillion |
$725.0 billion |
$732,054 |
$95.3 trillion |
117.7 million |
|
Mar 31, 2015 |
$18.17 trillion |
$3.15 trillion |
$3.63 trillion |
$723.3 billion |
$757,614 |
$95.7 trillion |
117.8 million |
105.4
89.5% |
April 30, 2015 |
$18.21 trillion |
$3.11 trillion |
$3.61 trillion |
$720.3 billion |
$759,875 |
$96.0 trillion |
118.1 million |
105.3
89.1% |
So in three months our official debt has gone up by $110 billion. Furthermore, the tendency for the government to manipulate our unfunded debt amount seems to have tapered off and it now seems back to going up slightly each month.
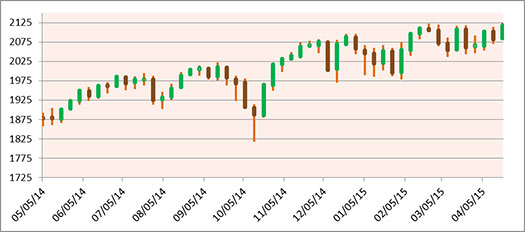
Part II: The Current Stock Market Type Is Neutral Quiet.
My market type classification is not predictive but rather descriptive — rather than telling us what’s going to happen, it simply tells us what’s going on now.
I look at the Market SQN score for the 100 day period for the S&P 500 as my major indicator of market type. But we also look at the Market SQN® score for 25, 50 and 200 days. Right now the 200-day, the 100 day, and the 50 day Market SQN scores are all neutral while the 25 day is bull. Volatility moved down to quiet in April so don’t expect a roaring bear market anytime soon unless volatility goes up dramatically.
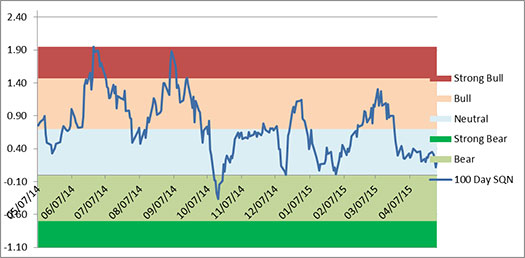
The graphs below include a chart of weekly bars for the S&P 500 over the last year, the Market SQN® score for 100 days, and the percent volatility.
The next chart shows the directional component of my market type classification over the last year.
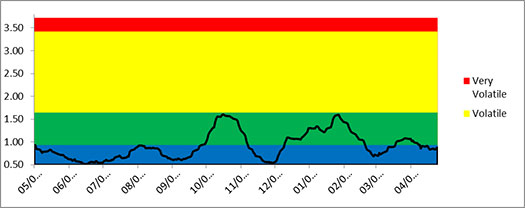
And the final chart shows the 20 day ATR% which we use as a measure of volatility
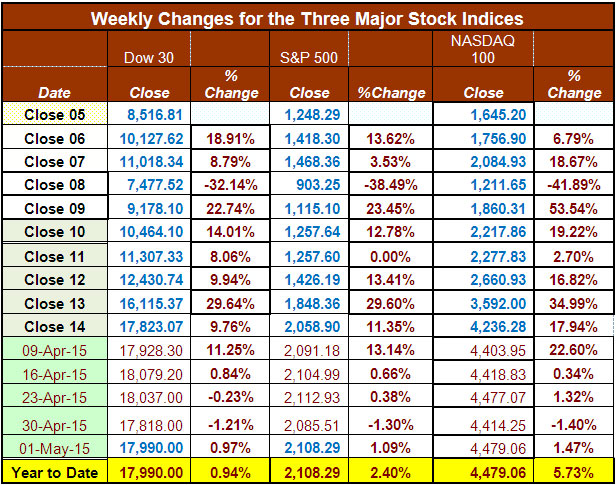
Below is a chart of the weekly changes in the three major US Indices. All three indices are up for 2015 now with the NASDAQ leading the pack.
Part III: Our Four Star Inflation—Deflation Model
In the simplest terms, inflation means that stuff gets more expensive, and deflation means that stuff gets cheaper. There’s a correlation between the inflation rate and market levels, so understanding inflation and deflation can help traders understand some important big-picture processes.
Here are the model components and how the prices looked at the end of April compared with two months back and six months back.
Month |
DBC2 |
DBC6 |
XLB2 |
XLB6 |
Gold2 |
Gold6 |
XLF2 |
XLF6 |
Total Score |
|
Higher |
Lower |
Lower |
Higher |
Lower |
Lower |
Lower |
Higher |
|
Apr 15 |
|
-1/2 |
|
+1/2 |
|
-1 |
|
-1/2 |
-1.5 |
The total score of -1.5 means deflation is the dominant force in April, though it was less strong than it has been in the last six months when the scores have been -2 or lower. See the tracking table below.
Date |
CCI>
DBC |
XLB |
Gold |
XLF |
Total
Score |
Dec ‘05 |
347.89 |
30.28 |
513 |
31.67 |
|
Dec ‘06 |
394.89 |
34.84 |
635.5 |
36.74 |
|
Dec ‘07 |
476.08 |
41.7 |
833.3 |
28.9 |
|
Dec ‘08 |
352.06 |
22.74 |
865 |
12.52 |
|
Dec ‘09 |
484.42 |
32.99 |
1,104.00 |
14.1 |
|
Dec ‘10 |
629.53 |
38.47 |
1,410.25 |
16 |
|
Dec ‘11 |
564.37 |
33.5 |
1,574.59 |
13 |
|
Dec ’12 CCI>DBC |
556.08
27.79 |
37.54 |
1,564.80 |
16.39 |
1 |
May ‘14 |
26.03 |
49.08 |
1250.50 |
22.29 |
+0.0 |
June ‘14 |
26.58 |
49.64 |
1315.00 |
22.74 |
+2.0 |
Jul ‘14 |
25.32 |
48.65 |
1285.25 |
22.41 |
+1.0 |
Aug ‘14 |
25.03 |
50.53 |
1285.75 |
23.36 |
-2.0 |
Sep ‘14 |
23.22 |
49.59 |
1209.10 |
23.17 |
-2.0 |
Oct ‘14 |
22.31 |
48.40 |
1164.25 |
23.84 |
-2.5 |
Nov’ 14 |
20.42 |
49.16 |
1182.75 |
24.40 |
-2.5 |
Dec ‘14 |
18.45 |
48.59 |
1199.25 |
24.73 |
-3.0 |
Jan ‘15 |
17.40 |
47.69 |
1260.25 |
23.01 |
-3.0 |
Feb ‘15 |
18.17 |
51.49 |
1213.70 |
24.35 |
-1.0 |
Mar’15 |
17.01 |
48.78 |
1187.00 |
24.11 |
-3.0 |
Apr’ 15 |
18.29 |
50.42 |
1180.25 |
24/13 |
-1.5 |
Overall we continue to show a deflationary trend in the markets with nine straight negative months. One explanation is that every country is trying to export their deflation to the US by devaluing their currency. See the trend in the dollar below.
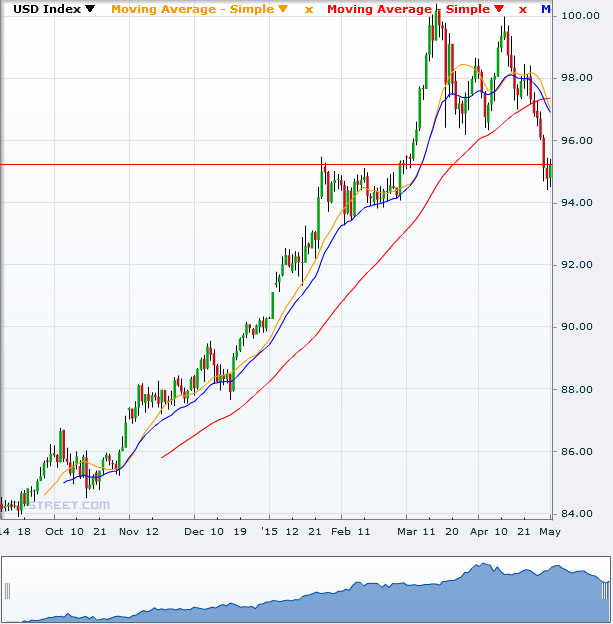
Part IV: Tracking the Dollar
The strong rise in the dollar now seems to be over. It made a double top and is down quite a bit over the last few weeks. Is this a new downturn or just a wide trading range? I have no idea as this letter is not about prediction, just what is happening.
Conclusion
I’m still hearing the rumor about how Putin is going to destroy the US dollar and ruin the lives of most Americans. When I hear that I wonder how much the rumor is like the evening news. Each evening, the local news broadcast is filled with shootings, fires, accidents, plus other bad news — and the national news is usually worse. Perhaps the news shows are just filling the needs of people who try to justify their unhappiness with all of the doom and gloom in the world.
Until next month, this is Van Tharp.
About the Author: Trading coach and author Van K. Tharp, Ph.D. is widely recognized for his best-selling books and outstanding Peak Performance Home Study Program—a highly regarded classic that is suitable for all levels of traders and investors. You can learn more about Van Tharp at www.vantharp.com. His new book, Trading Beyond The Matrix, is available now at matrix.vantharp.com.
Workshops
Combo Discounts available for all back-to-back workshops!
See our workshop page for details.
Trading Tip
April 2015 SQN® Report
by Van K. Tharp, Ph.D.
View on-line to resolve formatting problems
There are numerous ETFs that track everything from countries, commodities, currencies and stock market indices to individual market sectors. ETFs provide a wonderfully easy way to discover what’s happening in the world markets. Consequently, I now apply a version of my System Quality Number® (SQN®) score to measure the relative performance of numerous markets in a world model.
For the World Market Model, the Market SQN score formula uses each daily percent change over a 100-day period. Typically, a Market SQN score over 1.47 is strongly bullish and a score below -0.7 is very weak. The following color codes help communicate the strengths and weaknesses of the ETFs in this report:
| • |
|
Dark Green: ETFs with very strong Market SQN® scores> 1.47 |
| • |
|
Light Green: ETFs with strong Market SQN100 scores (0.70 to 1.47). |
| • |
|
Yellow: ETFs with slightly positive Market SQN scores (0 to 0.70). These are Neutral/Sideways |
| • |
|
Brown: ETFs with slightly negative Market SQN scores (0 to -0.7). |
| • |
|
Red: Very weak ETFs that earn negative Market SQN scores (< -0.7). |
This is basically the same rating method that we use for the market type classification. The world market model spreadsheet report below contains most currently available ETFs; including inverse funds, but excluding leveraged funds. In short, it covers the geographic world, the major asset classes, the equity market segments, the industrial sectors and the major currencies.
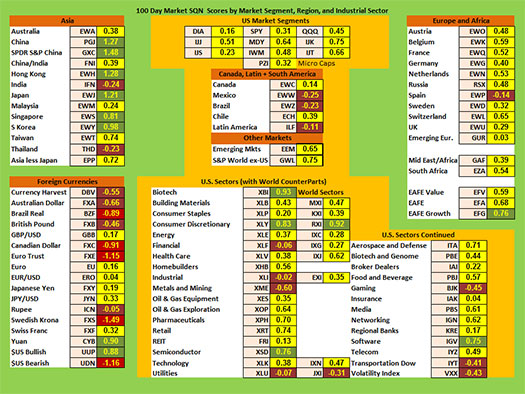
World Market Summary — Equities & Currencies
Each month, we look at the equities markets across the globe by segment, region and sector. This month what stands out is the predominance of neutrality (yellow) on the table. There are only 16 ETFs in the main table that are light green and only one dark green (Chinese Real Estate). There are ten red sections (mostly currencies and commodities). And there are 24 components are brown.
This month, all the segments in the US market are yellow. The dollar is strong (its Market SQN® score is 0.9, though it’s less than half of what it was last month).
Asia suddenly has a lot of light green countries. Thailand and India are brown but China, Hong Kong, Japan, Singapore, and South Korea are all light green. That’s a big up move from last month when I said Asia was not that strong.
Europe is also almost entirely yellow with Spain being brown.
Other than the US, the rest of the Americas’ countries are still weak. Mexico, Brazil, and Latin America are all brown, while Chile and Canada are now yellow.
The US sector view is not as strong as last month. There are six brown areas, Financials, Industrials, Metals and Mining, Utilities, and Dow Transports. There are four light green areas: Biotech, Consumer Discretionary, Semiconductors, and Software.
The USD continues to dominate currencies but it has become much weaker and suddenly the Chinese Yuan is actually stronger. Is this the start of the prediction that the oil countries will suddenly start to use the Yuan to price petroleum or just a short term trend? There are four really weak currencies: The Brazilian Real, The Canadian Dollar, The Euro, and the Swedish Krona.
Click Here to View a Larger Image
Commodities, Real Estate, Debt, Top and Bottom Lists
The next chart shows real estate, debt instruments, commodities and the top and bottom Market SQN scores for ETFs over the past 100 days.
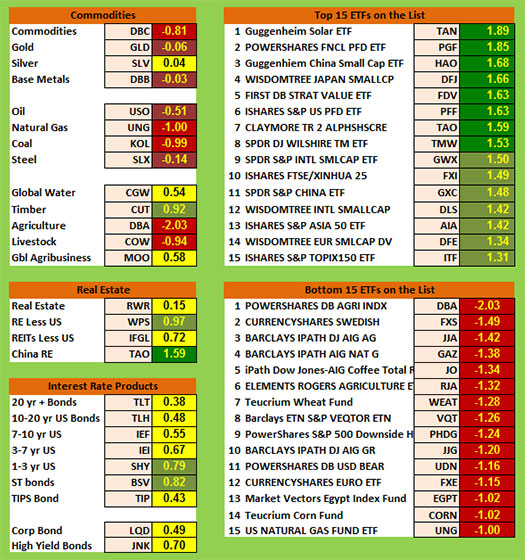
This month includes only one light green commodity which was timber, just like last month. We have five red areas, including: 1) blended commodities; 2) natural gas; 3) coal; 4) agriculture; and 5) livestock. Gold, oil and base metals are all negative. Silver, global water, and global agribusiness are all yellow.
Real Estate related ETFs are all positive with the strongest entry coming from Chinese real estate. And US real estate has moved from green to yellow.
Debt moved down this month going from light green last month to yellow now. Short term bonds are still light green but everything else is yellow.
As a group, the top ranking ETF scores seem to be falling even more. No ETFs in the database are above 2.0 this month and the strongest is solar energy at 1.89. In addition, the top 15 now include seven light green ETFs which is quite unusual. Last month there were four light green.
The bottom list includes one sector with an SQN score below -2.0 (agriculture) while the 15 worst are still red but only at -1.0 SQN. The bottom list now includes both currencies and commodities.
Summary
Now let’s look at the summary table which measures the percentage of ETFs in each of the strength categories.
Date |
Very
Bullish |
Bullish |
Neutral |
Bearish |
Very
Bearish |
2013 |
> 1.5 |
0.75 - 1.5 |
0 - 0.75 |
0 - -0.7 |
< - 0.7 |
Jan 31st, |
27.1% |
39.6% |
20.7% |
6.4% |
4.7% |
Feb 28th |
10.3% |
45.2% |
24.4% |
11.9% |
7.5% |
Mar 31st |
39.2% |
25.5% |
19.1% |
9.0% |
6.4% |
Apr 30th |
49.1% |
21.1% |
14.8% |
8.0% |
6.2% |
May 31st |
29,2% |
23.6% |
19.9% |
12.3% |
14.2% |
Jun 30th |
2.1% |
31.0% |
23.2% |
22.0% |
20.9% |
Jul 31st |
8.2% |
33.5% |
29.0% |
13.3% |
15.2% |
Aug 30th |
1% |
15% |
46.4% |
19.3% |
17.5% |
Sep 30th |
1% |
13.8% |
42.3% |
23.0% |
19.1% |
Nov 1st |
13.3% |
48.3% |
21.8% |
12.5% |
3.3% |
Dec 1st |
14.6% |
42.7% |
24.2% |
13.3% |
4.3% |
Dec 31st |
19.3.% |
45.5% |
22.0% |
11.3% |
2.9% |
2014 |
|
|
|
|
|
Jan 31st |
8.0% |
49.3% |
20.7% |
12.7% |
7.6% |
Feb 28th |
18.9% |
48.4% |
18.1% |
6.2% |
6.8% |
Mar 31st |
4.9% |
40.2% |
38.8% |
13.3% |
3.1% |
Apr 30th |
11.1% |
33.9% |
40.2% |
11.3% |
1.8% |
May 31st |
12.5% |
46.5% |
27.7% |
7.6% |
6.0% |
Jun 30th |
53.4% |
33.7% |
14.2% |
2.5% |
0.8% |
Aug 29th |
20.3% |
45.2% |
22.8% |
10.5% |
5.3% |
Sep 30th |
6.6% |
26.9% |
30.2% |
24.0% |
18.5% |
Oct 31st |
2.9% |
17.9% |
38.8% |
17.7% |
26.3% |
Nov 30th |
3.1% |
25.7% |
25.1% |
22.8% |
27.9% |
Dec 31st |
3.7% |
29.2% |
24.8% |
15.6% |
31.2% |
2015 |
|
|
|
|
|
Jan 31st |
7.2% |
9.4% |
35.1% |
25.5% |
27.3% |
Feb 28th |
6.4% |
41.1% |
34.5% |
11.5% |
10.9% |
Mar 31st |
2.3% |
24.0% |
46.4% |
19.7% |
12.9% |
April 30th |
1.6% |
13.6% |
69.4% |
15.0% |
5.7% |
What stands out about the database as a whole is the large move toward neutrality. Last month, the neutral category portion was noticeable at 46.4% — the largest reading for neutral since August 2013. Now, neutral is at 69.4% which is a new record since we’ve been tracking the numbers. I have no idea, however, what that means. I’m just reporting what I see.
I will be on my driving trip around the country for the next month and will get back in early June. As a result, these reports may be delayed by a week or so next month.
Until early June, this is Van Tharp.
The markets always offer opportunities, but to capture those opportunities, you MUST know what you are doing. If you want to trade these markets, you need to approach them as a trader, not a long-term investor. We’d like to help you learn how to trade professionally because trying to navigate the markets without an education is hazardous to your wealth.
All the beliefs given in this update are my own. Though I find them useful, you may not. You can only trade your own beliefs about the markets.
Q & A
The Position Sizing Game
Questions and Answers
Hi,
I am thinking of purchasing The Position Sizing Game.
I finished Level 3, thanks to your free offer,
but I have some questions.
Q: I could not find any suggestion, recommendation or comments for what I did during Level 1 to 3 so I am not sure I played using the correct method of position sizing or if I accidentally succeeded. Do you have any suggestion or comments for further levels of that game?
A: My suggestion is to study the Level Guides in the game (Help menu) very carefully. That part of the game has a lot of excellent information about how to proceed. You will learn best by experimenting with different position sizing strategies each time you play the game.
Q: I cannot understand how I can decide Risk per Share($ or %) when we are only given Account Balance and Market Data. In Level-1and 3, while I can decide a total risk(e.g. 3%) by calculating from Account Balance.(using THE PERCENT RISK MODEL), I decided Risk per Share by estimating Volatility from Price Charts in Level-2.(using THE PERCENT VOLATILITY MODEL)
Risk per Shares will not be decided with Market Data Price by my understanding of your book, but I did continuous trial and errors by choosing Risk per Share base on Market Data price.
Could you let me know how I can figure out the correct Risk per Share with Account Balance and Market Data Price?
A: Your primary concern (actually your only concern) in this game is the amount that you risk per position. You accomplish this task through the risk per share and the number of shares you choose to purchase. Whichever way that you divide the total risk per position, the amount of equity that you risk in each position is your focus.
Q: I am thinking of option trading in the near future. Can I learn the Position Sizing Method of Option Trading by further levels in the Position Sizing Game?
A: You can learn position sizing strategies applicable for underlying issues through the game. This has value in options trading if you are using options as an instrument for simple long or short positions. There are, however, a number of other factors involved with option trading strategies and option prices that complicate position sizing strategies for options trades beyond what the game was designed to help you learn.
The Position Sizingsm Trading Simulation Game
Purchase the full game and gain all the benefits of this practical tool!
While people always look for the "real" secrets of top traders, they tend to look in all the wrong places and at all the wrong things.
To so many traders, success seems to come from finding the
ultimate stock picking methods or a magical trading system
with 80%+ winning trades.
Let me be clear about what my research has proven to me:
Picking the right stocks has nothing to do with trading success and neither do amazing trading systems with high percentage wins.
As you progress, the game changes systems you trade so you can experience what it’s like to trade different probabilities and expectancies. Beginning with Level 5, you have the option of going long or short on a trade, which means that you can go with the probability or with the expectancy. Hopefully, you'll learn how dangerous it is to bet against the expectancy, even though you get to win (or be right) more often.
In Levels 6 through 10, you have to earn your big R-multiples by letting your profits run on a winning position. Losing trades happen quickly, but winning trades take time to develop fully. When a winning trade starts, it is probably just a 1R win but chances are that it will continue to be a winner as the trade progresses. Once a winning trade starts, you have to decide how much to risk—time period by time period. Do you want to risk a portion of your profits for a further gain or all of your profits for a shot at the moon? Once you make it to Level 10 you can put in your own trades. In the process, you learn not only about position sizing strategies but your emotional experiences along the way, which helps you exercise and develop your discipline.
Learn more...
Purchase Now for $195
or
Download Levels 1-3 At No Charge
Matrix Contest
 Enter the Matrix Contest Enter the Matrix Contest
for a chance to win a free workshop!
We want to hear about the one most profound insight that you got from reading Van's new book, Trading Beyond the Matrix, and how it has impacted your life. If you would like to enter, send an email to [email protected].
If you haven't purchased Trading Beyond the Matrix yet, click here.
For more information about the contest, click here.
Ask Van...
Everything we do here at the Van Tharp Institute is focused on helping you improve as a trader and investor. Consequently, we love to get your feedback, both positive and negative!
Send comments or ask Van a question by clicking here.
Also, Click here to take our quick, 6-question survey.
Back to Top
Contact Us
Email us at [email protected]
The Van Tharp Institute does not support spamming in any way, shape or form. This is a subscription based newsletter.
To change your e-mail Address, e-mail us at [email protected].
To stop your subscription, click on the "unsubscribe" link at the bottom left—hand corner of this email.
How are we doing? Give us your feedback! Click here to take our quick survey.
Call us at: 800-385-4486 * 919-466-0043 * Fax 919-466-0408
SQN® and the System Quality Number® are registered trademarks of the Van Tharp Institute and the International Institute of Trading Mastery, Inc.
Be sure to check us out on Facebook and Twitter!
 
Back to Top |
|
May 5, 2015 #732

Our Mission
Van's Top-Twelve Favorite Trading Books
Van's Favorite Non-Trading Books
Viewing on-line eliminates spacing, and formatting problems that may be unique to your email program.
Ongoing Contest: Learn how you could win a $50 coupon and a grand prize of a free workshop!

"I base my long-term, monthly rebalancing [core] strategies on research into relative strength and momentum as it relates to broad asset classes."-K Long

A Must Read for All Traders
Super Trader
How are we doing?
Give us your feedback!
Click here to take our quick survey.
From our reader survey...
"I think the newsletter is extremely generous and it is a resource I utilize constantly. I have saved every single one since I first subscribed."
Trouble viewing this issue?
View Online. »
Van Tharp You Tube Channel
Tharp Concepts Explained...
-
Trading Psychology
-
System Development
-
Risk and R—Multiples
-
Position Sizing
-
Expectancy
-
Business Planning
Learn the concepts...
Read what Van says about the mission of his training institute.
The Position Sizing Game Version 4.0
Have you figured out yet how to pick the right stocks? Are you still looking for a high win-rate trading system? When you’re ready to get serious about your trader education, download the Position Sizing Game to learn some true fundamentals of trading success. Learn more.
To Download for Free or Upgrade Click Here

Download the first three levels of Version 4.0 for free:
Register now. »
Trouble viewing this issue?
View Online. »

Dr. Tharp is on Facebook

Follow Van through
Twitter »

Check out our home study materials, e-learning courses, and best-selling books.
Click here for products and pricing
What Kind of Trader Are You? Click below to take the test.
Tharp Trader Test
Back to Top

Introduction to Position Sizing™ Strategies
E-Learning Course
Perfect for auditory/visual learners who learn more effectively from an instructional format that is full of interactive features!
Only $149
Learn More
Buy Now
SQN® and the System Quality Number® are registered trademarks of the Van Tharp Institute
|