Tharp's Thoughts Weekly Newsletter
-
Article: March 2015 Market Update — Neutral Normal by Van K. Tharp, Ph.D.
-
Workshops: New Schedule Updates, June-August Dates Announced
-
Tip: March 2015 SQN ® Report, by Van K. Tharp, Ph.D.
$700 Discount Ends Today!
on April's Peak Performance Workshops!

The Peak Performance 101 workshop has been the core of Van Tharp's instruction for 26 years.
Spend three thought-provoking days with Dr. Tharp by attending any one of the Peak Performance courses in April.
Dr. Tharp is the most consistent, astute and systematic researcher of human behavior you’ll probably ever meet. Spend three days with him this April during this life changing event.
You’ll leave this workshop knowing, for the first time in your life, why some people consistently make profits over and over again while others are erratic and unsuccessful.
More importantly, you’ll be able to overcome self-sabotage and develop rock-solid discipline in your market performance. You’ll learn why this course was featured in Forbes magazine and why it was quoted as saying,"Tharp’s disciples swear by the results."
To register or to see the full workshop schedule, click here.
Attend all three Peak Performance Workshops back-to-back in April! It may be your best (and only!) opportunity to catch all three of these workshops in the same trip in 2015!
New workshops have been added to the schedule for June, July, and August.
Article
 March 2015 Market Update:
Neutral Normal
by Van K. Tharp, Ph.D.
View on-line to resolve formatting problems
I always say that people do not trade the markets; they trade their beliefs about the markets. In that same way, I'd like to point out that these updates reflect my beliefs. I find the market update information useful for my trading, so I do the work each month and am happy to share that information with my readers.
However, if your beliefs are not similar to mine, then this information may not be useful to you. Thus, if you are inclined to do some sort of intellectual exercise to prove one of my beliefs wrong, simply remember that everyone can usually find lots of evidence to support their beliefs and refute others. Just simply know that I admit that these are my beliefs and that your beliefs might be different.
These monthly updates are in the first issue of Tharp's Thoughts each month. This allows us to get the closing month's data. These updates cover 1) the market type (first mentioned in the April 30, 2008 edition of Tharp's Thoughts), 2) the five week status on each of the major US stock market indices, 3) our four star inflation-deflation model plus John Williams' statistics, and 4) tracking the dollar. I will now report on the strongest and weakest areas of the overall market as a separate SQN™ Report. And that may come out twice a month if there are significant market charges.
Part I: The Big Picture
US equities have spent the last 100 days going up 2.77% which equates to a neutral market. The current 100 day period includes December and January which were sideways months in about a 5% range. That’s an astonishing contrast to one other aspect of the last 100 days — the S&P also produced 23 all-time high closes in the same period.
Furthermore, the US dollar has been going up during most of this time. In fact, one person pointed out the reason the big picture report has been looking so dismal is that it is all based in US dollars. When the US dollar is in a huge bull market, then everything else looks weak.
Debt Clock
The State of the United States |
Month Ending |
National Debt |
Federal Tax Revenue |
Federal Spending |
Trade Deficit |
Debt Per Family |
Unfunded Liabilities |
Taxpayers |
People supported by them |
July 31, 2012 |
$15.93 trillion |
$2.364 trillion |
$3.632 trillion |
$810 billion |
$684,405 |
|
|
|
Dec 30, 2012 |
$16.42 trillion |
$2.452 trillion |
$3.540 trillion |
$740.7 billion |
$732,086 |
|
|
|
July 31, 2013 |
$16.89
Trillion |
$2.73
trillion |
$3.535 trillion |
$703 billion |
$748,458 |
Unfunded Liabilities |
115.2 million |
109.9
95.4% |
Dec 31, 2013 |
$17.27 trillion |
$2,82 trillion |
$3,480 trillion |
$692 billion |
$751,294 |
$127.2 trillion |
115.0 million |
108.5M
94.3% |
Aug 31, 2014 |
$17.70 trillion |
$2.97 trillion |
$3.53 trillion |
$706 billion |
$757,297 |
$118.0
trillion |
116.5 million |
104.5
90.0% |
Sep 30, 2014 |
$17.77 trillion |
$2.98 trillion |
$3.53 trillion |
$707 billion |
$730,321 |
$116.3
trillion |
116.7 million |
104.9
90.0% |
Oct 31, 2014 |
$17.9 trillion |
$3.05 trillion |
$3.53 trillion |
$703.5 billion |
$729,784 |
$115.4 trillion |
116.9 million |
105.1
89.9% |
Nov 29, 2014 |
$18.0 trillion |
$3.07 trillion |
$3.55 trillion |
$710.8 billion |
$729,477 |
$115.7 trillion |
117.1 million |
105.1
89.7% |
Dec 31, 2014 |
$18.04 trillion |
$3.08 trillion |
$3.57 trillion |
$713.2 billion |
$733,741 |
$92.5 trillion |
117.3 million |
104.4
89.0% |
Jan 31, 2015 |
$18.10 trillion |
$3.11 trillion |
$3.59 trillion |
$318.7 billion |
$732,620 |
$94.1 trillion |
117.5 million |
105.7
90.0% |
Feb 28, 2015 |
$18.14 trillion |
$3.13 trillion |
$3.60 trillion |
$725.0 billion |
$732,054 |
$95.3 trillion |
117.7 million |
|
Mar 31, 2015 |
$18.17 trillion |
$31.5 trillion |
$3.63 trillion |
$723.3 billion |
$757,614 |
$95.7 trillion |
117.8 million |
105.4
89.5% |
So in three months our official debt has gone up by $130 billion according to usdebtclock.org. Furthermore, the tendency for the government to manipulate our unfunded debt seems to have tapered off and it now seems to get going up slightly each month.
Part II: The Current Stock Market Type Is Neutral Normal.
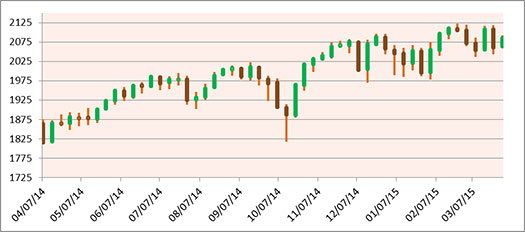
You know that I use the Market SQN 100 day period for the S&P 500 as my major indicator of market type. We also look at the Market SQN® scores for 25, 50 and 200 days. Right now the 200-day, the 100-day, and the 50-day Market SQN scores are all neutral while the 25-day is bear. The volatility chart is in an uptrend and has moved into normal territory.
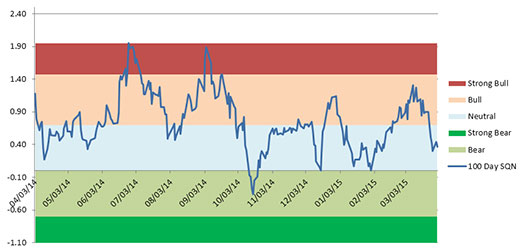
My market type classification is not predictive but rather descriptive — it tells us what’s going on now rather than what’s going to happen. The graphs below include a chart of weekly bars for the S&P 500 over the last year, the Market SQN® score for 100-days, and the percent volatility.
The next chart shows the market SQN score over the last year.
And the final chart shows the 20 day ATR% which we use as a measure of volatility.

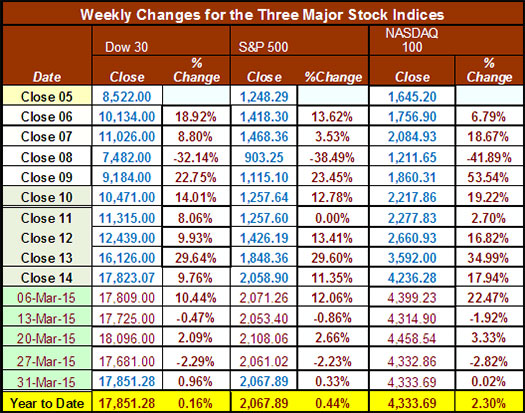
Below is a chart of the weekly changes in the three major US Indices. All three indices for 2015 now are up with the NASDAQ leading the pack.
Below is a chart of the weekly changes in the three major US Indices except that I am just showing the end of year closes before 2015. All three indices are up for 2015.
Part III: Our Four Star Inflation-Deflation Model
In the simplest terms, inflation means that stuff gets more expensive, and deflation means that stuff gets cheaper. There’s a correlation between the inflation rate and market levels, so the inflation rate can help traders understand big-picture processes.
Here are the model components and how the prices look at the end of February compared with two months back and six months back. The total score of -1 in February’s update meant deflation was the dominant force but it was less strong than it had been in the previous six months when the scores have been -2 or lower. See the tracking table below.
Date |
CCI>
DBC |
XLB |
Gold |
XLF |
Total
Score |
Dec ‘05 |
347.89 |
30.28 |
513 |
31.67 |
|
Dec ‘06 |
394.89 |
34.84 |
635.5 |
36.74 |
|
Dec ‘07 |
476.08 |
41.7 |
833.3 |
28.9 |
|
Dec ‘08 |
352.06 |
22.74 |
865 |
12.52 |
|
Dec ‘09 |
484.42 |
32.99 |
1,104.00 |
14.1 |
|
Dec ‘10 |
629.53 |
38.47 |
1,410.25 |
16 |
|
Dec ‘11 |
564.37 |
33.5 |
1,574.59 |
13 |
|
Dec ‘12
CCI>DBC |
556.08
27.79 |
37.54 |
1,564.80 |
16.39 |
1 |
Feb ‘14 |
26.13 |
47.08 |
1326.50 |
21.70 |
-3.0 |
Mar ‘14 |
26.12 |
47.28 |
1291.75 |
22.34 |
+0.5 |
Apr ‘14 |
26.41 |
47.67 |
1288.50 |
21.96 |
+0.0 |
May ‘14 |
26.03 |
49.08 |
1250.50 |
22.29 |
+0.0 |
June ‘14 |
26.58 |
49.64 |
1315.00 |
22.74 |
+2.0 |
Jul ‘14 |
25.32 |
48.65 |
1285.25 |
22.41 |
+1.0 |
Aug ‘14 |
25.03 |
50.53 |
1285.75 |
23.36 |
-2.0 |
Sep ‘14 |
23.22 |
49.59 |
1209.10 |
23.17 |
-2.0 |
Oct ‘14 |
22.31 |
48.40 |
1164.25 |
23.84 |
-2.5 |
Nov ‘14 |
20.42 |
49.16 |
1182.75 |
24.40 |
-2.5 |
Dec ‘14 |
18.45 |
48.59 |
1199.25 |
24.73 |
-3.0 |
Jan ‘15 |
17.40 |
47.69 |
1260.25 |
23.01 |
-3.0 |
Feb ‘15 |
18.17 |
51.49 |
1213.70 |
24.35 |
-1.0 |
Mar ‘15 |
17.01 |
48.78 |
1187.00 |
24.11 |
-3.0 |
Month |
DBC2 |
DBC6 |
XLB2 |
XLB6 |
Gold2 |
Gold6 |
XLF2 |
XLF6 |
Total Score |
|
Lower |
Lower |
Higher |
Lower |
Lower |
Lower |
Lower |
Higher |
|
March 15 |
|
-1 |
|
-1/2 |
|
-1 |
|
-1/2 |
-3.0 |
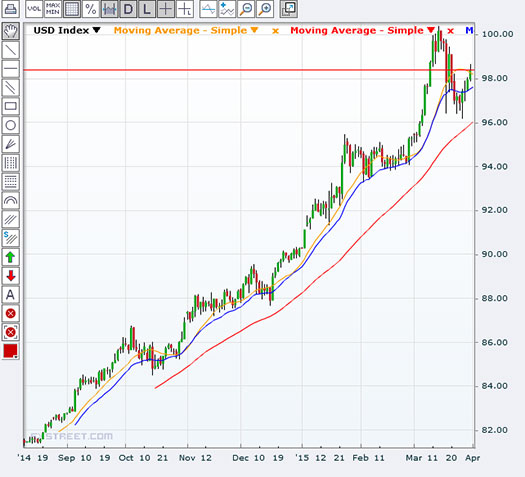
The model continues to show strong deflationary forces in the markets. One explanation is that every country is trying to export their deflation into the US dollar by devaluating their currencies. See the trend in the dollar below.
Part IV: Tracking the Dollar
I was overseas during most of March and the Tharp rule was broken as the dollar rose against the currencies in the countries I was visiting. That doesn’t happen usually. In Australia, the US dollar gained at least 3 cents over the Aussie dollar during the 10 days I was there; however, we saw an end to that trend in the last week of March after we got home. Regardless, the trend below is a dream for trend followers and anyone who knows what they are doing in FX has made a ton of money in the US dollar trend.
Conclusion
Right now, we are looking at a sideways market type — which includes the strong S&P rise in November coming out of the October lows. The Market SQN for April’s update, however, will drop November’s dates and start from early December. Unless April is a huge up month, we could move into bear market conditions in the coming weeks.
I’m not going to put in my usual 7 point recommendation for politicians in this month’s issue. None of the actions have been taken in the six months or so I’ve been publishing it. I doubt they even read it.
I do, however, want to talk about something serious that could happen soon.
When the US dollar went off the gold standard in 1971, our economy was in trouble for several years and then it started to rebound. In fact, since that happened, the US Dollar has still remained the world’s reserve currency. That’s why we have been able to print trillions of dollars and get other countries to buy them.
But why has the US Dollar remained the world’s reserve currency? The reason is simple. The US dollar became the standard by which oil was sold all over the world. Kissinger made an agreement with the Saudis (and OPEC) to keep oil prices based in US dollars. And in return the US guaranteed to buy lots of oil from OPEC.
Well, several interesting developments have happened recently. First, have you noticed what’s happened to the price of oil? Last time I filled up, I paid about $2.25 a gallon and that was a surprise since I seldom get gas anymore — I drive a Tesla and just charge it in my garage. So why has the price of gas gone down? The reason is that the US has learned how to get oil out of shale cheaply and has now become one of the top oil producers in the world. This has greatly hurt oil producing economies all over the world.
The BRIC countries (Brazil, Russia, India, and China) have been pushing for the end of the petro dollar for some time, wanting to substitute a petro yuan exchange instead. And why not? China is now the largest oil consumer in the world. OPEC has resisted this move and nothing happened for a while — but in January, Saudi King Abdulla died. King Salman took his place and the new king seems much more likely to honor the request of the BRIC countries.
Right now the US dollars held by foreign countries in reserve is something like $62 trillion. At each US Treasury auction, foreign governments purchase more than 50% of our debt. But all of that could change if the Petro-dollar dies – and it could happen suddenly. Countries would want the Yuan and not the US Dollar to finance their oil transactions. They might even start cashing in their dollars. We are fortunate that China owns most of the foreign held dollars so they might be a reluctant participant until they can dispose of most of the dollars by buying gold or oil.
But once the petro-yuan is official, trillions of dollars could flood back to the US. Interest rates would rise dramatically because we could not sell our debt at low interest rates anymore. The stock market and the housing market would collapse and we would have a financial crisis much worse than 2007-8.
Will this happen in 2015? It could — but I think it’s unlikely as China would have to cooperate and they would stand to lose a lot of value if the US currency they hold in reserve were to depreciate suddenly and dramatically. So perhaps we have a while yet but I’m pretty sure this will happen in the next few years. And when it does, you need to know how to be a trader. Traders will be able to make lots of money while those who refuse to prepare themselves with education will have a horrible shock.
Be prepared, but also remember that crisis is opportunity. Until next month, this is Van Tharp.
About the Author: Trading coach and author Van K. Tharp, Ph.D. is widely recognized for his best-selling books and outstanding Peak Performance Home Study Program—a highly regarded classic that is suitable for all levels of traders and investors. You can learn more about Van Tharp at www.vantharp.com. His new book, Trading Beyond The Matrix, is available now at matrix.vantharp.com.
Workshops
Combo Discounts available for all back-to-back workshops!
See our workshop page for details.
Trading Tip
March 2015 SQN® Report
by Van K. Tharp, Ph.D.
View on-line to resolve formatting problems
There are numerous ETFs that track everything from countries, commodities, currencies and stock market indices to individual market sectors. ETFs provide a wonderfully easy way to discover what’s happening in the world markets. Consequently, I now apply a version of my System Quality Number® (SQN®) score to measure the relative performance of numerous markets in a world model.
The Market SQN score uses the daily percent change for input over a 100-day period. Typically, a Market SQN score over 1.47 is strongly bullish and a score below -0.7 is very weak. The following color codes help communicate the strengths and weaknesses of the ETFs in this report:
| • |
|
Dark Green: ETFs with very strong SQN® 100 scores> 1.47 |
| • |
|
Light Green: ETFs with strong SQN100 scores (0.70 to 1.47). |
| • |
|
Yellow: ETFs with slightly positive Market SQN scores (0 to 0.70). These are Neutral/Sideways |
| • |
|
Brown: ETFs with slightly negative Market SQN scores (0 to -0.7). |
| • |
|
Red: Very weak ETFs that earn negative Market SQN scores (< -0.7). |
This is basically the same ratings that we use for the Market SQN® Score. The world market model spreadsheet report below contains most currently available ETFs; including inverse funds, but excluding leveraged funds. In short, it covers the geographic world, the major asset classes, the equity market segments, the industrial sectors and the major currencies.
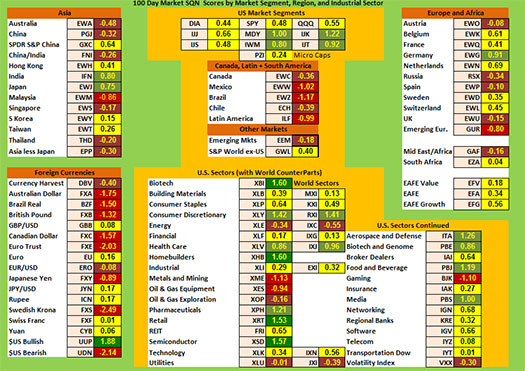
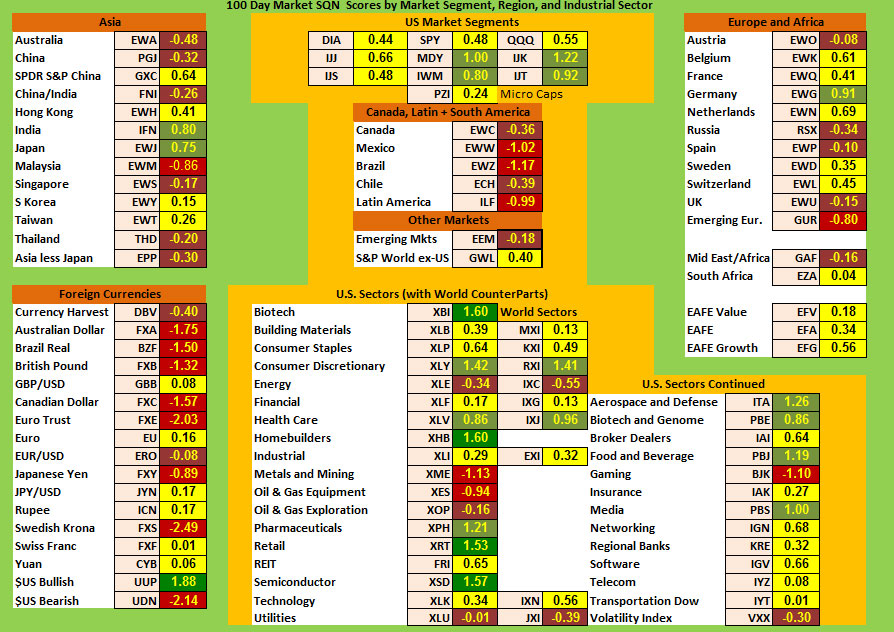
World Market Summary – Equities and Currencies
Each month, we look at the equities markets across the globe by segment, region and sector. This month only the US segments are all positive. The dollar is still super strong (Market SQN® 100 score of 1.88) and someone recently pointed out that if the currency in which the entire SQN model is based is super strong then everything else will look weak. So keep that in mind.
Every US market segment has turned green or yellow, meaning they are all up. But that’s logical with a strong US Dollar.
Asia has only two markets that are light green — India and Japan. Malaysia is still red and six other areas are brown. Overall, Asia is not that strong.
Europe has one light green market which is Germany; however, many areas are yellow including Belgium, France, the Netherlands, Sweden, and Switzerland. Emerging Europe is red and Austria, Russia, Spain, and the UK are all brown.
The Americas (other than the US) look dismal. Mexico, Brazil, and Latin America are all red while Chile and Canada are brown.
The sector view is pretty good with only two red sectors - Metals and Mining plus Oil and Gas Equipment. Energy, Oil and Gas Exploration, and Utilities are all brown. But on the positive side are green sectors including - Consumer Discretionary, Health Care, Pharmaceuticals, Aerospace and Defense, Biotech and Genome, Food and Beverage, and Media. The strongest sectors are Biotech, Homebuilders, Retail, and Semiconductors which are all dark green.
The US dollar continues to dominate currencies as the only green colored currency at all. The Swedish Krona, the Australian Dollar, the British Pound, the Canadian Dollar, the Euro, and the Japanese Yen are all red. In view of my comments in this month’s big picture update about the Petro dollar becoming the Petro Yuan we will be keeping our eye on the Yuan in the future. It is basically flat with an SQN 100 of 0.06
For a larger image CLICK HERE.
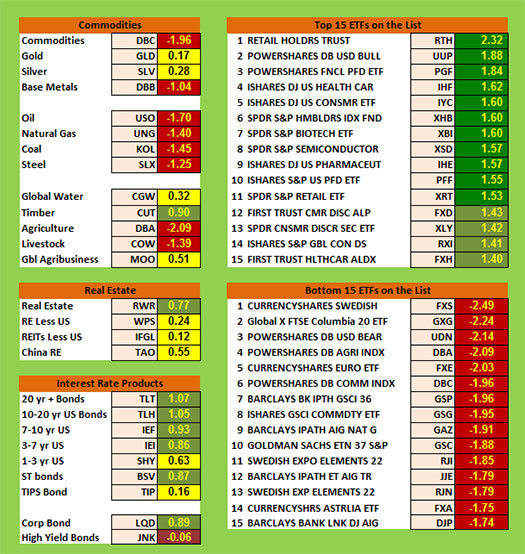
Commodities, Real Estate, Debt, Top and Bottom Lists
The next chart shows real estate, debt instruments, commodities and the top and bottom ETFs for the past 100 days.
This month includes only one light green commodity which was timber. Commodities include eight red areas: 1) blended commodities; 2) base metals; 3) natural gas; 4) coal; 5) steel; 6) agriculture; 7) oil, and 8) livestock. Gold and silver have actually turned positive.
Real Estate related ETFs are all positive with the strongest entry coming from US real estate.
Debt is mostly light green this month. 1-3 year bonds, and TIPS bonds being the exception I that they are green. And high yield bonds are brown.
The top ranking ETFs in the database seem to have lower scores than I remember recently. Only one ETF is above 2.0 and that’s the retail holder’s trust. In addition, the top 15 list now includes four which are light green. That’s quite unusual. The dark green ETFs are all sectors within the US market.
The bottom list includes five sectors with SQN scores below -2.0 and all of the weakest ETFs are red which is normal. The weakest list now includes both currencies and commodities.
Summary
Now let’s look at the summary table which measures the percentage of ETFs in each of the strength categories.
Date |
Very
Bullish |
Bullish |
Neutral |
Bearish |
Very
Bearish |
2013 |
> 1.5 |
0.75 - 1.5 |
0 - 0.75 |
0 - -0.7 |
< - 0.7 |
Jan 31st, |
27.1% |
39.6% |
20.7% |
6.4% |
4.7% |
Feb 28th |
10.3% |
45.2% |
24.4% |
11.9% |
7.5% |
Mar 31st |
39.2% |
25.5% |
19.1% |
9.0% |
6.4% |
Apr 30th |
49.1% |
21.1% |
14.8% |
8.0% |
6.2% |
May 31st |
29,2% |
23.6% |
19.9% |
12.3% |
14.2% |
Jun 30th |
2.1% |
31.0% |
23.2% |
22.0% |
20.9% |
Jul 31st |
8.2% |
33.5% |
29.0% |
13.3% |
15.2% |
Aug 30th |
1% |
15% |
46.4% |
19.3% |
17.5% |
Sep 30th |
1% |
13.8% |
42.3% |
23.0% |
19.1% |
Nov 1st |
13.3% |
48.3% |
21.8% |
12.5% |
3.3% |
Dec 1st |
14.6% |
42.7% |
24.2% |
13.3% |
4.3% |
Dec 31st |
19.3.% |
45.5% |
22.0% |
11.3% |
2.9% |
2014 |
|
|
|
|
|
Jan 31st |
8.0% |
49.3% |
20.7% |
12.7% |
7.6% |
Feb 28th |
18.9% |
48.4% |
18.1% |
6.2% |
6.8% |
Mar 31st |
4.9% |
40.2% |
38.8% |
13.3% |
3.1% |
Apr 30th |
11.1% |
33.9% |
40.2% |
11.3% |
1.8% |
May 31st |
12.5% |
46.5% |
27.7% |
7.6% |
6.0% |
Jun 30th |
53.4% |
33.7% |
14.2% |
2.5% |
0.8% |
Aug 29th |
20.3% |
45.2% |
22.8% |
10.5% |
5.3% |
Sep 30th |
6.6% |
26.9% |
30.2% |
24.0% |
18.5% |
Oct 31st |
2.9% |
17.9% |
38.8% |
17.7% |
26.3% |
Nov 30th |
3.1% |
25.7% |
25.1% |
22.8% |
27.9% |
Dec 31st |
3.7% |
29.2% |
24.8% |
15.6% |
31.2% |
2015 |
|
|
|
|
|
Jan 31st |
7.2% |
9.4% |
35.1% |
25.5% |
27.3% |
Feb 28th |
6.4% |
41.1% |
34.5% |
11.5% |
10.9% |
Mar 31st |
2.3% |
24.0% |
46.4% |
19.7% |
12.9% |
What stands out about the database as a whole is the large move toward the neutral category. It now stands at 46.4% of all of the ETFs which is the largest reading for that category since August 2013, however, we have no idea what this means.
The markets always offer opportunities, but to capture those opportunities, you MUST know what you are doing. If you want to trade these markets, you need to approach them as a trader, not a long-term investor. We’d like to help you learn how to trade professionally because trying to navigate the markets without an education is hazardous to your wealth.
All the beliefs given in this update are my own. Though I find them useful, you may not. You can only trade your own beliefs about the markets.
Until the end of April this is Van Tharp.
Matrix Contest
 Enter the Matrix Contest Enter the Matrix Contest
for a chance to win a free workshop!
We want to hear about the one most profound insight that you got from reading Van's new book, Trading Beyond the Matrix, and how it has impacted your life. If you would like to enter, send an email to [email protected].
If you haven't purchased Trading Beyond the Matrix yet, click here.
For more information about the contest, click here.
Ask Van...
Everything we do here at the Van Tharp Institute is focused on helping you improve as a trader and investor. Consequently, we love to get your feedback, both positive and negative!
Send comments or ask Van a question by clicking here.
Also, Click here to take our quick, 6-question survey.
Back to Top
Contact Us
Email us at [email protected]
The Van Tharp Institute does not support spamming in any way, shape or form. This is a subscription based newsletter.
To change your e-mail Address, e-mail us at [email protected].
To stop your subscription, click on the "unsubscribe" link at the bottom left-hand corner of this email.
How are we doing? Give us your feedback! Click here to take our quick survey.
Call us at: 800-385-4486 * 919-466-0043 * Fax 919-466-0408
SQN® and the System Quality Number® are registered trademarks of the Van Tharp Institute and the International Institute of Trading Mastery, Inc.
Be sure to check us out on Facebook and Twitter!
 
Back to Top |
|
April 01, 2015 #727

Our Mission
Van's Top-Twelve Favorite Trading Books
Yahoo and Gmail Users:
Viewing on-line eliminates spacing, and formatting problems that may be unique to your email program.
Ongoing Contest: Learn how you could win a $50 coupon and a grand prize of a free workshop!

"I base my long-term, monthly rebalancing [core] strategies on research into relative strength and momentum as it relates to broad asset classes."-K Long

A Must Read for All Traders
Super Trader
How are we doing?
Give us your feedback!
Click here to take our quick survey.
From our reader survey...
"I think the newsletter is extremely generous and it is a resource I utilize constantly. I have saved every single one since I first subscribed."
Trouble viewing this issue?
View Online. »
Tharp Concepts Explained...
-
Trading Psychology
-
System Development
-
Risk and R-Multiples
-
Position Sizing
-
Expectancy
-
Business Planning
Learn the concepts...
Read what Van says about the mission of his training institute.
The Position Sizing Game Version 4.0
Have you figured out yet how to pick the right stocks? Are you still looking for a high win-rate trading system? When you’re ready to get serious about your trader education, download the Position Sizing Game to learn some true fundamentals of trading success. Learn more.
To Download for Free or Upgrade Click Here

Download the first three levels of Version 4.0 for free:
Register now. »
Trouble viewing this issue?
View Online. »

Dr. Tharp is on Facebook

Follow Van through
Twitter »

Check out our home study materials, e-learning courses, and best-selling books.
Click here for products and pricing
What Kind of Trader Are You? Click below to take the test.
Tharp Trader Test
Back to Top

Introduction to Position Sizing™ Strategies
E-Learning Course
Perfect for auditory/visual learners who learn more effectively from an instructional format that is full of interactive features!
Only $149
Learn More
Buy Now
SQN® and the System Quality Number® are registered trademarks of the Van Tharp Institute
|