$700 Discount Ends Next Week for April's
Peak Performance Workshops!

The Peak Performance 101 workshop has been the core of Van Tharp's instruction for 26 years.
Spend three thought-provoking days with Dr. Tharp by attending any one of the Peak Performance courses in April.
Dr. Tharp is the most consistent, astute and systematic researcher of human behavior you’ll probably ever meet. Spend three days with him this April during this life changing event.
He is a pioneer in the trading coach field. There are other trading coaches today, but when Dr. Tharp conceptualized the process 30 years ago (as he developed his home study course), he was one of the first people to ever do so. Attending this course means that you are learning from the best!
To register or to see the full workshop schedule, click here.
Article
 Bear Market Trading - In A Bull Market
by Mark McDowell
View on-line to resolve formatting problems
If you look at the major stock indexes, such as the S&P 500 or the NASDAQ 100, the daily chart pattern shows an uptrend indicating the US stock market type is "bull". The visual assessment is supported by Dr. Van Tharp's market type methodology (Tharp’s Thoughts-March 04, 2015), which classifies the S&P 500 as a bull quiet market type.
While the overall market has been trending up, you can find a major bear market type within individual market sectors or industry groups. Since last September, the energy market has been trending down strongly. The bear market in the energy sector has tracked the drop in oil prices. Oil futures peaked at $107 last July and are currently trading in the mid-$40s.
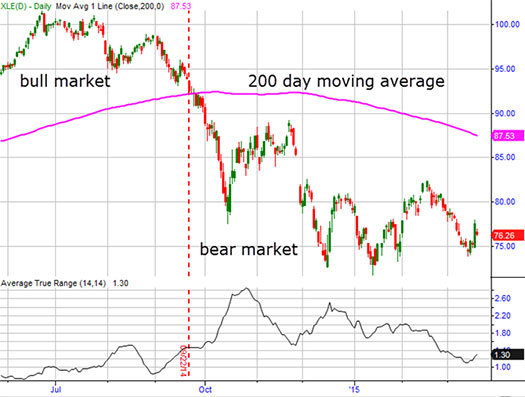
Can you easily judge when markets or sectors are in bull market types vs. bear market types? It can be as simple as looking at prices in relation to the 200 day moving average. For example, in July and August of 2014, XLE, an energy sector ETF was about $100 per share and in bull mode – clearly above the 200 day MA. In late September, the market type changed over to bear with XLE in the low $90s. And at the present time, XLE is still in a bear market, with prices in the mid- $70’s.
Of course, there are a number of other methods for determining the various market types. In the Trading in a Bear Market workshop, we provide several other more sophisticated ways to determine when a market type has changed to bear.
The more pressing question for traders, however, is once you figure out that a market or sector is in bear mode, what should you do? Actually, the answer is “It depends.” Bear markets typically have three stages to them – and different kinds of systems tend to work best in each stage.
The initial stage occurs when the market first moves from bull or sideways to bear. As the bear market begins, it's time to shift from trading systems designed for bull or sideways markets into trading systems designed for bear markets. Continuing to trade the same strategies or systems that work well in bull market conditions could lead to disaster once the market type shifts.
For example, assume you had a portfolio that included energy stocks accumulated during the bull market in energy through 2014. Further, assume that you did not want to sell your energy stocks when the market type changed to bear. You may want to avoid paying taxes on the gains or you may just want to continue collecting dividends. Hedging with put options on XLE or individual energy stocks is a useful strategy and one of several ways to protect your capital.
Maybe you didn't have any capital committed to energy stocks when the bear market arrived. What can you do in this case to benefit from the energy market bear? There are several strategies available. For example, you could short the energy sector with the XLE ETF, or trade from the long side with an inverse energy ETF. Another strategy would be buying put options with the expectation the market will decline.
After the initial stage of a bear market, the second stage is when the majority of the decline occurs and usually corresponds with a measurable increase in volatility. Notice in the XLE chart above how the Average True Range (one measure of volatility) increases significantly as the market declines during the bear market.
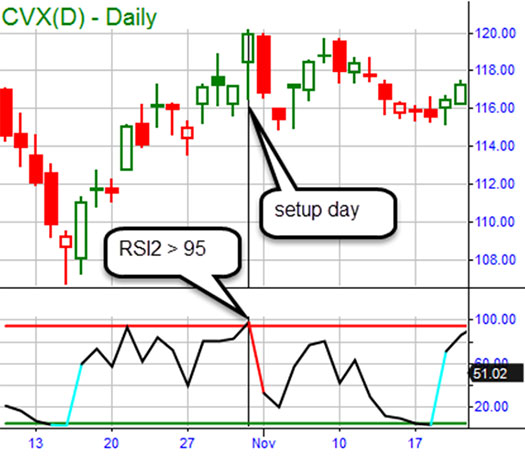
The second stage of the bear market offers plentiful opportunities for trading large intraday moves. One of the trading systems taught in the Trading in a Bear Market workshop is an intraday momentum system. Here's an example of a bear trade from that system in Chevron (CVX).
This chart shows the setup, with a very short term RSI value on a daily chart greater than 95 in a bear market. This provides a short trade opportunity.
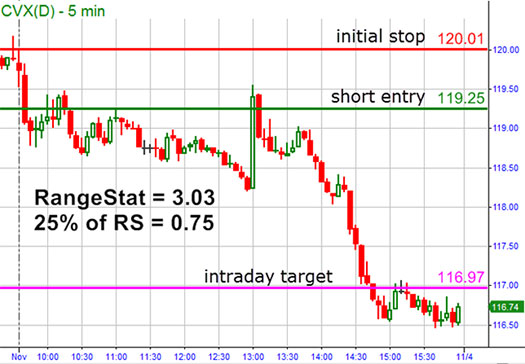
The next chart shows how the short trade played out during the day. The key metric is the RangeStat, which is an average range measurement for the previous 30 days. We then use 25% of the RangeStat as the minimum move from the high of the day to make our short entry. In this case, our entry is at or below 119.25 and our stop is just above the high of the day at 120.01. Our target, based on the high of the day – RangeStat is 116.97. On this trade, the profit was +3R.
The third stage of the bear market happens when prices have bottomed and the market begins to move into sideways mode. As the bear market in energy stocks comes to an end — whenever that turns out to be, the bear market type ending will set the stage for a new bull market. One way to benefit from that shift would be to shift to a strategy of selling put options to collect premium from oversold stocks. Likewise, the bear market should drive down share prices “too far” in at least some of the stocks to the point where they become value stocks. There are several financial metrics for evaluating stocks that are selling at deeply discounted prices compared to their underlying value. Certain financial metrics and some additional rules make up one trading system that profits during the third stage of a bear market.
Not having any market type methodology generally and not understanding the bear market type specifically get a lot of traders into trouble. They tend to keep doing what they did in the bull – at least for a while until the losses mount up and they realize something’s not working. Developing a strong understanding of the bear market type and learning some effective bear trading systems allows knowledgeable traders to profitably trade bear markets where they find them — at the market level or at the sector level. The energy sector is in a bear right now but some other sector(s) will become bearish before the whole market shifts into bear mode.
Are you ready to trade the next sector that turns bearish? How about if the whole market enters bear mode? It’s really not a question of if the next bear will show up, however, but when. You can prepare yourself now.
Watch Mark's short video summarizing the Trading in A Bear Market Workshop.
About the Author: Mark McDowell graduated from the Dr. Tharp’s Super Trader Program and has been profitably trading stocks, futures and options full time for several years now. For the better part of a year, Mark extensively researched bear markets and bear market trading strategies. He shares the results of his research in a three-day workshop, Trading in a Bear Market in which he explains strategies and systems for successfully trading each of the three stages of a bear market. The next Trading in a Bear Market workshop will be held in May at the Van Tharp Institute in Cary, North Carolina.
Workshops
April
Attend all three Peak Performance Workshops back-to-back in April! It may be your best (and only!) opportunity to catch all three of these workshops in the same trip in 2015! |
| Apr 10-12 |
Discount Ends Next Week!
Peak Performance 101
with Dr. Van K. Tharp and co-instructor RJ Hixson |
| Apr 14-17 |
Peak Performance 202
with Dr. Van K. Tharp, Libby Adams and RJ Hixson |
| Apr 19-21 |
Peak Performance 203
with Dr. Van K. Tharp and RJ Hixson |
| May |
| May 1-3 |
Forex Trading Systems
with Gabriel Grammatidis |
| May 4-5 |
Live Forex Trading
with Gabriel Grammatidis |
| May 7-9 |
Trading in A Bear Market
with Mark McDowell |
June |
| June |
Oneness Awakening Weekend
Spend a special weekend with Van Tharp! Our first 2015 Oneness Weekend is coming in June.
Specific dates to be confirmed. |
Combo Discounts available for all back-to-back workshops!
See our workshop page for details.
Trading Tip

What’s Next for the S&P — Up, Down or Sideways?
Three Lines Tell
by D. R. Barton, Jr.
View on-line to resolve formatting problems
In the course of a typical week for me, I speak with traders and investors from every perspective — from hedge fund managers and tech start-up CEOs to newsletter writers and retail investors. Currently, they are all confused to some degree about this market and what it wants to do. With little consensus, there are as many opinions and analyses as there are traders. And little wonder.
On Tuesday, 3/24, the market closed within one S&P 500 cash index point of its 12/29/14 close. Since 12/29/14, the S&P has been down and up, up and down again. And yet, we’re only one and a half daily ranges from all-time highs.
The longish-term monthly bar chart below tells a story of bull market that has been in an upward channel since the 2012 presidential elections (except for the tail of the October 2014 bar).
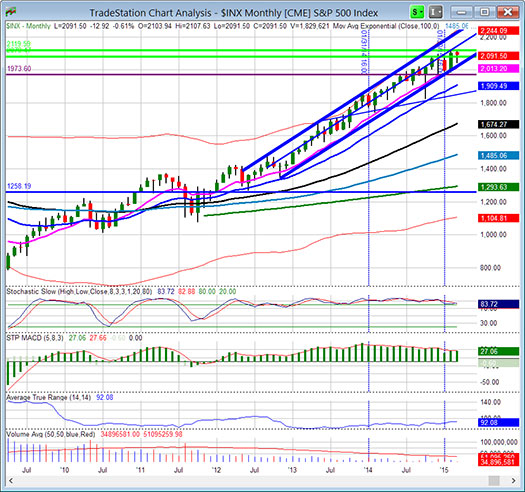
For a larger image CLICK HERE.
We could even extend that lower channel trend line all the way back to the 4th quarter of 2011.
So a long-term trend follower would rightfully tell us that we’re in the middle of a channel in a long-term trend and there is really isn’t much to talk about here except whether we test the upper channel boundary first making new all-time highs or first retreat back to test the lower channel. Testing the lower channel would mean revisiting the March lows which are more than 50 S&P points below Tuesday’s close.
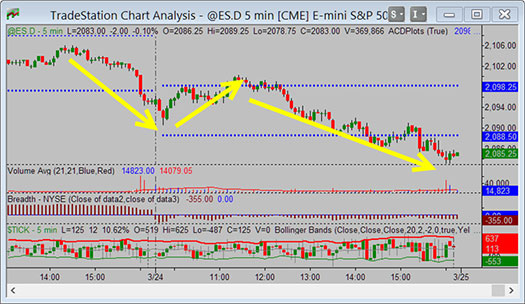
On the other hand, short-term intraday traders have been watching a normal ebb and flow of prices on the five minute charts. Prices bounced off Monday’s high (about 5 points below the all-time highs) and are now approaching an important longer-term support in the 2080 range. See the recent 5 minute bar chart below.
Most Chart Readers’ World: the Daily Chart & Three Lines That Matter
Ah, but then there’s the daily chart - the intermediate time-frame where most chartists live. It would be a strange day if I didn’t look at this chart a half dozen times for perspective. I’ve removed several indicators from my normal daily bar chart to focus on three lines that stand out.
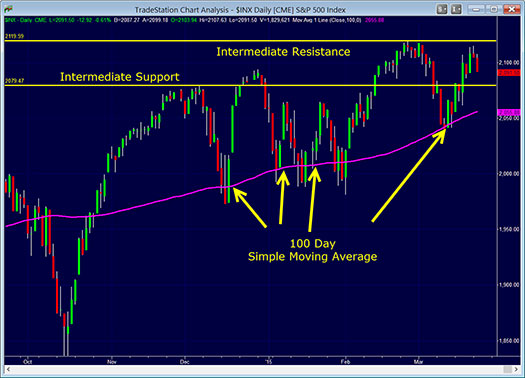
From top to bottom, the three lines are:
| 1. |
|
The all-time high that marks resistance at 2120. |
| 2. |
|
The intermediate sideways channel support at 2080 which has been touched several times and includes a previous all-time high mark. |
| 3. |
|
“Real” support formed by the 100 day SMA which has been broken only once since the 2012 presidential elections. |
In reality, the market movement is pretty simple to explain. New all-time highs are resisting further action to the upside for at least about a month. The first support level is at the 2080 zone. (Interesting note — I drew this line on this chart in late February! It is once again containing / retraining the action.) And finally the 100 day SMA will continue to be an important support level until it broken decisively one or two more times.
Probabilities point to traders needing to hunker down. We are looking at a grinding sideways market with an upper bias until these important lines are violated.
At times, the game can be pretty simple - even if only for a short while!
Your thoughts and comments are welcomed - please send them to drbarton “at” vantharp.com. I always enjoy hearing from our readers!
Great Trading,
D. R.
About the Author: A passion for the systematic approach to the markets and lifelong love of teaching and learning have propelled D.R. Barton, Jr. to the top of the investment and trading arena. He is a regularly featured analyst on Fox Business’ Varney & Co. TV show (catch him most Thursdays between 12:30 and 12:45), on Bloomberg Radio Taking Stock and MarketWatch’s Money Life Show. He is also a frequent guest analyst on CNBC’s Closing Bell, WTOP News Radio in Washington, D.C., and has been a guest on China Central Television - America and Canada’s Business News Network. His articles have appeared on SmartMoney.com MarketWatch.com and Financial Advisor magazine. You may contact D.R. at "drbarton" at "vantharp.com".
Q & A
Is the Peak Performance 101 Workshop Right for Me?
Q: I am a new trader and I wonder if the Peak Performance 101 Workshop is right for me?
A: Dr. Tharp is keen on inspiring transformation in as many people as possible, by using the trading metaphor. Transformation in this context deals with the psychology behind why we do the things we do, which were imbedded in the psyche at different points in our history. From very early on, we are influenced by our parents and loved ones, later on we are influenced by our teachers and peers, later on, our bosses, and so on.
Through these relationships with others, we adopt certain beliefs, and tuck them into our "tool belt" for helping us throughout our lives. Some of these beliefs are useful, but sometimes a belief that was useful in the past is no longer useful. And yet, we still hang onto those beliefs!
The Peak Performance 101 Workshop provides a strong psychological foundation for multiple levels of transformation. It helps participants examine their beliefs and discern if these beliefs are useful – both for life and for trading.
Matrix Contest
 Enter the Matrix Contest
for a chance to win a free workshop!
We want to hear about the one most profound insight that you got from reading Van's new book, Trading Beyond the Matrix, and how it has impacted your life. If you would like to enter, send an email to [email protected].
If you haven't purchased Trading Beyond the Matrix yet, click here.
For more information about the contest, click here.
Ask Van...
Everything we do here at the Van Tharp Institute is focused on helping you improve as a trader and investor. Consequently, we love to get your feedback, both positive and negative!
Send comments or ask Van a question by clicking here.
Also, Click here to take our quick, 6-question survey.
Back to Top
Contact Us
Email us at [email protected]
The Van Tharp Institute does not support spamming in any way, shape or form. This is a subscription based newsletter.
To change your e-mail Address, e-mail us at [email protected].
To stop your subscription, click on the "unsubscribe" link at the bottom left-hand corner of this email.
How are we doing? Give us your feedback! Click here to take our quick survey.
Call us at: 800-385-4486 * 919-466-0043 * Fax 919-466-0408
SQN® and the System Quality Number® are registered trademarks of the Van Tharp Institute and the International Institute of Trading Mastery, Inc.
Be sure to check us out on Facebook and Twitter!


Back to Top


