Tharp's Thoughts Weekly Newsletter
-
Article:
A Regression Line Crossover Visualization Exercise, by Ken Long
-
Workshops: March has two locations: Cary, NC and Sydney, Australia
-
Tip: Rate Hikes Are Coming
- Time To Bail Out of Stocks?
by D.R. Barton, Jr.
-
Video: Did You Miss Ken Long's Latest Trading Video?
The Peak Performance 101 workshop has been the core of Van Tharp's instruction for 25 years.
 Join Van Tharp in Sydney, Australia for this life-changing workshop! Join Van Tharp in Sydney, Australia for this life-changing workshop!
Plus, Dr. Tharp will be presenting his new Mental Strategies workshop and his Blueprint for Trading Success.
Read below for more information
Check the combo discounts if you would like to attend more than one Sydney event.

A Regression Line Crossover Visualization Exercise
by Ken Long
Click to view in browser for better formatting
(Click here to see a larger version.)
On Feb. 5, a trading opportunity in oil concluded and it offered an excellent learning opportunity for our chatroom members as well as anyone else willing to do a little work and who might have an open mind.
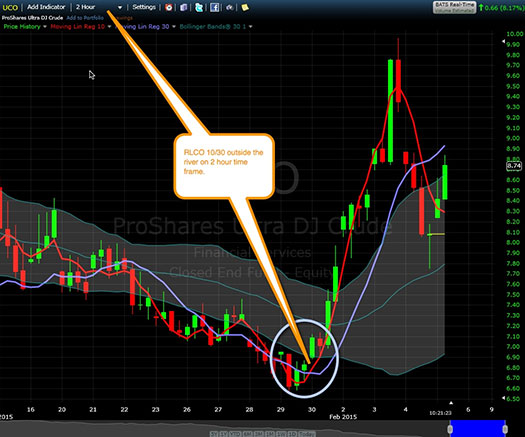
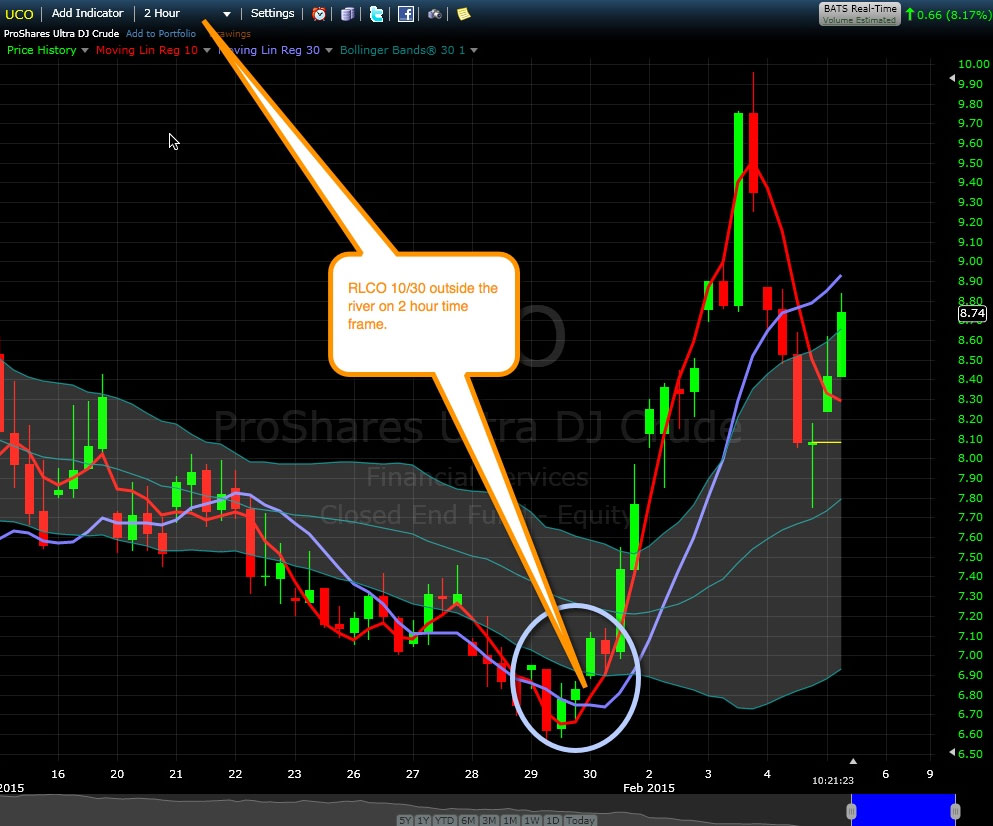
The regression line crossover strategy (RLCO) strategy uses a total of three indicators. There are two regression lines, one of 10 periods (red line above) and the other of 30 periods (blue). The strategy also uses a shaded-in (gray) set of Bollinger Bands based on 30 periods and 1 standard deviation.
We use 2 hour candles for swing trading with a 10 day look-back period providing context for swing trades. It is our standard practice to consider "market condition" (or “market type” as Van says) as part of our evaluation of the current reward: risk ratio on a trade.
Here’s the visualization exercise:
There are four 2-hour candles in each trading day. A 10 day look-back period contains the price information that is significant to swing traders whose trading decisions have a direct impact on the intra-day price action. There are forty 2-hour candles in each 10-day look-back period. That gives us enough data points to use descriptive statistics to identify critical states. We define a critical state as an extreme price location relative to recent price action. It is our belief and our operational assumption that from extreme conditions come extreme results. We notice that when price makes an extreme (abnormal) move, the price action that follows is also quite often extreme. This creates a short term trending movement until price gets back to a “normal” (relatively speaking) location. We use statistics to describe the difference between normal and extreme conditions. We also use statistics to generate our adaptive entry and exit signals (based on the statistics for the recent price action).
In the oil chart above (using UCO, an oil based ETF), we have zoomed in on a section of a 2-hour chart. We can see that oil made an extreme move to the downside and then began a retracement on January 29-30. We use moving regression lines to smooth price action and generate signals in such extreme moments or "critical states". Because the shorter term regression line crossed over the longer term line outside of the normal price region (defined by Bollinger Bands), we have a signal to enter with a capital preservation stop set below the recent swing low. Soon afterwards, there follows a strong price trend to the upside which culminates in a large range green candle, followed by a sharp retracement. Our exit is based on profit preservation and can occur anywhere north of the "normal price region" as defined by the Bollinger Bands.
We reset our emotional state by taking a quick cleansing breath and clapping our hands very sharply two times to get quickly back to the "Zero state". As we feel the tingling in our hands and our minds calmed by the deep breath, we resume stalking our next opportunity as framed by our adaptive indicators. We can feel the confidence which comes from knowing we will get many opportunities just like this every day and that we don't have to be perfect on any one of them, just good enough on some of them to create a sustainable positive expectancy system.
Here are the steps:
| 1. |
|
Record yourself reading the 3 paragraphs above (starting with “There are four each . . .). |
| 2. |
|
Then using a timer set for 30 seconds, call up the chart and just look at it for 30 seconds without thinking. |
| 3. |
|
Now play the recording of your voice reading the script as you continue to look at the whole chart with a quiet, relaxed "sticky" mind. |
| 4. |
|
Take a 10 second break and then listen to the recording one more time while looking at the chart in your calm state of mind. |
| 5. |
|
Take a break and get up to walk around for one minute. |
| 6. |
|
Come back to the chart, look at it for a minute and listen to the words you hear in your head. |
| 7. |
|
Observe your physical, emotional and mental responses to this exercise and note the things you find interesting about the exercise. |
| 8. |
|
Summarize your experience of the exercise by writing a one paragraph description. |
| 9. |
|
Once you have recorded the experience, reflect on your paragraph in writing, what that information means, and what you might do with it. |
| 10. |
|
Optional bonus step – share the summary paragraph and your reflection about it with someone you know. |
About the Author: Dr. Ken Long retired from the Army as a Lieutenant Colonel and teaches at the U.S. Army Staff College. He is a proud father of three, a husband, teacher, student, martial artist and active trader. Ken also instructs dynamic trading workshops for the Van Tharp Institute.
Ken's next workshop is just around the corner, Day Trading Systems in March. Watch this video to hear two testimonials from students of Ken Long.
Workshops
Combo Discounts available for all back-to-back workshops!
See our workshop page for details.
Trading Tip

Rate Hikes Are Coming
Time To Bail Out of Stocks?
by D. R. Barton, Jr.
View in browser
There are countless vignettes in real life and in the media where a little kid is about to receive a shot of some kind of medicine and the child worries and worries over how much it will hurt. Tears are shed. Words of comfort are offered. More tears.
Then the shot happens and in the aftermath, we hear ubiquitous response, “Now that wasn’t so bad, was it?”
It seems like the collective mindset of stock market participants today is much like the little kid in the waiting room only in this case, the doctor getting ready to administer the “medicine” is Janet Yellen (a “Dr.” in real life) and the medicine that the economy needs is a rate hike. More precisely, a series of rate hikes has been prescribed.
The markets are dreading this first serious act of monetary tightening. What happens lately with every little piece of news that comes out? Regardless of whether there’s a piece about the economy, earnings, global machinations (the Ukraine, China, the Middle East, Greece), pundits, analysts, investors, and traders – everyone couches the news in terms of whether or not it will cause the Fed to raise rates sooner rather than later. The collective mindset seems to be “It’s going to be bad”.
Recent history, however, has shown us that after a period of easing, the first rate hike caused “just a little pinprick” (to borrow from Pink Floyd) in the stock market which has then been followed by more upside.
So maybe we shouldn’t be so worried about (or obsessed over) the coming rate hike. Let’s look at some great data from a Deutsche Bank (DB) special report and relayed by Sam Ro over at Business Insider.
What Happens to Stocks Before and After the First Rate Hike?
DB looked at what happened the last seven times the Fed went from a posture of easing to the first rate hike. The first chart shows three initial rate hikes in the 1980’s:
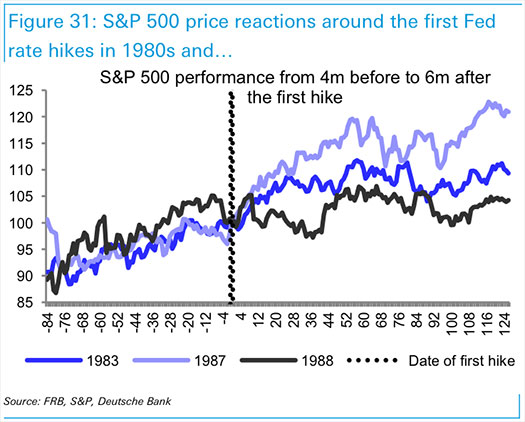
In general, we can see that the market ran up during the four months leading up to the rate hike, had a pullback that lasted days or week immediately after the hike and then resumed the upward climb. A similar but clearer picture of this pattern plays out for the rate four “first time” rate hikes that hit in the 1994 – 2004 time frame:
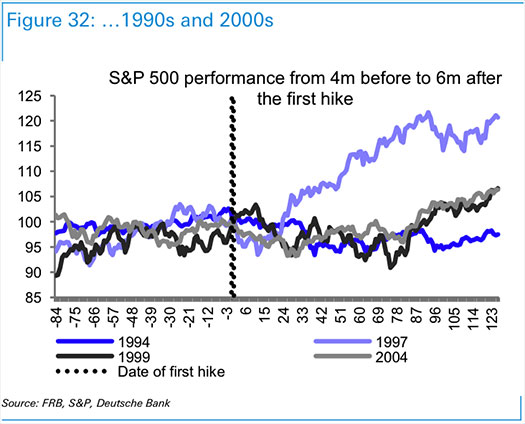
Only once (1994) out of seven times did the market fail to make new highs within six months of the rate hike.
If we stop for a moment and use just a little bit of common sense, this all appears quite logical. The Fed hikes rates in the first place because the economy (and therefore the equities markets) are doing well enough that the Fed discerns the need to slow it. The first rate hike sets that markets back temporarily but is not enough to slow down the momentum that has been building for quite some time. Actually slowing the economy usually takes multiple rate hikes so after an initial pullback, the market then soldiers on to new highs reflecting the underlying strength of the economy.
Here is a composite of all seven occurrences:
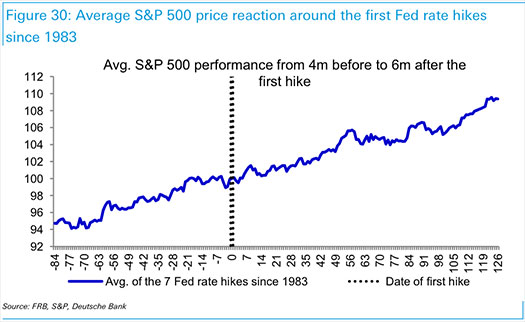
So whether the coming monetary tightening cycle starts in a month (unlikely), a quarter (more probable) or in the next 12 months (almost a certainty) -- the pattern of run-up, pullback, and then new highs is the highest probability outcome based on history. My friend Steve Sjuggerud calculated that the average pullback for the three major tightening cycles (1994, 1999 and 2004) was only 7%.
So maybe when that the market gets that “shot” of an interest rate hike finally, we should do less squirming and more relaxing because we already know that “It’s not going to that bad …”
Your thoughts and comments are always welcome. Have any new improved or “hidden gem” stock/commodity/financial websites caught your eye? Drop me a note! Please send them to drbarton “at” vantharp.com
Great Trading,
D. R.
About the Author: A passion for the systematic approach to the markets and lifelong love of teaching and learning have propelled D.R. Barton, Jr. to the top of the investment and trading arena. He is a regularly featured analyst on Fox Business’ Varney & Co. TV show (catch him most Thursdays between 12:30 and 12:45), on Bloomberg Radio Taking Stock and MarketWatch’s Money Life Show. He is also a frequent guest analyst on CNBC’s Closing Bell, WTOP News Radio in Washington, D.C., and has been a guest on China Central Television - America and Canada’s Business News Network. His articles have appeared on SmartMoney.com MarketWatch.com and Financial Advisor magazine. You may contact D.R. at "drbarton" at "vantharp.com".
Video
Join Ken Long in Just A Few Weeks for His Dynamic Day Trading Systems Workshop! $700 Discount Expires Soon.
One setup, for multiple trades: In this 16 minute video, Ken Long explains a series of trades he took over the last two days using a number of his market methodologies. First, he gives a thorough review of his overall market health check chart, then provides a swing trade setup, and finally shows how a specific chart pattern offered a low risk opportunity. You can see and hear how these different elements fit together for a profitable day trade on February 2 that then evolved into a swing trade overnight. Then, on February 3, he closed the swing trade while the chart revealed another RLCO intra-day trade opportunity in the opposite direction.
Join Ken in 6 weeks for his popular Day Trading Workshop, followed by two days of live trading. Click here to learn more.
To register or to see our full workshop schedule, click here.
 Enter the Matrix Contest Enter the Matrix Contest
for a chance to win a free workshop!
We want to hear about the one most profound insight that you got from reading Van's new book, Trading Beyond the Matrix, and how it has impacted your life. If you would like to enter, send an email to [email protected].
If you haven't purchased Trading Beyond the Matrix yet, click here.
For more information about the contest, click here.
Ask Van...
Everything we do here at the Van Tharp Institute is focused on helping you improve as a trader and investor. Consequently, we love to get your feedback, both positive and negative!
Send comments or ask Van a question by clicking here.
Also, Click here to take our quick, 6-question survey.
Back to Top
Contact Us
Email us at [email protected]
The Van Tharp Institute does not support spamming in any way, shape or form. This is a subscription based newsletter.
To change your e-mail Address, e-mail us at [email protected].
To stop your subscription, click on the "unsubscribe" link at the bottom left-hand corner of this email.
How are we doing? Give us your feedback! Click here to take our quick survey.
Call us at: 800-385-4486 * 919-466-0043 * Fax 919-466-0408
SQN® and the System Quality Number® are registered trademarks of the Van Tharp Institute and the International Institute of Trading Mastery, Inc.
Be sure to check us out on Facebook and Twitter!
 
Back to Top |
|
February 11, 2015 #720

Our Mission
Van's Top-Twelve Favorite Trading Books
Yahoo and Gmail Users:
Viewing on-line eliminates spacing, and formatting problems that may be unique to your email program.
Ongoing Contest: Learn how you could win a $50 coupon and a grand prize of a free workshop!

"I base my long-term, monthly rebalancing [core] strategies on research into relative strength and momentum as it relates to broad asset classes."-K Long

A Must Read for All Traders
Super Trader
How are we doing?
Give us your feedback!
Click here to take our quick survey.
From our reader survey...
"I think the newsletter is extremely generous and it is a resource I utilize constantly. I have saved every single one since I first subscribed."
Trouble viewing this issue?
View Online. »
Tharp Concepts Explained...
-
Trading Psychology
-
System Development
-
Risk and R-Multiples
-
Position Sizing
-
Expectancy
-
Business Planning
Learn the concepts...
Read what Van says about the mission of his training institute.
The Position Sizing Game Version 4.0
Have you figured out yet how to pick the right stocks? Are you still looking for a high win-rate trading system? When you’re ready to get serious about your trader education, download the Position Sizing Game to learn some true fundamentals of trading success. Learn more.
To Download for Free or Upgrade Click Here

Download the first three levels of Version 4.0 for free.
Register now. »
Trouble viewing this issue?
View Online. »

Dr. Tharp is on Facebook

Follow Van through
Twitter »

Check out our home study materials, e-learning courses, and best-selling books.
Click here for products and pricing
What kind of Trader Are You? Click below to take the test.
Tharp Trader Test
Back to Top

Introduction to Position Sizing™ Strategies
E-Learning Course
Perfect for auditory/visual learners who learn more effectively from an instructional format that is full of interactive features!
Only $149
Learn More
Buy Now
SQN® and the System Quality Number® are registered trademarks of the Van Tharp Institute
|