Tharp's Thoughts Weekly Newsletter
-
Article:
2015 Investment Outlook: From Polarization to Divergence
By Francesco Maggioni
-
Workshops: Discounts Expire Today on January Workshops (Held Only Once Each Year in the U.S.)
-
Tip: Oil Still on a Slippery Slope:
One Chart and One Graph Tell the Story
by D. R. Barton, Jr.
$700 Discounts Expire Today!
Next weekend we will be presenting two of our Foundation Workshops. Van calls these "Foundation" workshops because they provide essential material that you must master to become a great trader.
Many of the seats in these workshops are already spoken for by Super Traders, but we still have open seats at the discount.
The Blueprint for Trading Success workshop is a complete structured program that will launch you into a more advanced skill level in your trading. You’ll learn seventeen focused, strategic steps that will help you create the kind of trading results you want. We regularly hear from students that they know planning is important but they’re not sure where to start and in some cases, they don’t even know what a trading business plan should look like. Hint – it should not look like a “typical“ business plan. You’ll leave this workshop with a template in hand to guide your trading business’s development and your personal growth as a trader.
In the How to Develop a Winning Trading System workshop, we'll teach you one of the real secrets of long-term trading success — how to design or modify trading systems so they fit your beliefs, personality, and resources. Learn all of the building blocks and processes for putting them together into robust systems that can trade stocks, futures, currencies, or options. The objective is to develop a system that specifically fits you, whether you want to make 50 trades per year or 50 trades per day.
By the end of this workshop, you will be thoroughly prepared to develop systems that allow you to easily adjust to changes in the markets, or in your personal circumstances.
To register or to see our full workshop schedule, click here.
Article
2015 Investment Outlook:
From Polarization to Divergence
by Francesco Maggioni
View in browser
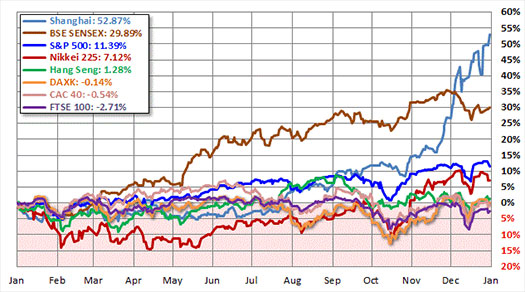
Figure 1: chart showing the 2014 performance of major world stock indexes. Source: dshort.com
Summary
From the viewpoint of what seemed possible in January 2014, it’s a little hard to believe that the year turned out even better than the 2013. Central banks worldwide played a key role in how the asset classes performed in the last twelve months.
We have recently, however, entered a slightly different environment. The period that started around October marked the end of the Federal Reserve’s QE (Quantitative Easing) and marked the increase of the Japanese QE. Meanwhile, the Bank of England and the SNB (Swiss National Bank) have no changes planned while the ECB announced its intention to boost its balance sheet up to another one trillion euros.
Lastly, the very recent fall in price of oil is causing turmoil in Russia where the Central bank has been trying to defend its currency in the last few weeks. Since the end of the American QE there has been a substantial increase in interventions by other Central Banks. This factor alone will cause asset classes to behave differently in 2015 compared to 2014.
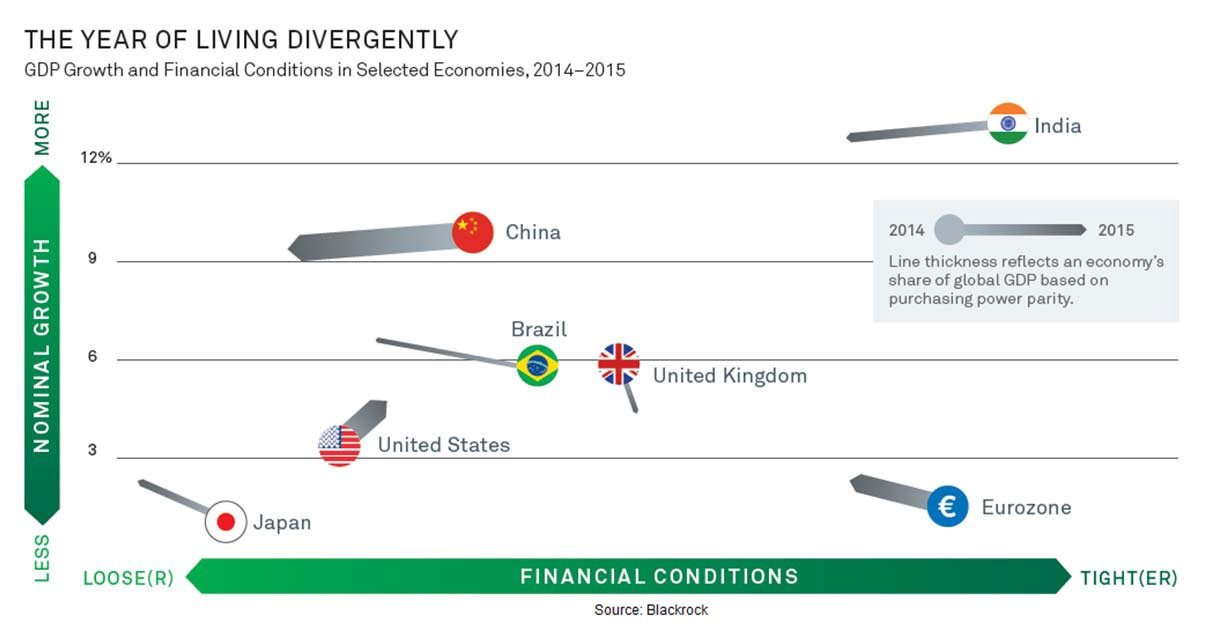
Actions of Central Banks are also a reflection of how the respective economies are marching so far. The end of QE in the US is the result of strong economic recovery tied to fall in unemployment rates to pre-GFC levels. In other economies, the start or increase of QE programs signals they are in need of extra help. The chart below illustrates exactly what I am referring to: Central Bank actions in relation to potential GDP growth prospects.
 (Click here to see a larger version of this chart.)
Figure 2: Chart showing possible move in GDP and financial conditions for main economies
From Polarization to Divergence
Since 2009, we have basically experienced a period of polarization. Before that year in various aspects of life, there was fragmentation, a number of different providers. I’m referring to banks or suppliers in general and performance contributors too. As an example, let’s just take the number of banks in the US pre 2009: that number has dramatically decreased since.
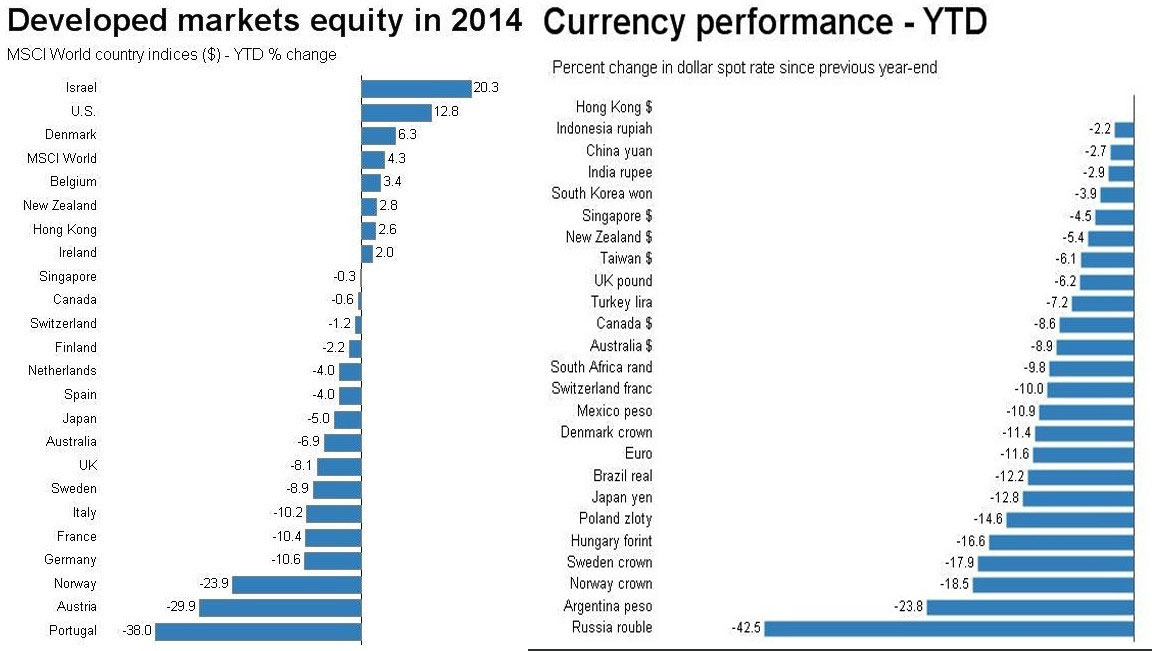
At the same time, number of performance contributors for investors decreased likewise. There hasn’t been much choice about where to put money in the last twelve or twenty-four months especially. The crowded trades have been in US and EU Bonds, US Equities and German Equities, and in a more tactical way even equities of peripheral Europe. The chart above presents the 2014 winners - the Shanghai and Indian equities even though those are still in the Emerging Market sphere.
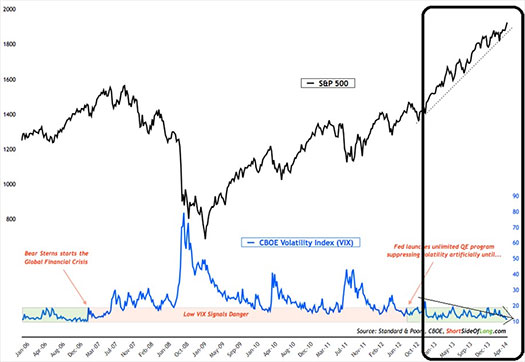
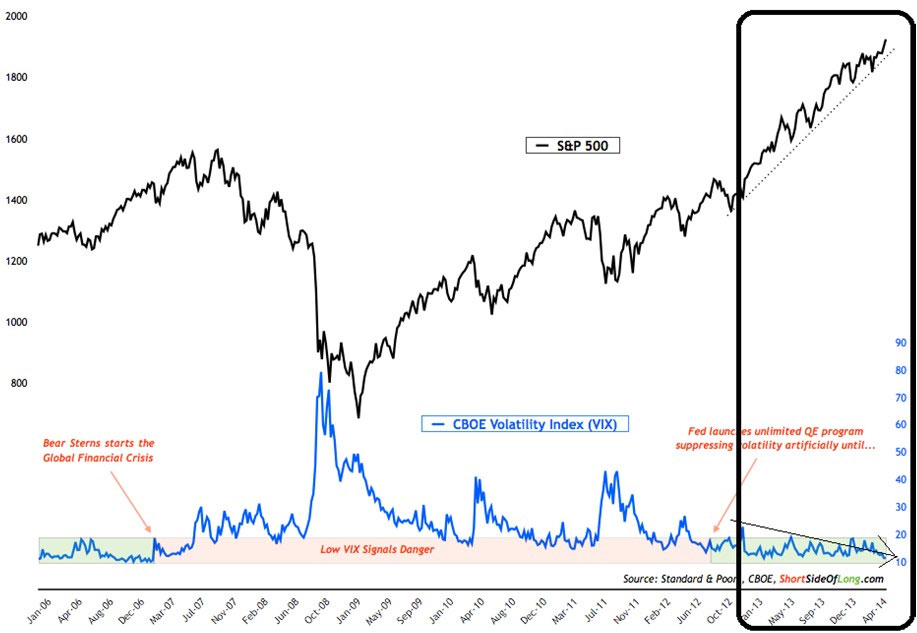
To give an idea about the primary trades investors (and the Fed) crowded into in 2014, here’s a chart graphing the S&P 500 and the VIX (volatility index).
 (Click here to see a larger version of this chart.)
Figure 3: Chart showing Sp500 and VIX
In the most generally accepted explanation for the index, the VIX tends to be the inverse of the S&P 500. If the VIX moves continually lower, that signals there is less selling pressure in the market and primarily buying driving transactions. The chart indicates US equities have been quite a crowded trade.
The same situation can be described for US and EU bonds where yields are starting to enter into negative territory (see December 2014 Bobl issuance, the German 5yr bond).
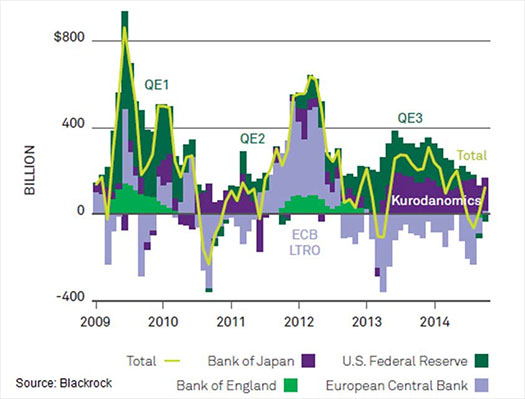
Figure 4: Central Banks interventions
The chart above and shows well the polarization I refer to. In the coming year, however, different actions from Central Banks combined with different economic growth around the world will necessarily bring the asset class divergence that I am expecting.
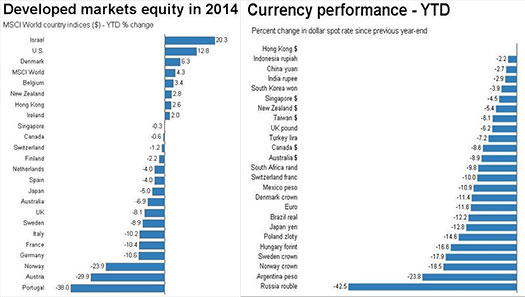
Please find below some data and performances of 2014 which may be useful to have in mind when looking ahead to 2015.
 (Click here to see a larger version of this chart.)
Figure 5: Equities performances in 2014 Figure 6: Currencies performances in 2014
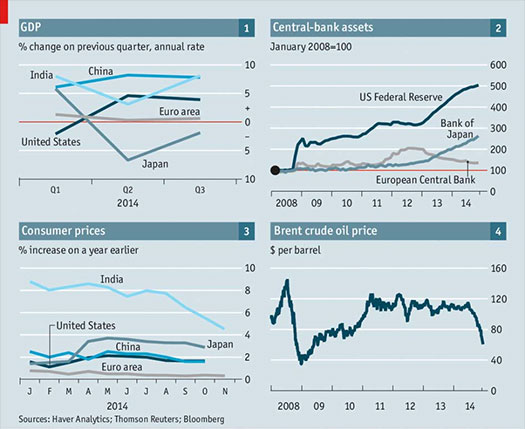
Figure 7: Year 2014 in four charts
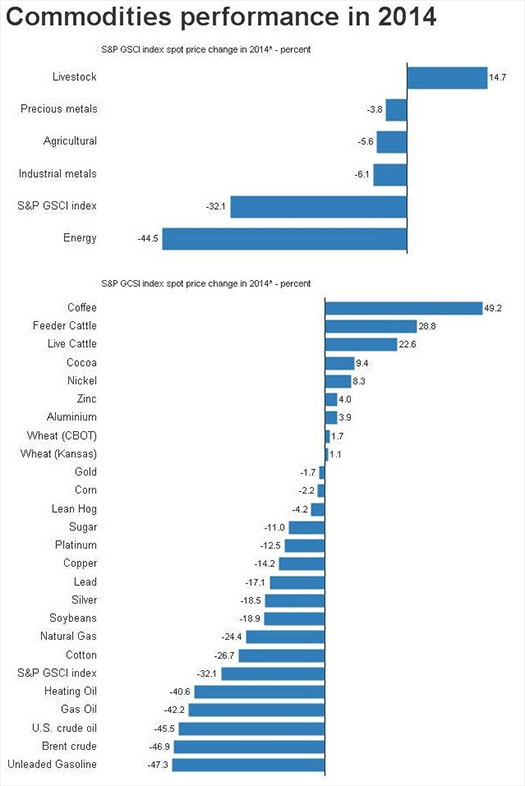
Figure 8: Commodities performances in 2014
THE UNKNOWN UNKNOWNS
| |
|
“There are known knowns; there are things we know we know.
We also know there are known unknowns; that is to say we know there are some things we do not know.
But there are also unknown unknowns -- the ones we don't know we don't know. And if one looks throughout the history of our country and other free countries, it is the latter category that tend to be the difficult ones”

Donald Rumsfield
(Defense Secretary Donald Rumsfield,
February 2002, White House Press Conference) |
Nobody knows the future, and despite what central bankers want us to believe, we live in an era of chaos.
Volatility is at historical low levels, US markets are the historical high levels, so is the general bond market. Those levels will not continue forever so investors should be worried and plan for possible multiple worst case scenarios. Western economies have not solved any of their problems that surfaced in 2009 so things are not as great as we may see them.
Personally I would like to add to the above analysis that the first requirement of any investment: liquidity. Do not take position of any illiquid investment, or at least make it no bigger than 5% of your allocation. You should be able to exit any position in one day at the maximum, or have a hedging strategy in place otherwise. Allocate part of your portfolio for hedging purposes either through outright options or via Inverse ETFs. As Warren Buffet has said: “it is only when the tide leaves that we discover who is swimming naked”.
About the Author: Francesco Maggioni has been working in the financial markets for the last 15 years in different roles at tier 1 consulting companies and banks worldwide. In recent years his research has been focused on the psycho-emotional aspects of trading. Francesco holds an MBA from IUM and a Portfolio Management degree from the University of Chicago GSB. This article was excerpted from his full 2015 Outlook report found on http://www.francescomaggioni.com
Workshops
Combo Discounts available for all back-to-back workshops!
See our workshop page for details.
Trading Tip

Still on a Slippery Slope:
One Chart and One Graph Tell the Oil Story
by D. R. Barton, Jr.
Click to view in browser for correct formatting
The falling price of crude oil has been one of the biggest financial news stories of the last six months.
Of course oil prices have a big impact on producers and consumers but let’s put some numbers to that proposition. In a Goldman Sachs report, David Kostin notes data from the U.S. Bureau of Economic Analysis that shows energy input costs make up more than 2% of U.S. private industry gross revenues. And in their February 2013 report, when gasoline was averaging $3.70, the Energy Information Administration showed that the average household spent $2,912 per year on gasoline, or a whopping 4% of pretax income.
So yeah, oil prices are big deal.
But instead of re-hashing tight-oil production increases in the U.S., Saudi Arabia’s political and economic agendas or the reduced demand growth in Europe and China, let’s look at two powerful graphics. These shine some really interesting light on oil pricing and its broad-reaching effects.
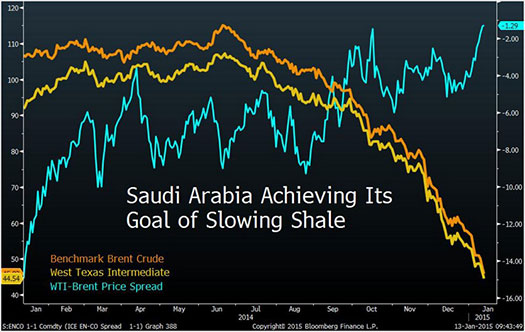
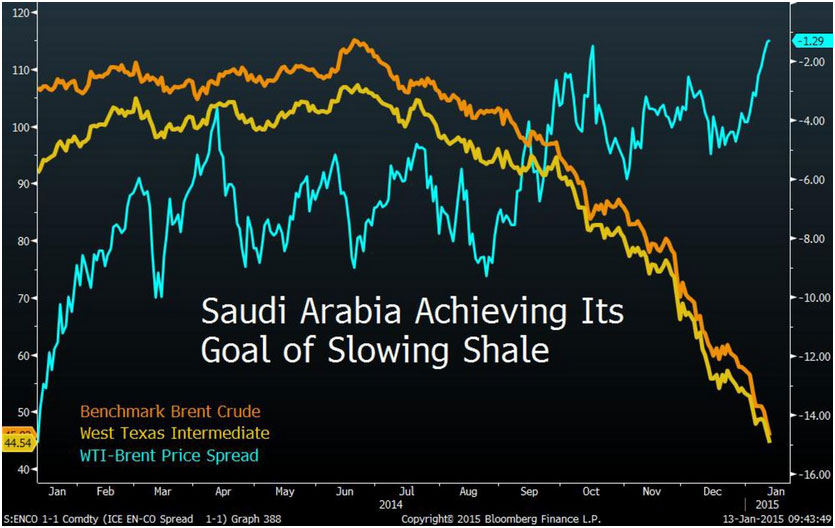
Saudi Arabia’s Agenda Is Working
Here, in one cool chart, we see what Saudi Arabia has been trying to do in keeping their production levels high, despite a global surplus. Take a look at this chart put together by Bloomberg’s Grant Smith. It shows the relationship between West Texas Intermediate (WTI), the U.S. oil grade traded in New York vs. Brent, the international standard that is traded in London:
 (Click here to see a larger version of this chart.)
In this graph, the orange and yellow lines (Brent and WTI price, respectively) have their y-axis scale on the left, and blue line or the amount WTI is trading below Brent is shown on the right-hand scale. As the two benchmark prices converge, the spread decreases (going up on the right hand axis). While $1.28 per barrel is a notable difference, it pales in comparison to the whopping $15.49 spread that existed just one year ago!
So what? Well, when U.S. shale oil was 15% cheaper than the price of Saudi oil, refiners in the U.S. had a strong monetary incentive to buy U.S. oil instead of imported offerings. Saudi Arabia has plainly stated they want to slow the growth of shale oil production in North America. With the spread tightening (now a difference of only about 2.8%), the price advantage for domestic shale oil has dropped significantly.
Bottom in Crude?
How low could oil go? The downside for crude oil prices has so many variables to factor:
| |
• |
Will the oil producing regions remain free of significant conflicts for an extended period? |
| |
• |
Will global demand growth remain tepid or could major economies even contract? |
| |
• |
Will major producers finish capital projects to bring on significant new capacity (Iraq, Libya)? |
| |
• |
Will Iran succeed in normalizing international relations and add even more production capacity after sanctions are lifted? |
| |
• |
Whither goes shale? |
With a foggy crystal ball, it’s tough to balance all of those inputs. But absent a major conflict popping up in an oil producing region, most signs point to increased supply growth and neutral to reducing demand growth. That equals crude prices remaining at lower levels for longer than many have yet to realize.
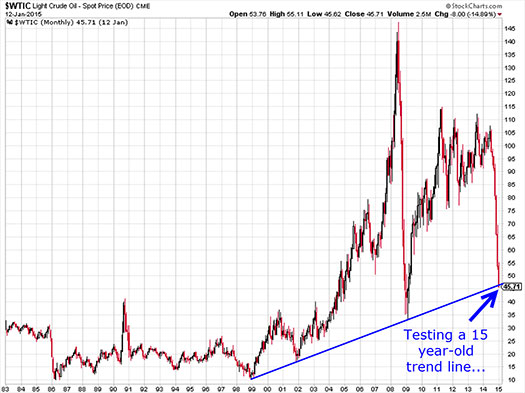
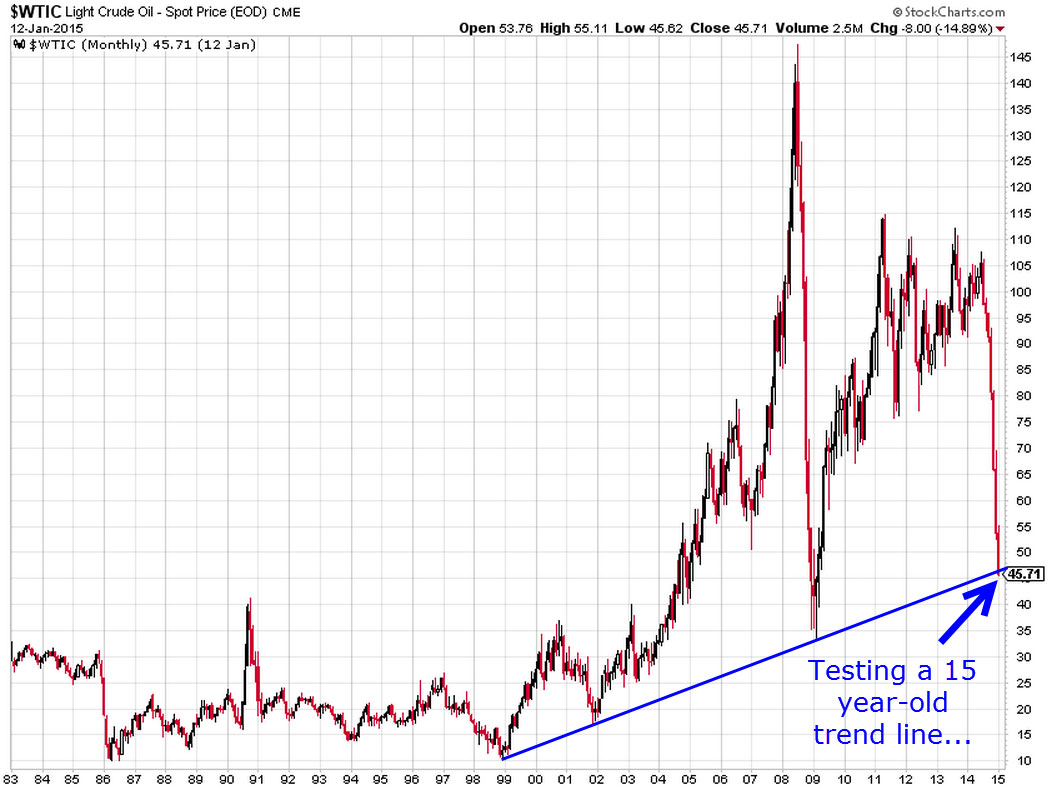
On the technical side, the plunge in crude puts us at a very interesting, very long-term support level. Let’s look at chart of spot crude prices in WTI dating back to 1983:
 (Click here to see a larger version of this chart.)
As you can see, we’re at a very important technical juncture. If the price can’t hold current levels (+/- a dollar or so), then we could soon be talking about oil prices down in the $30s.
At the moment, however, crude is so oversold and so beaten down that a bounce from here is the most likely scenario. But Saudi has the easiest spigot to turn up or down so they could choose to press their advantage for weeks or even months while relying on their huge cash reserves.
Because of the Saudi’s market influence, if you are inclined to find a place to get long any form of a crude play, don’t try to catch the falling knife. Wait for confirmation (even significant confirmation) before getting involved on the long side.
Your thoughts and comments are always welcome - please send them to drbarton “at” vantharp.com
Great Trading,
D. R.
About the Author: A passion for the systematic approach to the markets and lifelong love of teaching and learning have propelled D.R. Barton, Jr. to the top of the investment and trading arena. He is a regularly featured guest on both Report on Business TV, and WTOP News Radio in Washington, D.C., and has been a guest on Bloomberg Radio. His articles have appeared on SmartMoney.com and Financial Advisor magazine. You may contact D.R. at "drbarton" at "vantharp.com".
 Enter the Matrix Contest Enter the Matrix Contest
for a chance to win a free workshop!
We want to hear about the one most profound insight that you got from reading Van's new book, Trading Beyond the Matrix, and how it has impacted your life. If you would like to enter, send an email to [email protected].
If you haven't purchased Trading Beyond the Matrix yet, click here.
For more information about the contest, click here.
Ask Van...
Everything we do here at the Van Tharp Institute is focused on helping you improve as a trader and investor. Consequently, we love to get your feedback, both positive and negative!
Send comments or ask Van a question by clicking here.
Also, Click here to take our quick, 6-question survey.
Back to Top
Contact Us
Email us at [email protected]
The Van Tharp Institute does not support spamming in any way, shape or form. This is a subscription based newsletter.
To change your e-mail Address, e-mail us at [email protected].
To stop your subscription, click on the "unsubscribe" link at the bottom left-hand corner of this email.
How are we doing? Give us your feedback! Click here to take our quick survey.
Call us at: 800-385-4486 * 919-466-0043 * Fax 919-466-0408
SQN® and the System Quality Number® are registered trademarks of the Van Tharp Institute and the International Institute of Trading Mastery, Inc.
Be sure to check us out on Facebook and Twitter!
 
Back to Top |


