Tharp's Thoughts Weekly Newsletter (View On-Line)
-
Article November 2014 Market Update by Van K. Tharp, Ph.D.
-
Workshops Forex and Bear Market Workshops Just Added for May 2015
-
Trading Tip November 2014 SQN Report by Van K. Tharp, Ph.D.
-
Video Low-Risk Opportunity Generates +6R by Gabriel Grammatidis
-
Are You Ready to Take Your Trading to the Next Level?
In January, we will be presenting two of our Foundation Workshops at our offices in Cary, NC. Van calls these "Foundation" workshops because they provide certain core material that you must master to become a great trader.
The Blueprint for Trading Success workshop is a complete structured program that will launch you to a more advanced skill level in your trading. You’ll learn seventeen strategic, focused steps that will help you create the kind of trading results you want. We regularly hear from students that they know planning is important but they’re not sure where to start and in some cases, they don’t even know what a trading business plan should look like. Hint – it should not look like a “typical“ business plan. You’ll leave this workshop with a template in hand to guide your trading business’s development and your personal growth as a trader.
In the How to Develop a Winning Trading System workshop, we'll teach you one of the real secrets of long term trading success — how to design or modify trading systems so they fit your beliefs, personality, and resources. Learn all of the building blocks and the process for putting them together into robust systems that can trade stocks, futures, currencies, or options and that can make 50 trades per day or 50 trades per year. This workshop thoroughly prepares you to develop systems when you need to adjust to changes in the markets or to changes in your circumstances.
Plus, Just Announced: Forex and Bear Market Workshops in May!
To register or to see our full workshop schedule, click here.
FYI —
In the coming weeks, you might get some emails or web links from us that have a different look and feel than what you are used to seeing. We are experimenting with some new communication ideas so if you get an email from Van or the Van Tharp Institute that looks different, be aware that it could be just our new experimental format. If you ever have a doubt or question about the authenticity of a Van Tharp communication, please feel free to contact us to verify it. Thank you.
Article
November 2014 Market Update:
CLASSIC SIDEWAYS QUIET MARKET
by Van K. Tharp, Ph.D.
I always say that people do not trade the markets; they trade their beliefs about the markets. In that same way, I'd like to point out that these updates reflect my beliefs. If my beliefs and your beliefs are not the same, you may not find them useful. I find the market update information useful for my trading, so I do the work each month and am happy to share that information with my readers.
However, if your beliefs are not similar to mine, then this information may not be useful to you. Thus, if you are inclined to do some sort of intellectual exercise to prove one of my beliefs wrong, simply remember that everyone can usually find lots of evidence to support their beliefs and refute others. Just simply know that I admit that these are my beliefs and that your beliefs might be different.
These monthly updates are in the first issue of Tharp's Thoughts each month. This allows us to get the closing month's data. These updates cover 1) the market type (first mentioned in the April 30, 2008 edition of Tharp's Thoughts), 2) the five week status on each of the major US stock market indices, 3) our four star inflation-deflation model plus John Williams' statistics, and 4) tracking the dollar. I will now report on the strongest and weakest areas of the overall market as a separate SQN™ Report. And that may come out twice a month if there are significant market charges.
Part I: Van Commentary—The Big Picture
Even though there were multiple new all-time highs in November, the 100 day range change % is less than 4%. To me, this is a classic sideways market that could go up, stay the same, or go down. We are also in a period of a strong dollar and deflation - gold and silver are crashing. That’s the big picture in a nutshell.
Debt Clock
The State of the United States |
Month Ending |
National Debt |
Federal Tax Revenue |
Federal Spending |
Trade Deficit |
Debt Per Family |
Unfunded Liabilities |
Taxpayers |
People supported by them |
July 31 2012 |
$15.93 trillion |
$2.364 trillion |
$3.632 trillion |
$810 billion |
$684,405 |
|
|
|
Dec 30 2012 |
$16.42 trillion |
$2.452 trillion |
$3.540 trillion |
$740.7 billion |
$732,086 |
|
|
|
Jul 31 2013 |
$16.89
Trillion |
$2.73
trillion |
$3.535 trillion |
$703 billion |
$748,458 |
Unfunded Liabilities |
115.2 million |
109.9
95.4% |
Dec 31 2013 |
$17.27 trillion |
$2,82 trillion |
$3,480 trillion |
$692 billion |
$751,294 |
$127.2 trillion |
115.0 million |
108.5M
94.3% |
Jan 31 2014 |
$17.32 trillion |
$2.84 trillion |
$3.494 trillion |
$676 billion |
$752,026 |
$127.7 trillion |
115.2 million |
108.8M
94.4% |
Feb 28 2014 |
$17.38 trillion |
$2.86 trillion |
$3.503 trillion |
$683 billion |
$752,554 |
$128.1 trillion |
115.4 million |
108.4M
93.9% |
Mar 31 2014 |
$17.57 trillion |
$2.89 trillion |
$3.519 trillion |
$683 billion |
$758,057 |
$128.6 trillion |
115.6 million |
107.9M
93.3% |
Apr 30 2014 |
$17.51
Trillion |
$2.91 trillion |
$3.528 trillion |
$683 billion |
$758,598 |
$128.9 trillion |
115.8 million |
108.8M
94.0% |
May 31 2014 |
$17.52
Trillion |
$2.93 trillion |
$3.54 trillion |
$689 billion |
$759,341 |
$129.4 trillion |
116.0 million |
104.38M
90.0% |
Jun 30 2014 |
$17.54 trillion |
$2.95 trillion |
$3.51 trillion |
$697 billion |
$757,392 |
$124.8 trillion |
116.1 million |
104.4M
89.9% |
Jul 31 2014 |
$17.61 trillion |
$2.95 trillion |
$3.52 trillion |
$695 billion |
$757,358 |
$119.7 trillion |
116.3 million |
104.8 M
90.1% |
Aug 31 2014 |
$17.70 trillion |
$2.97 trillion |
$3.53 trillion |
$706 billion |
$757,297 |
$118.0
trillion |
116.5 million |
104.5
90.0% |
Sep 30 2014 |
$17.77 trillion |
$2.98 trillion |
$3.53 trillion |
$707 billion |
$730,321 |
$116.3
trillion |
116.7 million |
104.9
90.0% |
Oct 31 2014 |
$17.9 trillion |
$3.05 trillion |
$3.53 trillion |
$703.5 billion |
$729,784 |
$115.4 trillion |
116.9 million |
105.1
89.9% |
Nov 29 2014 |
$18.0 trillion |
$3.07 trillion |
$3.55 trillion |
$710.8 billion |
$729,477 |
$115.7 trillion |
117.1 million |
105.1
89.7% |
The US listing for unfunded liabilities had been going down for five straight months, from $129.4 trillion on May 31st to $115.4 trillion on October 31st. This form of government manipulation has stopped, however, as they now list the figure at $115.7 trillion with most of that being Medicare ($80.3 trillion) and prescription drug liability ($20.2 trillion). Social security unfunded liability is only a little less than our total debt at $15.12 trillion.
Today, our official debt is almost $18 trillion, up from $16.89 trillion in July 2013. So that’s up $1.1 trillion in 16 months. The debt situation remains so bad that the Federal Reserve has had to keep short term interest rates to almost zero and long term rates to very low numbers. Long term, this will have a fatal impact on the U.S. dollar and interest rates have nowhere to go but up. In fact, betting on eventual higher interest rates is about as close to a certain bet (long term) as you could ever make.
The US population is at 319 million with taxpayers standing at 117.08 million. The Boomer retirement wave has begun and retirees now stand at 48 million. Disabled people collecting social security stands at 10.9 million, while food stamp recipients total 46.2 million. That’s 108.4 million people that are supported by the government (or the 117.1 million taxpayers). Actually, I could add 4.4 million federal employees to those people supported by the taxpayers — plus there are 19.8 million state and local employees supported by other taxes.
In reality, about 11.7 million taxpayers pay 90% of U.S. taxes. This means that 11.7 million workers are supporting 108 million other people through the government. In addition, the top 1% of American tax payers pays 40% of the tax bill. Do these numbers add up to you? Do they seem sustainable? Meanwhile, the official number of unemployed is 8.9 million while the actual number of unemployed is 17.8 million. And these numbers are conservative compared with those published by Shadowstats.com which show unemployment at near depression level statistics.
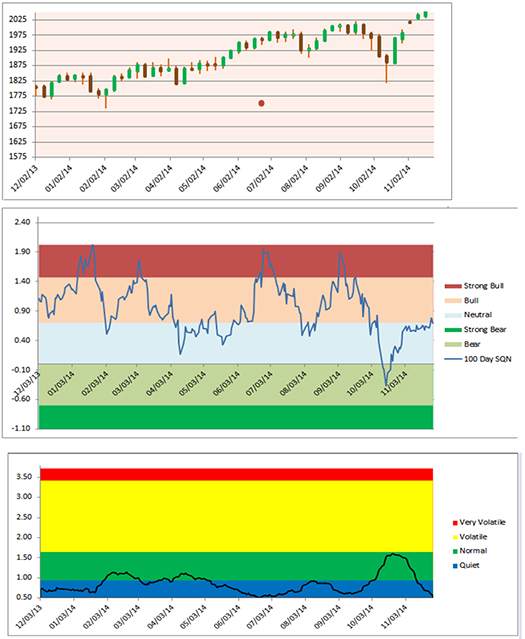
Part II: The Current Stock Market Type Is Neutral Quiet
From October 13th through October 20th, the market crept into Bear Normal territory. On October 21st, it moved back into Neutral where it stayed until November 28th when it moved into Bull Quiet territory for just a day. The 100 day range change % was 4.8%.
As for volatility, it was 1.51% (20 day ATR%) on Oct 31st and by November 28th it was back down to 0.57% — and this is for an S&P 500 that’s up 11.86% on the year.
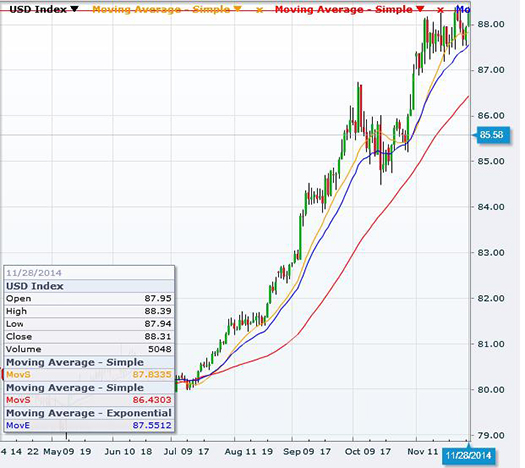
As you know, I look at the Market SQN® score for the daily percent changes in the S&P 500 Index over 200, 100, 50 and 25 days. For our purposes, the S&P 500 Index defines the market. At the November 28th close, the Market SQN® score for the 200 period was Bull. The 100 and 50 day SQN scores were both Neutral. But the Market SQN for the 25 day period was Strong Bull.
The Market SQN 25 said a lot because November was a fairly easy month to make money in the stock market. The change in volatility in November, however, was the most revealing aspect. In last month’s report, we had gotten very close to volatile territory but now we’ve moved back into a very quiet range. The market is thus pretty safe for at least another month. In the meantime, investment advisory services are still screaming doom and gloom.
The charts below include a weekly chart of the S&P 500 over the last year, the Market SQN® score for 100 days, and the percent volatility.
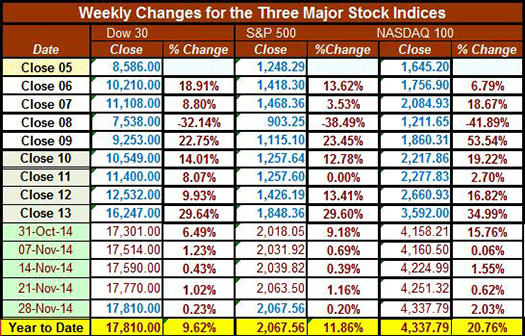
Below is a chart of the weekly changes in the three major US Indices. All three indices are up for the year, but not by much. The S&P 500 is now up 11.86% on the year, while the NASDAQ 100 is up 20.76%. The DOW is only up 9.62% on the year.
Part III: Our Four Star Inflation-Deflation Model
In the simplest terms, inflation means that stuff gets more expensive, and deflation means that stuff gets cheaper. There’s a correlation between the inflation rate and market levels, so the inflation rate can help traders understand big-picture processes.
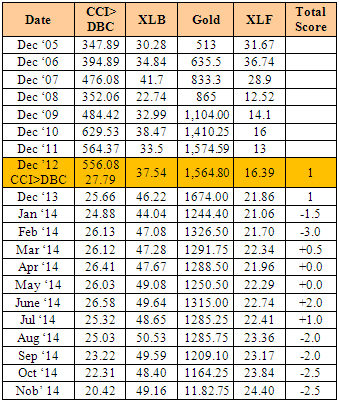
This data is up to date through the end of November. We have had three inflationary months in 2014, two at 0, and the other six months have seen deflation — including the last four months with strong deflation scores. Just look at silver, gold and commodities for confirmation. Looking back over the most recent two-month and six-month periods provides the current month’s score, given in the table below.
Month |
DBC2 |
DBC6 |
XLB2 |
XLB6 |
Gold2 |
Gold6 |
XLF2 |
XLF6 |
Total Score |
|
Lower |
Lower |
Lower |
Higher |
Lower |
Lower |
Higher |
Higher |
|
Nov 14 |
|
-1 |
|
+1/2 |
|
-1 |
|
-1 |
-2.5 |
Part IV: Tracking the Dollar
The US Dollar had a slight correction in October but by the end of the month had reached new highs again. In November, it continued to rise. A lot of money has been made in the US dollar recently over the last few months.
General Comments
At the end of October, everything seemed to be saying we were in a sideways market that could turn bearish. A month later, we’re still in a sideways market (over the last 100 days) but with a strong short term bullish trend. Volatility is way down so sideways to bullish is what we’d expect in the near future. But remember, we are telling you what the market is doing and this is not an attempt to predict the future.
In the meantime, the table below shows the S&P 500 had 12 all-time high closes during the month of November making it the best month of the year by this measure. It’s had 42 all-time high closing days during 2014, so nearly a third of them occurred last month.
Month |
S&P 500 High Closes |
Month |
S&P 500 High Closes |
Nov |
12 |
May |
6 |
Oct |
1 |
Apr |
2 |
Sep |
2 |
Mar |
3 |
Aug |
5 |
Feb |
2 |
Jul |
5 |
Jan |
1 |
Jun |
8 |
Total |
42 |
I have given this prescription for the last few months and I will continue to include this update for at least the rest of the year.
This is my prescription for growth in the US economy. Politicians please read.
1) Kill deficit spending immediately, by stopping wars and spending on what we mistakenly call “defense.” We can’t afford to be the world peace keeper any more. We spend more than a trillion per year on “defense.”
2) Make sure no more deficit spending continues by passing a law calling for a re-election of new politicians any year the government cannot spend within their means. (I heard this first from Warren Buffet and borrowed it).
3) Right now the U.S. education system cannot compete with those of many other countries outside of the US except at the university level. And our best universities are filled with brilliant foreign students. Great, let’s accept the situation as it is and allow the brilliant foreign students who getting masters and Ph.D. degrees to immediately become U.S. citizens instead of forcing them to return to their own countries to use the skills we taught them abroad.
4) Give a $50,000 tax rebate to any US citizen getting a Ph.D. in the United States to help them pay for their education or their education loans.
5) Allow US companies to compete in the world in a big way by eliminating the tax on the foreign earnings of US citizen living abroad. Taxing foreign earnings of US citizens living in the US is fine, but not those who must live abroad to help our corporations grow and who must also pay foreign tax on their earnings. In addition, the new tax laws requiring foreign banks to report on the assets of US citizens is totally killing our ability to compete overseas. A US company abroad is now required to have almost 100% foreign employees because US employees cannot get bank accounts that are necessary to live.
6) Reduce Corporate Income tax from some of the highest levels in the world to competitive levels. Do this partially by not taxing foreign earnings from US corporates that are used to stimulate the economy. This would eliminate the US trade deficit fairly quickly. Right now the US government is saying that companies like Apple that channel their profits into Ireland (9% corporate tax vs 39% in the US) have to be stopped from avoiding US taxes. A much better prescription would be to tax them 10% on money brought back to the US.
7) I personally ordered a Tesla model S for delivery in October. When the P85D was announced, that is more powerful and more efficient, I upgraded to that one. I didn’t take delivery on the other one and my new one is now due the end of December. Right now the government gives people a $7500 credit for something that could totally eliminate the US dependency on foreign oil and dramatically reduce air pollution. Tesla has actually released their patents to the rest of the world. The model S actually met two of the criteria that I wanted in a car (great power -- 0-60 in 3.1 seconds) and great gas mileage (infinite). I didn’t think a Tesla met my third requirement (something I could have fun driving around the US). But it now looks like by the time I get my car they will have a ring of charging stations around the US and I will be able to drive around the US for FREE in 2015 and perhaps even do the same in many parts of Canada by the end of 2016. Let’s encourage the US to help Tesla (an American company) with their mission. Obviously, this recommendation is more of a personal bias.
Some people have found statement 7 to be the most controversial. For example, the gas mileage being infinite gets a lot of negative comments. Well, Tesla emits no pollution. The goal is to have all the charging stations be solar powered (although that has not been achieved yet because of difficulties with building permits). And in my case, my electricity (that will be used to power the battery) comes from nuclear power.
Until next month’s update, this is Van Tharp.
About the Author: Trading coach and author Van K. Tharp, Ph.D. is widely recognized for his best-selling books and outstanding Peak Performance Home Study Program—a highly regarded classic that is suitable for all levels of traders and investors. You can learn more about Van Tharp at www.vantharp.com. His new book, Trading Beyond The Matrix, is available now at matrix.vantharp.com.
Workshops
Combo Discounts available for all back-to-back workshops!
See our workshop page for details.
Trading Tip
November 2014 SQN® Report
by Van K. Tharp, Ph.D.
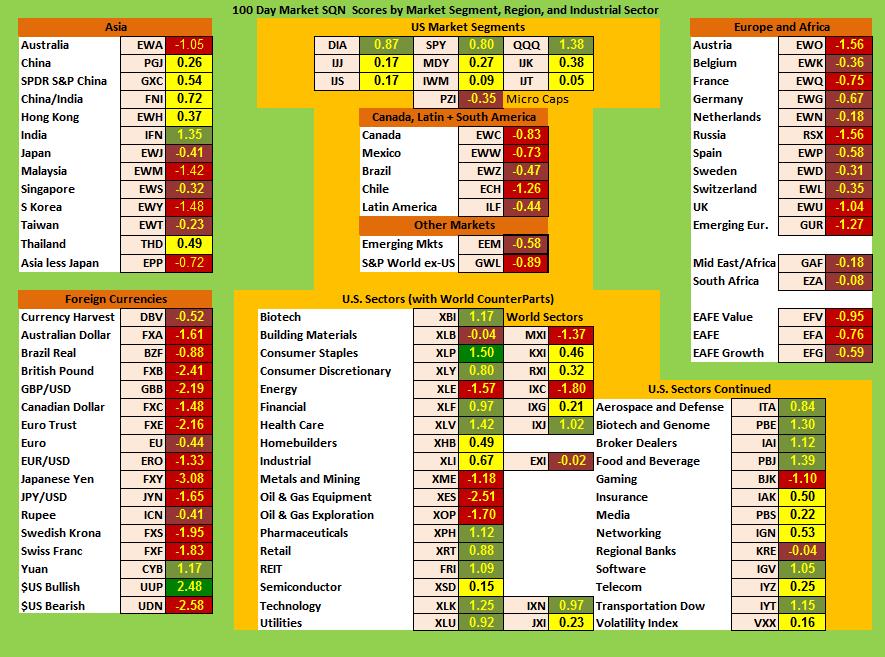
There are numerous ETFs that now track everything from countries, commodities, currencies and stock market indices to individual market sectors. ETFs provide a wonderfully easy way to discover what’s happening in the world markets. Consequently, I now apply a version of my System Quality Number® (SQN®) score to measure the relative performance of numerous markets in a world model.
The Market SQN score uses the daily percent change for input over a 100-day period. Typically, a Market SQN score over 1.47 is strongly bullish and a score below -0.7 is very weak. The following color codes help communicate the strengths and weaknesses of the ETFs in this report:
- Dark Green: ETFs with very strong SQN® 100 scores > 1.47
- Light Green: ETFs with strong SQN 100 scores (0.70 to 1.47).
- Yellow: ETFs with slightly positive Market SQN scores (0 to 0.70). These are Neutral/Sideways
- Brown: ETFs with slightly negative Market SQN scores (0 to -0.7).
- Red: Very weak ETFs that earn negative Market SQN scores (< -0.7).
This is basically the same ratings that we use for the Market SQN® Score. The world market model spreadsheet report below contains most currently available ETFs; including inverse funds, but excluding leveraged funds. In short, it covers the geographic world, the major asset classes, the equity market segments, the industrial sectors and the major currencies.
World Market Summary
Each month, we look at the equities markets across the globe by segments, regions and sectors in addition to looking at currencies, commodities, real estate, and debt.
Equity and Currency Markets
The US is pretty neutral with the large cap stocks being light green and most other divisions being yellow except micro-caps which are red. Meanwhile, Europe looks dismal with everything being red or brown. That’s an improvement, however, because last month everything was red.
The Americas are not doing that well with Canada, Mexico, and Chile being red. Brazil and Latin American are brown.
Asia is in much better shape with India being light green. China, Hong Kong, and Thailand are yellow. Japan, Singapore and Taiwan are brown, while everything else is red.
In equity sectors, consumer staples are dark green. Biotech, consumer discretionary, financial, health care, pharmaceuticals, retail, REITS, technology, utilities, aerospace, biotech, broker dealers, food and beverage, and software and transportation are all light green. Home builders, industrial, semiconductors, insurance, media, networking, telecom, and volatility are all yellow. Building material and regional banks are brown, while energy, metals and mining, and oil and gas equipment and exploration and gaming are red.
Volatility has gone positive (from what seemed like perpetual red) into yellow territory.
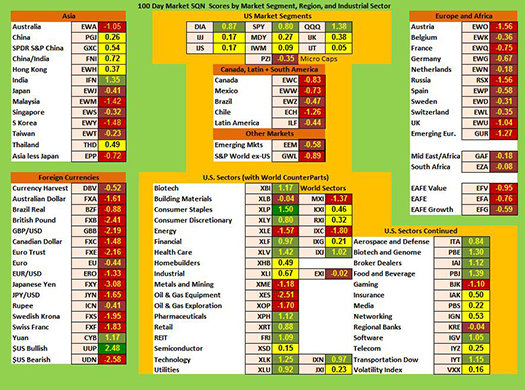
(Click here to see a larger version of this chart.)
Currencies this month are still dominated by the US Dollar for the third month in a row, and it has moved up to a score of 2.48. The Yuan is light green but everything else is either red (most) or brown (Rupee and Euro).
Commodities, Real Estate, Debt, Top and Bottom Lists
The next chart shows real estate, debt instruments, commodities and the top and bottom ETFs for the past 100 days.
Commodities are even weaker this month with only agribusiness being yellow. Everything else is red or brown. And the commodities index ETF (DBC) is the worst at -2.92. The place to be right now has been the US dollar and almost everything else is terrible.
US real estate is light green and Chinese real estate is yellow. All interest rates are light green except for inflation protected bonds. Junk bonds are red. Remember a few months ago when they were the strongest as everyone was looking for yield?
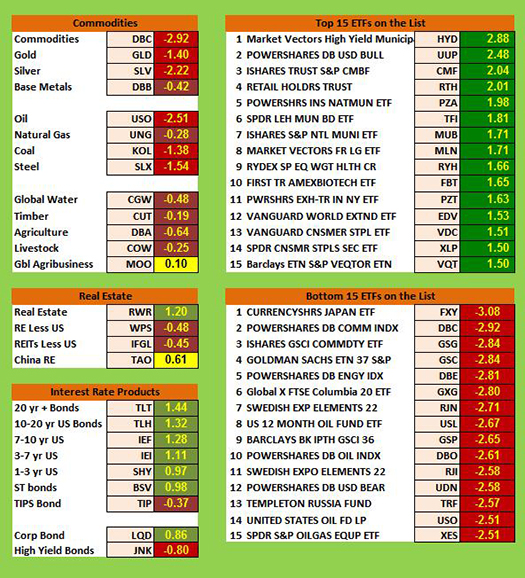
This month, only the top 4 ETFs have SQN® scores above 2.0 with muni bonds moving back to the top of the list and the US dollar second.
All of the weakest ETFs scored below -2.0 and one of them, the Japanese Yen, is below -3.0. The really weak ETFs tend to be energy and commodity related.
Summary
Now let’s look at our newest table which measures the percentage of ETFs in each of the strength categories.
Date |
Very Bullish |
Bullish |
Neutral |
Bearish |
Very Bearish |
2013 |
> 1.5 |
0.75 - 1.5 |
0 - 0.75 |
0 - -0.7 |
< - 0.7 |
Jan 31st |
27.1% |
39.6% |
20.7% |
6.4% |
4.7% |
Feb 28th |
10.3% |
45.2% |
24.4% |
11.9% |
7.5% |
Mar 31st |
39.2% |
25.5% |
19.1% |
9.0% |
6.4% |
Apr 30th |
49.1% |
21.1% |
14.8% |
8.0% |
6.2% |
May 31st |
29,2% |
23.6% |
19.9% |
12.3% |
14.2% |
Jun 30th |
2.1% |
31.0% |
23.2% |
22.0% |
20.9% |
Jul 31st |
8.2% |
33.5% |
29.0% |
13.3% |
15.2% |
Aug 30th |
1% |
15% |
46.4% |
19.3% |
17.5% |
Sep 30th |
1% |
13.8% |
42.3% |
23.0% |
19.1% |
Nov 1st |
13.3% |
48.3% |
21.8% |
12.5% |
3.3% |
Dec 1st |
14.6% |
42.7% |
24.2% |
13.3% |
4.3% |
Dec 31st |
19.3.% |
45.5% |
22.0% |
11.3% |
2.9% |
2014 |
|
|
|
|
|
Jan 31st |
8.0% |
49.3% |
20.7% |
12.7% |
7.6% |
Feb 28th |
18.9% |
48.4% |
18.1% |
6.2% |
6.8% |
Mar 31st |
4.9% |
40.2% |
38.8% |
13.3% |
3.1% |
Apr 30th |
11.1% |
33.9% |
40.2% |
11.3% |
1.8% |
May 31st |
12.5% |
46.5% |
27.7% |
7.6% |
6.0% |
Jun 30th |
53.4% |
33.7% |
14.2% |
2.5% |
0.8% |
Aug 29th |
20.3% |
45.2% |
22.8% |
10.5% |
5.3% |
Sep 30th |
6.6% |
26.9% |
30.2% |
24.0% |
18.5% |
Oct 31st |
2.9% |
17.9% |
38.8% |
17.7% |
26.3% |
Nov 30th |
3.1% |
25.7% |
25.1% |
22.8% |
27.9% |
By the end October, 44% of the ETFs had become bearish and this month it’s 50.7%. In October 20.8% of the ETFs in the database were bearish, but now it’s 28.8%. This is with the S&P 500 making 12 all-time high closes during the month of November. Does that make sense to you? It didn’t to me, so I also looked at the S&P 500 and NASDAQ 100 stocks. Here the situation is totally different.
72.5% of these stocks are positive, while only 27.4% are negative. 3.8% have SQN scores above 2.0, while 0.8% have SQN scores below minus 2.0.
What's Going On?
The economic fundamentals are still terrible. The US stock market has moved back to Sideways Normal but it also set 12 all-time high closes in November. Be careful to base your actions upon what is happening, not what you think might happen.
Until early January, this is Van Tharp.
The markets always offer opportunities, but to capture those opportunities, you MUST know what you are doing. If you want to trade these markets, you need to approach them as a trader, not a long-term investor. We’d like to help you learn how to trade professionally because trying to navigate the markets without an education is hazardous to your wealth.
All the beliefs given in this update are my own. Though I find them useful, you may not. You can only trade your own beliefs about the markets.
Video
Pound/Dollar Trade Video Lesson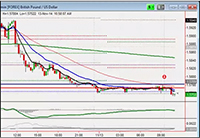
In this 6 minute video, Gabriel profiles a trade that one of his systems found in the British Pound (GBP/USD). The weekly, daily, and hourly chart clearly show the Pound’s downtrend but the flattening pattern in the 15 minute chart in mid-November offered a low risk setup for possibly capturing the next move down. After he entered the position, listen how Gabriel then managed the risk according to his rules as the position met the first profit target and he wanted to allow it to continue to move to a second profit target. Gabriel provides a lot of valuable information in this short video about how his trading systems find low risk opportunities like this trade that generated more than +6R.
Click here to watch the video.
Matrix Contest
Good Belief Hunting!
by Vladimir S.
It would be hard to argue that in all Dr. Tharp's books, including, of course, "Trading beyond the Matrix", the theory of beliefs presented as a cornerstone of Dr. Tharp's teaching. At first glance, easy to comprehend, the concept of examining one's beliefs really shines only when one actually does it. My first attempt to create an inventory of my identity beliefs was not very successful. The process was dull and uninspiring and the result looked pretty much like a packing list. After an extended period of time, during of which handful adverse events took place in my life, I decided to give it another try. I wrote up a list of my parts on a whiteboard in my home office. For each of my parts I created notebook in Evernote and started writing down one or two beliefs a day in a random order. Every time during a day I took a decision or didn't take it, felt the pain or caused it to somebody else, every time I was reflecting on any phrase said by one of my relatives, I was asking myself "What belief forced me to say what I just said, do what I just did, feel what I just felt?"
I expanded the timeframe for my belief hunting activities later on to as far back as I could remember. I was trying to recollect all the important choices I have made, all the pains I have experienced, all the emotions that have driven me insane and when I discovered a belief, acting deep in my subconsciousness, I treated it like King Solomon treated his precious metals inventory. The result was different. It was not a passive content of my life's suitcase. These Evernote's entries have been forcing my emotions, my thoughts, my actions. While I realized that these beliefs have been running my life, I was unpleasantly surprised how shallow, naive and insignificant the rationales beyond my beliefs were. There I was, writing down beliefs in charge of my decisions at the very important points of my life, and at the same time I was looking at my beliefs in disbelief (no pun intended). The feelings of self-disgust and self-deprecation were simply overwhelming. I took me a while to come to terms with this discovery. After attending Peak Performance workshop 101, reading "Super Trader" and "Trading beyond the Matrix" I thought I understood what charged beliefs were. In fact, I did not. A significant part of my morning routine I call "God's hour". During that time, I usually read a few chapters from my beloved Emmet Fox. In "Around the year with Emmet Fox" he shed some light for me: "Every thought is made up of two factors, knowledge and feeling. A thought consists of a piece of knowledge with a charge of feeling, and it is the feeling alone that gives power to the thought. No matter how important or magnificent the knowledge content may be, if there is no feeling attached to it nothing will happen. On the other hand, no matter how unimportant or insignificant the knowledge content may be, if there is a large charge of feeling something will happen."
When I look at all the things and events in the past I want to take back, I see them as footprints of my charged beliefs. They are my soul’s scares and stitches. Eckhart Tolle's term for accumulated old emotional pain is "pain-body". Another way to look at it is as unionized stored charges. By putting my beliefs through the Belief Examination Paradigm, I basically created my pain-body's anatomical atlas.
When I look back at the deeds of my gray-haired beliefs the pain behind them is always there. Conventional wisdom says that time heels. My pain-body implicitly advises me otherwise. Time is a flawed concept. It does not heel, releasing of stored charges does. However, the subject of releasing stored charges is out of the scope of this essay. Read chapter eight of the "Trading Beyond the Matrix" for a truly remarkable story.
What do I do next after examining a belief? Before I answer this question let me borrow a line from Emmet Fox one more time: "As soon as subconscious mind accepts any idea, it immediately begins trying to put it into effect. I uses all its resources (and these are far greater than is commonly supposed) to that end. It uses every bit of knowledge that you have ever collected, most of which you have totally forgotten, to bring about its purpose. It mobilizes the many mental powers that you possess, most of which you never consciously use. It draws on the unlimited energy of the race mind. It lines up all the laws of nature as they operate both inside and outside of you, to get its way."
The goal is clear but how do I make my subconsciousness to accept my shiny new beliefs? I do not possess all the necessary heavy-duty machinery required to reprogram Neo's subconsciousness so I had to be a little bit more creative. Fortunately for me, after practicing Frank Kinslow's Quantum Entrainment (QE) for a while, I reread his "Eufeeling!". It was a part of my reading list in the aftermath of the Peak Performance 203 workshop — six week happiness program. I decided to try a practice Kinslow calls QE Intention and apply it to my examined beliefs. I do not want to overburden you with too many details about QE Intention or how to do it. I just would like to mention that, in my humble opinion, QE Intention, in a nutshell, is an affirmative prayer or meditation with focus on practitioner's desire and intention (feeling what it will be like when that desire is fulfilled). If an answer to question №5 of the Belief Examination Paradigm is "No", which means that I don't consider a certain belief as useful, I use a substitute belief (question №6) as a desire for QE Intention session and an answer for question №4 as my intention. Just to make sure there is no misunderstanding, question №4 asks what the original (!) belief gets me out of. On a few occasions, when I felt that I needed to plant a certain belief more deeply into my subconsciousness, I have used this practice the other way around. If I said "Yes” to question №5, I used the original belief (answer to question №1) as a desire and an answer to question №3 (what this belief gets me into) as an intention.
Byron Katie said, "There is only enlightenment in the moment. When you realize when the thought isn't true. Then you're enlightened to it." This resonates very well with what I learned during my, so to speak, Belief Intention sessions. The process of feeding QE Intention with my examined beliefs turned out to be a truly transformational experience. You may ask, what does this mean? What happens when I take my butt off my zafu? Do I feel like I just updated my mental firmware? Not really.. But I feel that I begin to see some bull market I was not aware of. The one that constantly unfolds inside of me. This happens one belief at a time.
 Enter the Matrix Contest Enter the Matrix Contest
for a chance to win a free workshop!
We want to hear about the one most profound insight that you got from reading Van's new book, Trading Beyond the Matrix, and how it has impacted your life. If you would like to enter, send an email to [email protected].
If you haven't purchased Trading Beyond the Matrix yet, click here.
For more information about the contest, click here.
Ask Van...
Everything we do here at the Van Tharp Institute is focused on helping you improve as a trader and investor. Consequently, we love to get your feedback, both positive and negative!
Send comments or ask Van a question by clicking here.
Also, Click here to take our quick, 6-question survey.
Back to Top
Contact Us
Email us at [email protected]
The Van Tharp Institute does not support spamming in any way, shape or form. This is a subscription based newsletter.
To change your e-mail Address, e-mail us at [email protected].
To stop your subscription, click on the "unsubscribe" link at the bottom left-hand corner of this email.
How are we doing? Give us your feedback! Click here to take our quick survey.
Call us at: 800-385-4486 * 919-466-0043 * Fax 919-466-0408
SQN® and the System Quality Number® are registered trademarks of the Van Tharp Institute and the International Institute of Trading Mastery, Inc.
Be sure to check us out on Facebook and Twitter!
 
Back to Top |