Tharp's Thoughts Weekly Newsletter (View On-Line)
-
Article Monthly Market Update: Neutral Quiet
by Van K. Tharp, Ph.D.
-
Workshops Discount on Swing Trading Systems Ends Next Week
-
Trading Tip September 2014 SQN Report by Van K. Tharp, Ph.D.
-
$700 Early Enrollment Discount Expires
Next Week on Swing Trading Systems Workshop
When you register for a workshop conducted by Ken Long, your knowledge accumulation actually starts before you even get the workshop. Ken’s pre-workshop material is like a mini-course in itself. After the workshop, the learning doesn’t stop as attendees can join Ken's chatroom of like-minded traders at no additional charge. The ongoing trading and learning experiences you get from this membership is worth the price of the workshop alone!
Plus, attend Forex Trading Systems in the same trip!
Two systems workshops being presented back-to-back.
You could be profiting on a daily basis with systems that trade the big trends happening in the FX markets right now. (See Van's references on currencies in his updates below.) Given the macro environment and market conditions, we can expect plenty of trendiness to continue in the Forex markets for some time to come.
Attend both and get an additional $500 discount.
Article

September 2014 Market Update
Market Condition: Neutral Quiet
by Van K. Tharp, Ph.D.
View On-line
I always say that people do not trade the markets; they trade their beliefs about the markets. In that same way, I'd like to point out that these updates reflect my beliefs. If my beliefs and your beliefs are not the same, you may not find them useful. I find the market update information useful for my trading, so I do the work each month and am happy to share that information with my readers.
However, if your beliefs are not similar to mine, then this information may not be useful to you. Thus, if you are inclined to do some sort of intellectual exercise to prove one of my beliefs wrong, simply remember that everyone can usually find lots of evidence to support their beliefs and refute others. Just simply know that I admit that these are my beliefs and that your beliefs might be different.
These monthly updates are in the first issue of Tharp's Thoughts each month. This allows us to get the closing month's data. These updates cover 1) the market type (first mentioned in the April 30, 2008 edition of Tharp's Thoughts), 2) the five week status on each of the major US stock market indices, 3) our four star inflation-deflation model plus John Williams' statistics, and 4) tracking the dollar. I will now report on the strongest and weakest areas of the overall market as a separate SQN™ Report. And that may come out twice a month if there are significant market charges.
Part I: Van Commentary—The Big Picture
In two months, the market moved from neutral (new high closes with a very small range change percent) to strong bull, to bull, and now back to neutral. We have also resumed a deflationary direction. The dollar has made a huge move up in the last two months. That’s the big picture in a nutshell.
Debt Clock
The State of the United States |
Month Ending |
National Debt |
Federal Tax Revenue |
Federal Spending |
Trade Deficit |
Debt Per Family |
Unfunded Liabilities |
Taxpayers |
People supported by them |
Jul 31 '12 |
$15.93 trillion |
$2.364 trillion |
$3.632 trillion |
$810 billion |
$684,405 |
|
|
|
Dec 30 '12 |
$16.42 trillion |
$2.452 trillion |
$3.540 trillion |
$740.7 billion |
$732,086 |
|
|
|
Jul 31 '13 |
$16.89
Trillion |
$2.73
trillion |
$3.535 trillion |
$703 billion |
$748,458 |
|
115.2 million |
109.9
95.4% |
Dec 31 '13 |
$17.27 trillion |
$2,82 trillion |
$3,480 trillion |
$692 billion |
$751,294 |
$127.2 trillion |
115.0 million |
108.5M
94.3% |
Jan 31 '14 |
$17.32 trillion |
$2.84 trillion |
$3.494 trillion |
$676 billion |
$752,026 |
$127.7 trillion |
115.2 million |
108.8M
94.4% |
Feb 28 '14 |
$17.38 trillion |
$2.86 trillion |
$3.503 trillion |
$683 billion |
$752,554 |
$128.1 trillion |
115.4 million |
108.4M
93.9% |
Mar 31 '14 |
$17.57 trillion |
$2.89 trillion |
$3.519 trillion |
$683 billion |
$758,057 |
$128.6 trillion |
115.6 million |
107.9M
93.3% |
Apr 30 '14 |
$17.51
Trillion |
$2.91 trillion |
$3.528 trillion |
$683 billion |
$758,598 |
$128.9 trillion |
115.8 million |
108.8M
94.0% |
May 31 '14 |
$17.52
Trillion |
$2.93 trillion |
$3.54 trillion |
$689 billion |
$759,341 |
$129.4 trillion |
116.0 million |
104.38M
90.0% |
Jun 30 '14 |
$17.54 trillion |
$2.95 trillion |
$3.51 trillion |
$697 billion |
$757,392 |
$124.8 trillion |
116.1 million |
104.4M
89.9% |
Jul 31 '14 |
$17.61 trillion |
$2.95 trillion |
$3.52 trillion |
$695 billion |
$757,358 |
$119.7 trillion |
116.3 million |
104.8 M
90.1% |
Aug 31 '14 |
$17.70 trillion |
$2.97 trillion |
$3.53 trillion |
$706 billion |
$757,297 |
$118.0
trillion |
116.5 million |
104.5
90.0% |
Sep 30 '14 |
$17.77 trillion |
$2.98 trillion |
$3.53 trillion |
$707 billion |
$730,321 |
$116.3
trillion |
116.7 million |
104.9
90.0% |
(To see a larger version of this image, click here.)
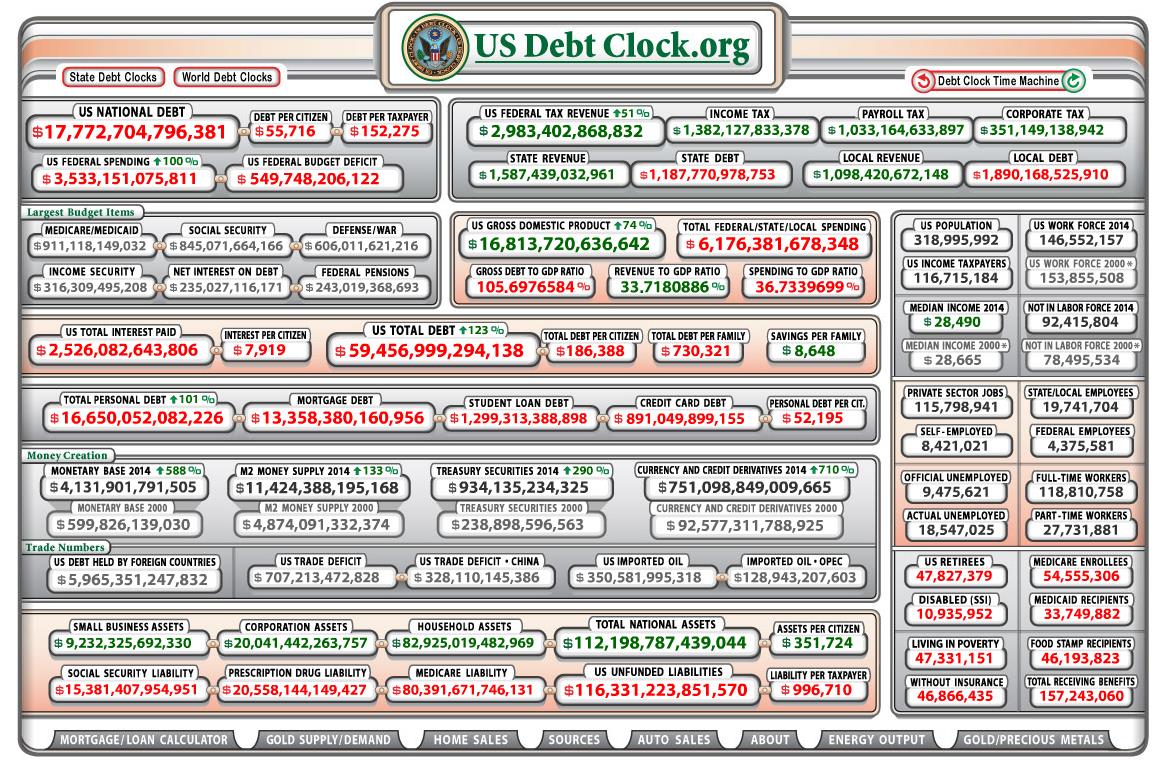
The US listing for unfunded liabilities has gone down for four straight months, from $129.4 trillion on May 31st to $116.3 trillion on September 30th. This is government manipulation of the data which is one way to get rid of potential problems. If we wiped $13.1 trillion off the books in 4 months, just imagine what we could do in a year.
Right now our total unfunded liabilities are $116.3 trillion (with most of that being Medicare and prescription drug liability) at $80.4 trillion and $20.6 trillion, respectively. Social security unfunded liability is only a little less than our total debt at $15.4 trillion and even that went down a little. So right now the US government is trimming the total unfunded liabilities at a rate of $3.275 trillion per month. At this rate, they could wipe off $116 trillion in a little over three years. Nice work government employees.
Today, our official debt is over $17.77 trillion, up from $16.89 trillion in July 2013. So that’s up $880 billion in 14 months — or $62 billion per month. Furthermore, the debt situation is so bad that the Federal Reserve has had to keep short term interest rates at almost zero and long term rates at very low numbers. This will have a long term fatal impact on the U.S. dollar and interest rates have nowhere to go but up. In fact, betting on eventual higher interest rates is about as close to a certain bet (long term) as you could ever make.
The US population is at 319 million with taxpayers standing at 116.7 million. Retirees including the first of the Boomer retirement wave now number 47.8 million and counting. Disabled people collecting social security stands at 10.9 million, while food stamp recipients total 46.2 million. That’s 104.9 million people that are supported by the government (or the 116.7 million taxpayers). I could actually add 4.4 million federal employees to the role of those supported by the taxpayers. Plus there are 19.7 million state and local employees supported by other taxes. In reality, about 11.7 million taxpayers pay 90% of U.S. taxes. This means that 11.6 million workers are supporting 105 million other people through the government. In addition, the top 1% of American tax payers pay 40% of the tax bill. Do these numbers add up to you? Do they seem sustainable? Meanwhile, the official number of unemployed is 9.47 million while the actual number of unemployed is 18.5 million. And these numbers are conservative compared with those published by Shadowstats.com which show unemployment levels at near depression level statistics.
Part II: The Current Stock Market Type Is Neutral Quiet
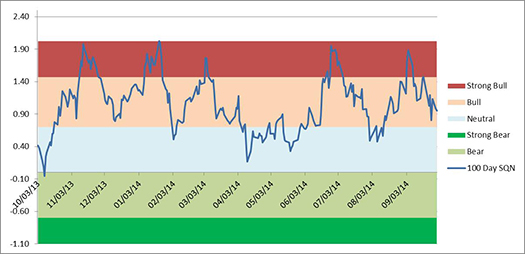
As you know, I look at the Market SQN® score for the daily percent changes in the S&P 500 Index over 200, 100, 50 and 25 days. For our purposes, the S&P 500 Index defines the market. At the October 1st close, the Market SQN® score for the 200 period was bull, the 100 day score was neutral, the 45 day score was bear and the 25 day score was strong bear.
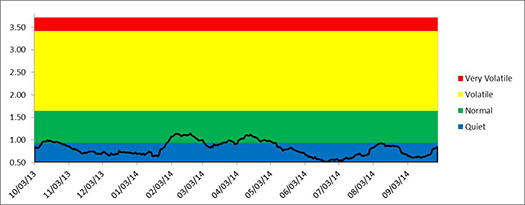
If the market volatility measurement was in the volatile range, I would consider the SQN scores to be very ominous, however, volatility is quiet at just 0.9%. The normal range for volatility begins at 0.93 while the historical mean for the 20 day ATR (as a percent of the price) is 1.29. The market won’t reach the volatile range unless the ATR% were to nearly double and hit 1.645.
On September 30th, the 100-day Market SQN® score was Bull Quiet. On October 1st it moved to Neutral Quiet. The reason? Over the last 100 days the range change percent is 3.6%. That is, the market is only up 3.6% over the last 100 days. This is despite two all-time high closes during the month of September and 34 all-time high closes during 2014. In fact, 18% of the S&P 500 closes during 2014 so far have been all-time high closes. Pretty interesting data for a market that is only up 6.7% on the year.
The charts below include a weekly bar chart of the S&P 500 over the last year, the Market SQN® score for 100 days, and the percent volatility.
(To see the three following charts stacked and aligned, click here.)
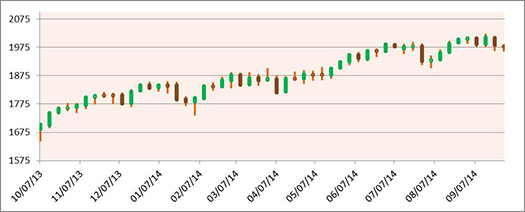
(To see the three previous charts stacked and aligned, click here.)
The market right now is providing us with schooling in sideways quiet market conditions. And these can be among the most difficult to trade. In the meantime, investment advisory services are screaming doom and gloom. One Elliot Wave firm, for example, just called a major turning point (but they have done that many times and were not correct).
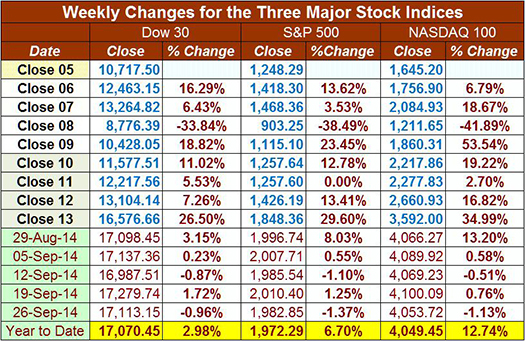
Below is a chart of the weekly changes in the three major US Indices. All three indices are up for the year, but not by a lot. The S&P 500 is now up 6.7% on the year, while the NASDAQ 100 is up 12.74%. The DOW is only up 2.98% on the year. As I said for the last few months, it wouldn’t surprise me if “they” added AAPL to the Dow sometime this year to make the Dow look like a better performer.
Part III: Our Four Star Inflation-Deflation Model
In the simplest terms, inflation means that stuff gets more expensive, and deflation means that stuff gets cheaper. There’s a correlation between the inflation rate and market levels, so the inflation rate can help traders understand big-picture processes.
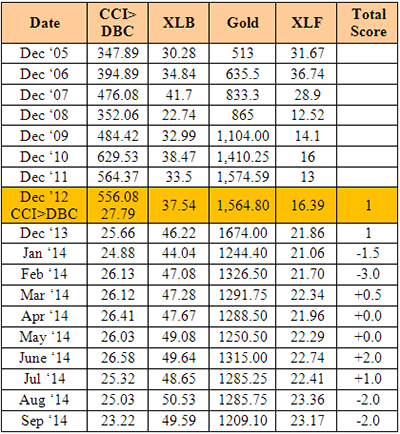
This data is up to date through September 30, 2014. We had had two inflationary months over the summer but now we are back to the deflationary trend. Just look at the price of silver, gold and commodities for a confirmation.
Looking back over the most recent two-month and six-month periods provides the current month’s score, given in the table below.
Month |
DBC2 |
DBC6 |
XLB2 |
XLB6 |
Gold2 |
Gold6 |
XLF2 |
XLF6 |
Total Score |
|
Lower |
Lower |
Higher |
Higher |
Lower |
Lower |
Higher |
Higher |
|
Sep 14 |
|
-1 |
|
+1 |
|
-1 |
|
-1 |
-2.0 |
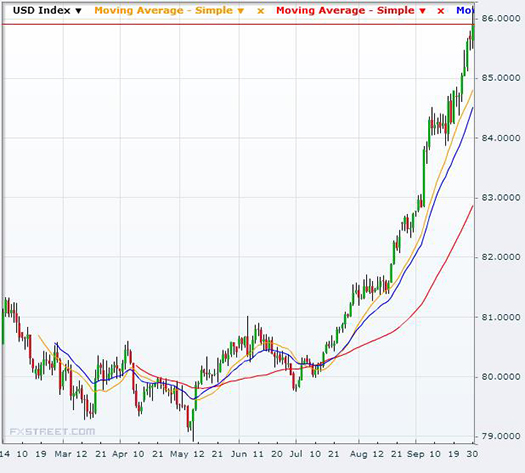
Part IV: Tracking the Dollar
The U.S. Dollar continues its up-move. This was an exception to the normal phenomenon when Van travels overseas as I did last month for three Peak Performance workshops in Berlin. When I arrived in Germany, the Euro was about $1.29 and it had dropped to $1.26 by the time I left on Wednesday. Also, I remember several years ago, the Aussie dollar was about $1.15 and now it’s about 88 cents. It looks like the US dollar is a very attractive currency right now but I think that is just relative to everything else. A lot of money has been made in the US dollar recently.
General Comments
Generally, I read a lot of email newsletters just to keep informed of what people are reading. Newsletters continue to be full of doom and gloom, however, the reality is that we are in a sideways quiet market that is very difficult to trade. It could turn down strongly, but we should have plenty of warning for that. Volatility still has a long ways to go before that is likely to happen.
I have given this prescription for the last few months and I will continue to include in in this update for at least the rest of the year.
This is my prescription for growth in the US economy. Politicians please read.
1) Kill deficit spending immediately by stopping wars and spending on what we mistakenly call “defense.” We can’t afford to be the world peace keeper any more. We spend more than a trillion per year on “defense.”
2) Make sure no more deficit spending continues by passing a law calling for a re-election of new politicians any year the government cannot spend within their means. (I heard this first from Warren Buffet and borrowed it).
3) Right now the U.S. education system cannot compete with those of many other countries outside of the US except at the university level. And our best universities are filled with brilliant foreign students. Great, let’s accept the situation as it is and allow the brilliant foreign students who getting masters and Ph.D. degrees to immediately become U.S. citizens instead of forcing them to return to their own countries to use the skills we taught them abroad.
4) Give a $50,000 tax rebate to any US citizen getting a Ph.D. in the United States to help them pay for their education or their education loans.
5) Allow US companies to compete in the world in a big way by eliminating the tax on the foreign earnings of US citizen living abroad. Taxing foreign earnings of US citizens living in the US is fine, but not those who must live abroad to help our corporations grow and who must also pay foreign tax on their earnings. In addition, the new tax laws requiring foreign banks to report on the assets of US citizens is totally killing our ability to compete overseas. A US company abroad is now required to have almost 100% foreign employees because US employees cannot get bank accounts that are necessary to live.
6) Reduce Corporate Income tax from some of the highest levels in the world to competitive levels. Do this partially by not taxing foreign earnings from US corporations that are used to stimulate the economy. This would eliminate the US trade deficit fairly quickly. Right now the US government is saying that companies like Apple that channel their profits into Ireland (9% corporate tax vs 39% in the US) have to be stopped from avoiding US taxes. A much better prescription would be to tax them 10% on money brought back to the US.
7) I personally ordered a Tesla model S for delivery in October. Right now the government gives people a $7500 credit for something that could totally eliminate the US dependency on foreign oil and dramatically reduce air pollution. Tesla has actually released their patents to the rest of the world. The model S actually met two of the criteria that I wanted in a car (great power -- 0-60 in 4.2 seconds) and great gas mileage (infinite). I didn’t think a Tesla met my third requirement (something I could have fun driving around the US). But it now looks like by the time I get my car they will have a ring of charging stations around the US and I will be able to drive around the US for FREE in 2015 and perhaps even do the same in many parts of Canada by the end of 2016. Let’s encourage the US to help Tesla (an American company) with their mission. Obviously, this recommendation is more of a personal bias.
One of the attendees in Peak 101 in Berlin said he bought a Tesla Model S in the Netherlands. With his tax breaks the car cost him about $35K. Mine will effectively cost $100K plus even with the tax credit.
Until next month’s update, this is Van Tharp.
About the Author: Trading coach and author Van K. Tharp, Ph.D. is widely recognized for his best-selling books and outstanding Peak Performance Home Study Program—a highly regarded classic that is suitable for all levels of traders and investors. You can learn more about Van Tharp at www.vantharp.com. His newest book, Trading Beyond The Matrix, is available now at matrix.vantharp.com.
Workshops
| October |
$700 Discount Expires Next Week On Swing Trading Systems |
| Oct 11-13 |
Forex Trading
with Gabriel Grammatidis |
| Oct 14-15 |
Live Forex Trading
with Gabriel Grammatidis |
| Oct 17-19 |
Swing Trading Systems
with Ken Long |
November |
| Oct 30-Nov 1 |
Peak Performance 101
with Van Tharp and co-instructors RJ Hixson and Janie Guill |
| Nov 3-6 |
Peak Performance 202
with Van Tharp and Libby Adams and co-instructors RJ Hixson and Janie Guill
Only a few seats remain. This workshop sells out quickly! |
| Nov 8-9 |
Oneness Awakening Weekend
with Van Tharp, Janie Guill and Rebecca Price
SOLD OUT |
December
The Annual Super Trader Summit, click here.
Dates for 2015 on the horizon! |
Combo Discounts available for all back-to-back workshops!
See our workshop page for details.
Trading Tip
September 2014 SQN® Report
by Van K. Tharp, Ph.D.
There are numerous ETFs that now track everything from countries, commodities, currencies and stock market indices to individual market sectors. ETFs provide a wonderfully easy way to discover what’s happening in the world markets. Consequently, I now apply a version of my System Quality Number® (SQN®) score to measure the relative performance of numerous markets in a world model.
The Market SQN score uses the daily percent change for input over a 100-day period. Typically, a Market SQN score over 1.47 is strongly bullish and a score below -0.7 is very weak. The following color codes help communicate the strengths and weaknesses of the ETFs in this report:
- Dark Green: ETFs with very strong SQN® 100 scores > 1.47
- Light Green: ETFs with strong SQN 100 scores (0.70 to 1.47).
- Yellow: ETFs with slightly positive Market SQN scores (0 to 0.70). These are Neutral/Sideways
- Brown: ETFs with slightly negative Market SQN scores (0 to -0.7).
- Red: Very weak ETFs that earn negative Market SQN scores (< -0.7).
This is basically the same ratings that we use for the Market SQN® Score. The world market model spreadsheet report below contains most currently available ETFs; including inverse funds, but excluding leveraged funds. In short, it covers the geographic world, the major asset classes, the equity market segments, the industrial sectors and the major currencies.
World Market Summary
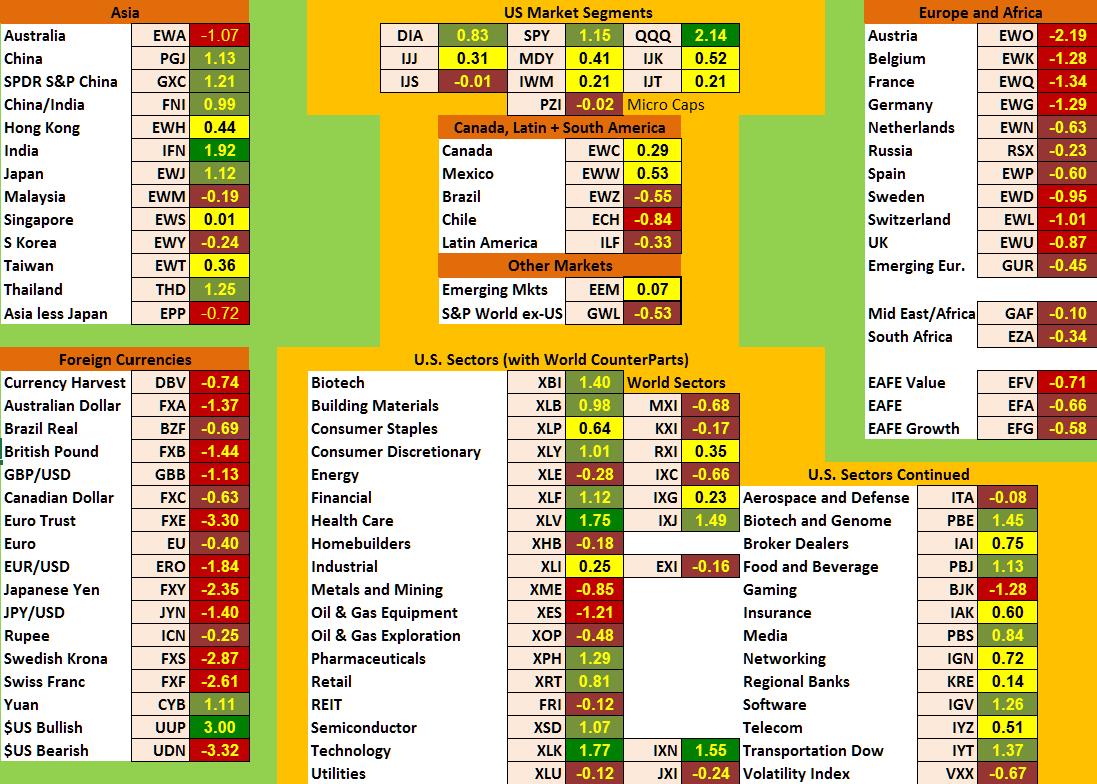
Each month, we look at the equities markets across the globe by segment, region and sector. In the last month, Asia has become stronger while the Americas are weak and Europe looks dismal (being all red and brown). The US is what I would call flat sideways to slightly up.
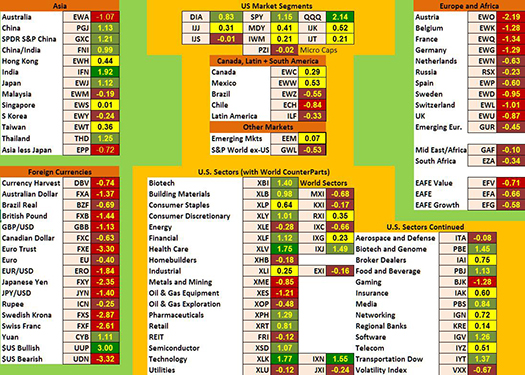
(To see a larger version of this chart, click here.)
All US divisions are yellow to dark green except for small cap value and microcaps which are now brown (bear). The Americas are not doing that well, with Chile being red, Brazil and Latin America being brown, while Canada and Mexico are just yellow.
Europe is not doing well at all and got much worse over the last month. Seven European countries are Red (strong bear) while four are brown. Austria actually has an SQN 100 score below -2.0, a very low score.
Asia is in much better shape with India being dark green, while China, Japan, and Thailand are light green. Hong Kong, Singapore, and Taiwan are yellow, while Australia with their weak Aussie dollar is red.
In the sectors, Healthcare and Technology are dark green and many other sectors are light green. Again, this shows the sideways to slightly up bias of the US Stock market, however, Metals and Mining, Gaming, and Oil and Gas equipment are all red. The volatility ETF (VXX) is brown, meaning it is creeping up from red the prior month.
Currencies this month are dominated by the US Dollar. It is showing the strongest score I have ever seen in a currency since we have been doing this (it’s +3.0). Other than the USD, only the Yuan is light green and everything else is red or brown. Several currencies are actually red (The Euro at -3.3; the Yen at -2.35, the Swedish Krona at -2.87; and the Swiss Franc at -2.61). The big trade (and I hope you have been in it) has been the US Dollar and some people made a lot of money last month.
Commodities, Real Estate, Debt, Top and Bottom Lists
The next chart shows real estate, debt instruments, commodities and the top and bottom ETFs for the past 100 days.
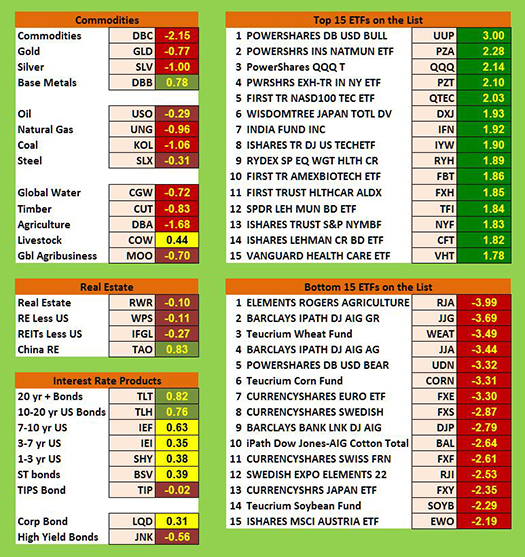
Commodities are much weaker this month as only base metals show up light green while livestock shows up as yellow. Everything else is red or brown. The place to be has been the US dollar and almost everything else is terrible.
US real estate is brown while Chinese real estate is light green. The interest rate sectors are a mix with nothing being very strong or very weak. Longer term interest rates are the best and inflation protected bonds and junk bonds are negative.
This month, the top 5 ETFs have SQN® scores above 2.0 with the US Dollar being the star at 3.0.
All of the weakest ETFs scored below -2.0. Seven (almost unheard of) are below -3.0. The really weak ETFs tend to be agriculture related.
Summary
Now let’s look at our newest table which measures the percentage of ETFs in each of the strength categories.
Date |
Very Bullish |
Bullish |
Neutral |
Bearish |
Very Bearish |
2013 |
> 1.5 |
0.75 - 1.5 |
0 - 0.75 |
0 - -0.7 |
< - 0.7 |
Jan 31st, |
27.1% |
39.6% |
20.7% |
6.4% |
4.7% |
Feb 28th |
10.3% |
45.2% |
24.4% |
11.9% |
7.5% |
Mar 31st |
39.2% |
25.5% |
19.1% |
9.0% |
6.4% |
Apr 30th |
49.1% |
21.1% |
14.8% |
8.0% |
6.2% |
May 31st |
29,2% |
23.6% |
19.9% |
12.3% |
14.2% |
Jun 30th |
2.1% |
31.0% |
23.2% |
22.0% |
20.9% |
Jul 31st |
8.2% |
33.5% |
29.0% |
13.3% |
15.2% |
Aug 30th |
1% |
15% |
46.4% |
19.3% |
17.5% |
Sep 30th |
1% |
13.8% |
42.3% |
23.0% |
19.1% |
Nov 1st |
13.3% |
48.3% |
21.8% |
12.5% |
3.3% |
Dec 1st |
14.6% |
42.7% |
24.2% |
13.3% |
4.3% |
Dec 31st |
19.3.% |
45.5% |
22.0% |
11.3% |
2.9% |
2014 |
Jan 31st |
8.0% |
49.3% |
20.7% |
12.7% |
7.6% |
Feb 28th |
18.9% |
48.4% |
18.1% |
6.2% |
6.8% |
Mar 31st |
4.9% |
40.2% |
38.8% |
13.3% |
3.1% |
Apr 30th |
11.1% |
33.9% |
40.2% |
11.3% |
1.8% |
May 31st |
12.5% |
46.5% |
27.7% |
7.6% |
6.0% |
Jun 30th |
53.4% |
33.7% |
14.2% |
2.5% |
0.8% |
Aug 29th |
20.3% |
45.2% |
22.8% |
10.5% |
5.3% |
Sep 30th |
6.6% |
26.9% |
30.2% |
24.0% |
18.5% |
Last month, 15.8% of the ETFs we track were negative. By the end of September it was 42.5% That’s a huge change. Similarly, last month 65.5% of the ETFs were bullish. And by the end of September it dropped to 33.5%.
What's Going On?
The economic fundamentals are still terrible. The US stock market has moved to Neutral Quiet. Be careful to base your actions upon what is happening, not what you think might happen.
Until next month, this is Van Tharp.
The markets always offer opportunities, but to capture those opportunities, you MUST know what you are doing. If you want to trade these markets, you need to approach them as a trader, not a long-term investor. We’d like to help you learn how to trade professionally because trying to navigate the markets without an education is hazardous to your wealth.
All the beliefs given in this update are my own. Though I find them useful, you may not. You can only trade your own beliefs about the markets.
Matrix Contest
Our Next Matrix Insight Contest Has Begun!
 We want to hear about the one most profound insight that you got from reading Van's newest book, Trading Beyond the Matrix, and how it has impacted your life. We want to hear about the one most profound insight that you got from reading Van's newest book, Trading Beyond the Matrix, and how it has impacted your life.
We have updated some of the rules since the last contest, so please read them carefully before entering:
- Each essay should be around 1200 words.
- The ideal entries will focus more on a single transformative insight as opposed to “the whole book was transformational”.
- Dr. Tharp and the VTI team will pick the top 5 best entries from the submissions and our newsletter readers will vote to choose the top winner.
- The winner receives one free VTI foundation workshop; (*foundation workshops include the Peak Performance 101 workshop, How to Develop A Winning Trading System That Fits You, and the Blueprint for Trading Success workshop.) The winner may choose one of these workshops (valued at $2,995) or substitute any single VTI product priced at $795 (or below) of your choice.
- Over the duration of the contest, we will choose our favorite entries and publish them in our weekly newsletter, Tharp’s Thoughts. All entries appearing in the newsletter will receive a $50 coupon (increased from $20) which can be used on any VTI product or service.
If you would like to enter, send an email with your essay to [email protected].
If you haven't purchased Trading Beyond the Matrix yet, click here.
For more information about the contest, click here.
Missed the last contest? Click here to see all of the submissions which were picked to run in Tharp's Thoughts as well as the winning entry!
Ask Van...
Everything we do here at the Van Tharp Institute is focused on helping you improve as a trader and investor. Consequently, we love to get your feedback, both positive and negative!
Send comments or ask Van a question by clicking here.
Also, Click here to take our quick, 6-question survey.
Back to Top
Contact Us
Email us at [email protected]
The Van Tharp Institute does not support spamming in any way, shape or form. This is a subscription based newsletter.
To change your e-mail Address, e-mail us at [email protected].
To stop your subscription, click on the "unsubscribe" link at the bottom left-hand corner of this email.
How are we doing? Give us your feedback! Click here to take our quick survey.
Call us at: 800-385-4486 * 919-466-0043 * Fax 919-466-0408
SQN® and the System Quality Number® are registered trademarks of the Van Tharp Institute and the International Institute of Trading Mastery, Inc.
Be sure to check us out on Facebook and Twitter!
 
Back to Top |