Tharp's Thoughts Weekly Newsletter (View On-Line)
-
Article Market Condition: Bull Quiet by Van K. Tharp, Ph.D.
-
-
20% Off Sale ENDS TODAY (Jan 8)
$700 Discount on Peak Workshops ENDS TODAY
The new, 2nd Edition to the Definitive Guide to Position Sizing is part of the 20% off sale. So after today the regular price will be $249 (sale price is $199).
To see what's on sale, click here.
For more information on workshops, click here.
Article
Market Update for the Period Ending December 31, 2013 Market Condition: Bull Quiet
by Van K. Tharp, Ph.D.
View On-line
I always say that people do not trade the markets; they trade their beliefs about the markets. Consequently, I'd like to point out that these updates reflect my beliefs. I find the market update information useful for my trading, so I do the work each month and am happy to share that information with my readers.
If, however, your beliefs are not similar to mine, then this information may not be useful to you. If you are inclined to perform some sort of intellectual exercise to prove one of my beliefs wrong, simply remember that everyone can usually find lots of evidence to support their beliefs and refute others. Know that I acknowledge that these are my beliefs and that your beliefs may be different.
These updates are in the first issue of Tharp's Thoughts each month. This allows us to get the closing month's data. These updates cover 1) the market type (first mentioned in the April 30, 2008 edition of Tharp's Thoughts and readable on our web site), 2) the five-week status on each of the major U.S. stock market indices, 3) our four star inflation-deflation model plus John Williams' statistics, and 4) the movement of the dollar. I now report on the strongest and weakest areas of the overall market in a separate SQN® Report. I may come out with that report twice a month if there are significant market changes.—Van K. Tharp
Part I: Commentary—The Big Picture
We’ve been in a bull market for some time. Based upon percentage gain, 2013 was the best year since 1997. We haven’t had a 10% correction in the S&P 500 since 2011. The Dow ended 2013 at 16,0459 (but remember that the components of the Dow were changed before that occurred). However, the market has not reached a new high over the 2000 peak if you adjust for inflation, either the government version of it or based upon real CPI statistics. Essentially, we have had a huge run-up because the Fed has pumped money into the economy. And instead of lending the money, banks have put it into the stock market. It can’t go up forever, but the banks can keep doing it for a lot longer than you or I might suspect.
The Fed has just found a new tool to make adjustments. It can adjust the rate of interest it currently pays on deposits it holds for the banks. That rate is currently 0.25%, and the Fed is thinking about reducing it to zero. In other words, it’s telling banks to keep their money and invest it elsewhere. And now banks are retaliating by threatening to charge depositors for holding their money.
Richard Russell recently suggested that the US could fix its debt problem overnight by unilaterally resetting the price of gold to a much higher number. He says that’s been done twice before, so why not do it again? And then it hit him that maybe the US just doesn’t have any gold left. About six months ago, the price of gold dropped $250/oz overnight because someone sold 500 tons of gold at the market. If the world reserve is 57,299 tons, then that trade amounted to 0.87% of the world’s total supply of gold being sold with no limit. In other terms, that trade was about 20% of the 2013 world production of gold. Who would do that? Who has the ability to do that? Europe isn’t organized enough to do that. It could have been the US. But why?
No one really knows how much gold the US has, but I’ve seen the following statistics in various articles. Take these figures with a grain of salt because I have no idea how accurate any of it is … and nor does anyone else. The following table is how much gold might exist in the US.
US Location |
Amount of Gold |
Fort Knox |
4,600 tons |
West Point |
1,781 tons |
Denver |
1,368 tons |
Other |
1,000 tons |
Banks in low Manhattan (probably representing deposits from other countries) |
10,000 tons |
Total |
18,749 (8,749 probably belonging to US) |
Here is another version of the same data on a world basis, courtesy of the world debt clock.
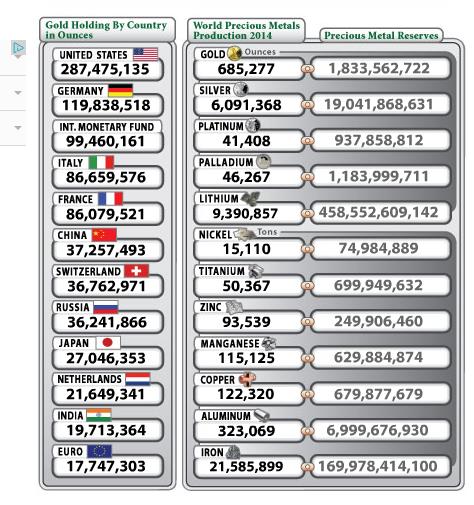
If you translate the holdings into tons, you get the following table. And if this is right, the US holds 15.7% of the world’s gold reserves which is still a pretty substantial position. But what if it holds only 10% of that figure? Or what if “they” have sold it all?
Country |
Ounces |
Tons |
US |
287,475,135 |
8983.6 |
Germany |
119,838,518 |
3745.0 |
Internation Monetary Fund |
99,460,161 |
3108.1 |
Italy |
86,659,576 |
2708.1 |
France |
86,079,521 |
2690.0 |
China |
37,257,493 |
1164.3 |
Switzerland |
36,762,971 |
1148.8 |
Russia |
36,241,866 |
1132.6 |
Japan |
27,046,353 |
845.2 |
Netherlands |
21,649,341 |
676.5 |
India |
19,713,364 |
616.0 |
Euro |
17,747,303 |
554.6 |
Total |
|
27372.9 |
|
|
|
World Reserve |
1,833,562,722 |
57298.8 |
Production (2013) |
92,095,427 |
2878.0 |
To show how these are all just estimates, I recently heard that the People’s Bank of China has 4,800 tons of gold which is a lot different than 1,164.3 tons shown above.
Let’s say the US has 8,749 tons. At $1,250/oz., that represents about $350 billion dollars held in gold. When you consider that our current debt is $17.27 trillion and that our unfunded liabilities are $127 trillion, $350 billion is almost a joke. Yet in 2013, the price of gold dropped about 29%. Hmm.
Equities, yes, are in a bull market but it’s a bull market denominated in the US dollar which could easily end its reign soon as the world’s reserve currency. Indeed, Gabriel Grammatidis teaches our FOREX course and predicts that (long-term) the Yen, Euro, and the US Dollar will all collapse, possibly in that order. The Japanese managed to depreciate their currency by about 23% over the last year. So then does the Yuan take over?
Let’s look at the state of the United States chart courtesy of the debt clock. One month was missed while I was gone, but it’s not that important as the trends are obvious.
The State of the United States |
Month Ending |
National Debt |
Federal Tax Revenue |
Federal Spending |
Trade Deficit |
Debt Per Family |
Unfunded Liabilities |
Workforce (taxpayers) |
People supported by them |
July 31 2012 |
$15.93 trillion |
$2.364 trillion |
$3.632 trillion |
$810 billion |
$684,405 |
|
|
|
Dec 30 2012 |
$16.42 trillion |
$2.452 trillion |
$3.540 trillion |
$740.7 billion |
$732,086 |
|
|
|
July 31, 2013 |
$16.89
Trillion |
$2.73
trillion |
$3.535 trillion |
$703 billion |
$748,458 |
|
115.2 million |
109.9
95.4% |
Aug 31, 2013 |
$16.92 trillion |
$2.76 trillion |
$3.541 trillion |
$693 billion |
$748,889 |
|
114.2 million |
109.6
95.6% |
Sep 30, 2013 |
vvvvvvv |
vvvvvvv |
vvvvvvvv |
vvvvvvv |
vvvvvvvv |
Unfunded Liabilities |
vvvvvvvvvv |
vvvvvvvvv |
Oct 31, 2013 |
$17.13 trilion |
$2.81 trillion |
3.516 trillion |
$685 billion |
$752,131 |
No data |
114.6 million |
109.0
95.1% |
Nov 30, 2013 |
$17.21 trillion |
$2.82 trillion |
$3.480 trillion |
$690 billion |
$752,510 |
$126.8 trillion |
114.8 million |
109.1
95.0% |
Dec 31, 2013 |
$17.27 trillion |
$2,82 trillion |
$3,480 trillion |
$692 billion |
$751,294 |
$127.2 trillion |
115.0 million |
108.5
94.3% |
They have changed the debt clock a little to include US unfunded liabilities. Right now our total unfunded liabilities are $127.2 trillion with most of that being Medicare and prescription drug liability at $88 trillion and $22 trillion, respectively. The Social Security unfunded liability is only a little less than our total debt at $16.8 trillion.
The US population remains at 317 million with taxpayers standing at 115.0 million. The oldest Boomers continue to leave the work force and retirees now stand at 47 million. Disabled people collecting social security stands at 14.3 million, while food stamp recipients total 47.2 million (with all three being up over the last month) so that’s 108.5 million people that are supported either by the government or the 115 million taxpayers. But really about 11.5 million taxpayers pay 90% of U.S. taxes. This means that 11.5 million workers are supporting 108.5 million other people through the government. Do these numbers add up to you? Do they seem sustainable?
Today, our official debt is over $17 trillion (up $50B from last month) and it’s now going up almost a trillion dollars every year. Furthermore, the debt situation is so bad that the Federal Reserve has had to drive short term interest rates to almost zero and long term rates to very low numbers. This is killing the U.S. dollar and interest rates have nowhere to go but up. In fact, betting on eventual higher interest rates is about as close to a certain bet (long-term) as you could ever make.
Part II: The Current Stock Market Type Is Bull Quiet
Each month, I look at the market SQN® score for the daily percent changes in the S&P 500 Index over 200, 100, 50 and 25 days. For our purposes, the S&P 500 Index defines the market.
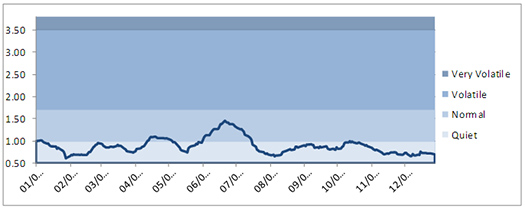
The 200-day market SQN score, as well as the 50-day score, are both in strong bull mode, while the 100 and 25-day SQN scores are just in the bull range. Market volatility remains very quiet so for now, this keeps us very safe.
(To see the three following charts stacked and aligned, click here)
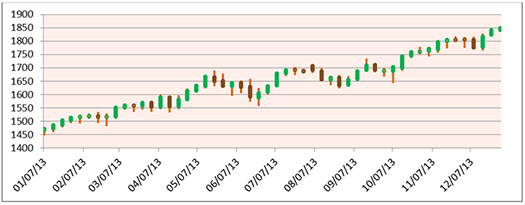
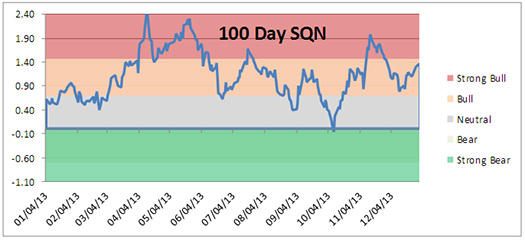
You can see that we had a few weeks in the strong bull range, and then retreated back into bull. And the last chart is our volatility chart. You can see that it’s been a long time since the market has been in any way volatile.
(To see the three previous charts stacked and aligned, click here)
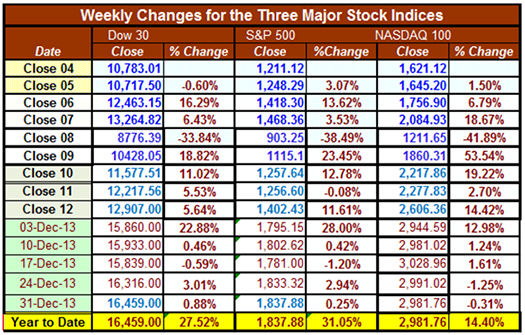
Below is a chart of the weekly changes in the three major US Indices. As you can see, all three indices are up substantially on the year with double digit gains. The S&P 500, which best represents the market, was up over 30% on the year. Was your performance as good as the major indices in 2013?
Part III: Our Four Star Inflation-Deflation Model
In the simplest terms, inflation means that stuff gets more expensive, and deflation means that stuff gets cheaper. There’s a correlation between the inflation rate and market levels, so the inflation rate can help traders understand big-picture processes.
The CRB:CCI index was discontinued on April 17th, 2013. As a result, I switched to the ETF called DBC to look at commodity prices. I kept the prior years’ CCI data (from 2005 to 2012) as a reference since the DBC data does not go back that far.
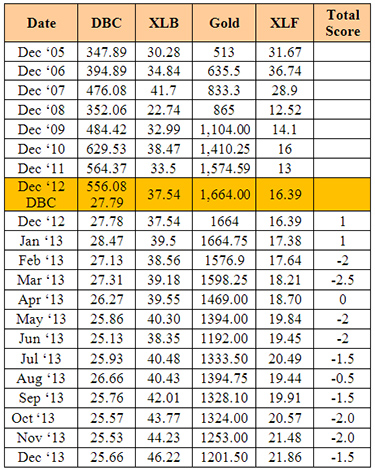
Looking back over the most recent two-month and six-month periods provides the current month’s score, given in the table below.
Month |
CRB2 |
CRB6 |
XLB2 |
XLB6 |
Gold2 |
Gold6 |
XLF2 |
XLF6 |
Total Score |
|
Higher |
Lower |
Higher |
Higher |
Lower |
Lower |
Higher |
Higher |
|
Dec-13 |
|
-1/2 |
|
+1 |
|
-1 |
|
-1 |
-1.5 |
Again, it was another month where the deflationary forces seem to be winning. During 2013 we have had one inflationary month, 10 deflationary months, and one month being zero. In fact, the last 8 straight months have been deflationary. And as we continually point out, one of the main reasons is that banks are not lending. The money multiplier put out by the St. Louis Fed is still at 0.7 rather than the normal 3.0 that we tend to see which stimulants are really working.
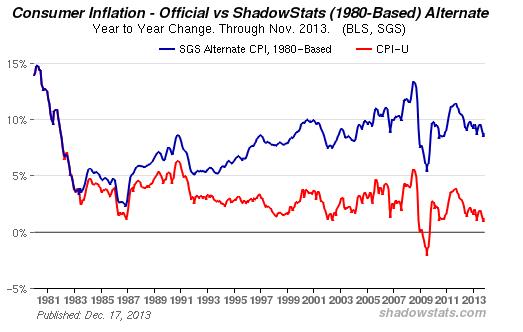
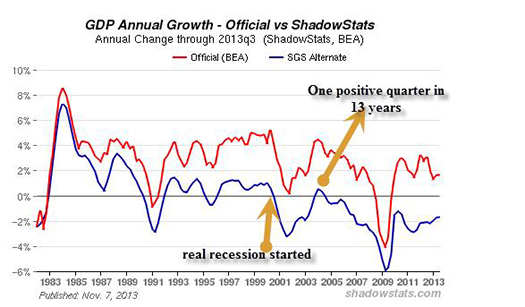
Shadowstats.com tracks the real data rather than the government manipulation of the data, suggest that 1) current inflation is running around 9% (see the chart above) and as the second chart shows (below), we’ve been in a recession (using real inflation to calculate GDP growth) since the secular bull market started. Actually, we have had one quarter in 13 years where we have not been in a recession.
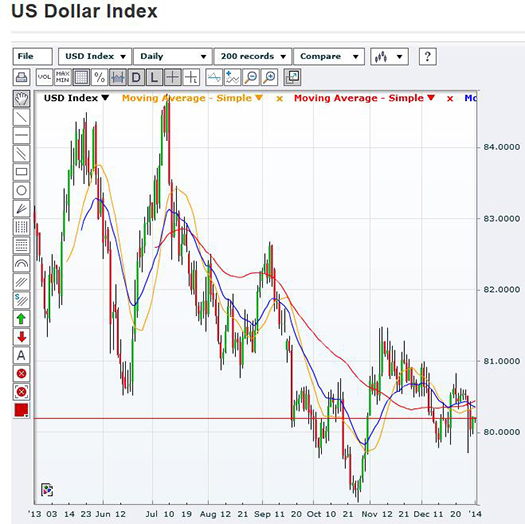
Part IV: Tracking the Dollar
Since it peaked in July, the USD has been on a downtrend that recently gathered strength. The large drop came shortly after Fed Reserve Chairman Bernanke announced the continuation of the QE program. The dollar, the Euro, and the Yen are all extremely weak currencies. All three will probably fail, but who knows which one will fail first. The dollar does have some bias for survival since much of the world’s debt is still dollar denominated. As the Fed is forced to buy more and more of the US's debt, however, that situation will change.
Below is a chart of the US Dollar Index. If it dropped below 78, it would probably be a serious sign.
General Comments
Longer term, the competitive stimulus measures from central banks propels the big picture. Short term, multiple markets continue to offer plenty of opportunities to prepared traders. The keys are awareness, preparation, and execution.
These monthly market updates are not intended for predictive purposes; rather, they’re intended to help traders decide which of their trading systems should work best in the current market conditions. In bear markets—which are almost always volatile by nature—shorter-term strategies, and those that allow going short, tend to work better than long-only or intermediate/longer-term systems.
Which of your trading systems fit this current market type? Of course, this question implies that you have multiple trading systems and that you know how they perform under various market conditions. If you haven't heard of this concept or the other concepts mentioned above, read my book, Super Trader, which covers these areas and more, so that you can make money in any kind of market condition.
Crisis always implies opportunity. Those with good trading skills can make money in this market—a lot of money. There were lots of good opportunities in 2013. Did you make money? If not, then do you understand why not? The refinement of good trading skills doesn't just happen by opening an account and adding money. You probably spent years learning how to perform your current job at a high skill level. Do you expect to perform at the same high level in your trading without similar preparation? Financial market trading is an arena filled with world-class competition. Additionally, and most importantly, trading requires massive self-work to produce consistent, large profits under multiple market conditions. Prepare yourself to succeed with a deep desire, strong commitment and the right training.
About the Author: Trading coach and author Van K. Tharp, Ph.D. is widely recognized for his best-selling books and outstanding Peak Performance Home Study Program—a highly regarded classic that is suitable for all levels of traders and investors. You can learn more about Van Tharp at www.vantharp.com. His newest book, Trading Beyond The Matrix, is available now at matrix.vantharp.com.
Back to Top
Trading Education
$700 Early Enrollment Discount Expires Today on Peak Performance 101
The Peak Performance 101 workshop is a prerequisite for the Super Trader Program and for the more advanced Peak Performance 202 and 203 workshops.
This is a great chance to attend all three Peaks back-to-back. We have not yet set our schedule past June, but most likely the next sets will be Peak 101 with one of the other workshops instead of both.
If you live in South Africa and expressed interest in Van presenting during a 2014 visit, we thank you for the feedback. Van's plans have changed however and it will be 2015 before he visits your beautiful country.
Click here to see the full workshop schedule or to register.
Back to Top
Trading Tip
December 2013 SQN® Report
There are numerous ETFs that now track everything from countries, commodities, currencies and stock market indices to individual market sectors. ETFs provide a wonderfully easy way to discover what’s happening in the world markets. Consequently, I apply a version of my System Quality Number® (SQN®) score to measure the relative performance of numerous markets in a world model.
The Market SQN score uses the daily percent change for input over a 100-day period. Typically, a Market SQN score over 1.45 is strongly bullish and a score below -0.7 is very weak. The following color codes help communicate the strengths and weaknesses of the ETFs in this report:
- Green: ETFs with very strong Market SQN scores (0.75 to 1.5).
- Yellow: ETFs with slightly positive Market SQN scores (0 to 0.75).
- Brown: ETFs with slightly negative Market SQN scores (0 to -0.7).
- Red: Very weak ETFs that earn negative Market SQN scores (< -0.7).
The world market model spreadsheet report below contains most currently available ETFs; including inverse funds, but excluding leveraged funds. In short, it covers the geographic world, the major asset classes, the equity market segments, the industrial sectors and the major currencies.
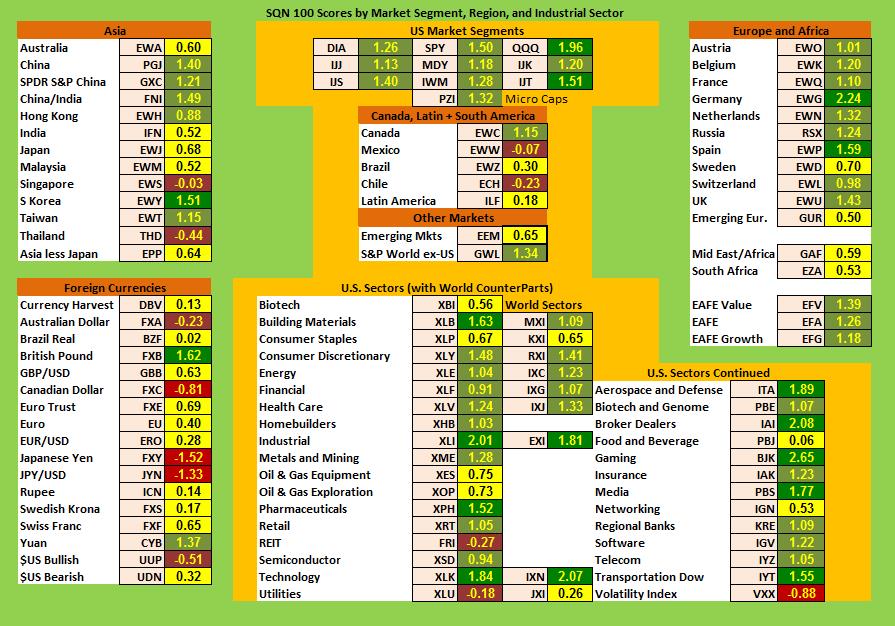
World Market Summary
Each month, we look at the equities markets by segment, region and sector. As of December 31, all US sectors are green. Europe is green and yellow, with only Sweden and Emerging Europe being yellow. Germany looks especially strong. In Asia, however, we see two negative areas with Singapore and Thailand being weak. South Korea looks particularly strong. And in the Americas (other than the US) we have Canada fairly strong, while Mexico and Chile are weak.
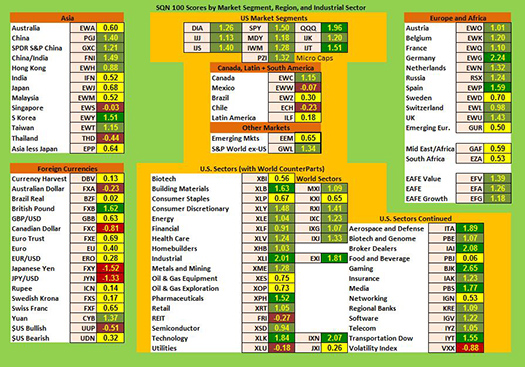
(To see a larger version of this chart, click here)
Currencies, on the other hand, show much less strength than equities. Four currencies are negative (Aussie dollar, Canadian Dollar, the Japanese Yen, and the US Dollar. Two currencies are strong and they are the Chinese Yuan and the British Pound.
From a sector standpoint, we see again mostly green and some yellow. Industrials, Pharmaceuticals, Building Materials and Technology are by far the strongest sectors, being the only dark green. Eight other sectors are light green. The negative sectors are REITS and Utilities, where people usually turn in weak markets.
Commodities, Real Estate, Debt, Top and Bottom Lists
The next chart shows real estate, debt instruments, commodities and the top and bottom ETFs for the past 100 days.
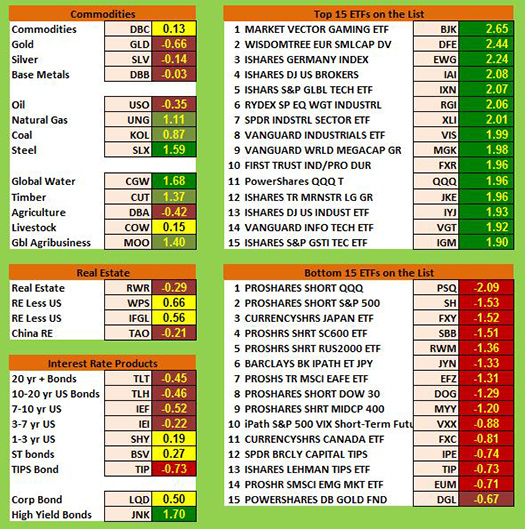
Global Water and Steel are strong among the commodities. Natural gas, coal, timber, and global agribusiness are all light green. Metals, however, are still pretty weak. US and Chinese real estate seem week while real estate in the rest of the world is better (yellow). All of the interest rates sectors are weak, with short term being fairly neutral.
In the group of top market SQN scoring ETFs, we have seven with SQN scores at 2.0 or above as opposed to nine for last month. Gaming, Germany, small cap dividends in Europe, Brokers, Global Technology, and Industrials are all strong. We have one negative ETF below -2.0 (PSQ, short the QQQ). A -2 SQN score is much more difficult to achieve than +2.0.
Summary
So let’s look at our overall summary of the ETF picture and see what trends are happening. Last month I was somewhat surprised at the bullishness, and it has seemed to continue for another month. At the beginning of the month, we have 57.3% bullish, and 17.6% bearish. And now it is 56.9% bullish and 19.5% bearish. That’s pretty similar.
Date |
Very Bullish |
Bullish |
Neutral |
Bearish |
Very Bearish |
|
> 1.5 |
0.75 - 1.5 |
0 - 0.75 |
0 - -0.7 |
< - 0.7 |
January 31st |
27.1% |
39.6% |
20.7% |
6.4% |
4.7% |
February 28th |
10.3% |
45.2% |
24.4% |
11.9% |
7.5% |
March 31st |
39.2% |
25.5% |
19.1% |
9.0% |
6.4% |
April 30th |
49.1% |
21.1% |
14.8% |
8.0% |
6.2% |
May 31st |
29,2% |
23.6% |
19.9% |
12.3% |
14.2% |
June 30th |
2.1% |
31.0% |
23.2% |
22.0% |
20.9% |
July 31st |
8.2% |
33.5% |
29.0% |
13.3% |
15.2% |
August 30th |
1% |
15% |
46.4% |
19.3% |
17.5% |
Sept. 30th |
1% |
13.8% |
42.3% |
23.0% |
19.1% |
Nov. 1st |
13.3% |
48.3% |
21.8% |
12.5% |
3.3% |
Dec 1st |
14.6% |
42.7% |
24.2% |
13.3% |
4.3% |
Dec 31st |
19.3.% |
45.5% |
22.0% |
11.3% |
2.9% |
What's Going On?
Bottom line the market (ie., S&P 500) is in a quiet bull mode. Yes, the fundamentals are terrible, but the market says be “long” US stock. When the market changes, then you should change, but investing according to what you think might happen rather than what is happening is usually a recipe for disaster. Have a great 2014. Until next month, this is Van Tharp.
The markets always offer opportunities, but to capture those opportunities, you MUST know what you are doing. If you want to trade these markets, you need to approach them as a trader, not a long-term investor. We’d like to help you learn how to trade professionally because trying to navigate the markets without an education is hazardous to your wealth.
All the beliefs given in this update are my own. Though I find them useful, you may not. You can only trade your own beliefs about the markets.
 New, Second Edition, The Definitive Guide To Position Sizing Strategies is Now Available! New, Second Edition, The Definitive Guide To Position Sizing Strategies is Now Available!
The name Van Tharp is often synonymous with the term Position Sizing. In fact, Van invented and coined the term. It's one of the most important concepts that a trader can understand, yet so often, traders misjudge how critical a role it plays in your results. To help traders, Van set out to create the definitive compilation of this weighty subject some years back. Based on the feedback from the book’s first edition readers, he was quite successful and now he is releasing the second edition.
If you think your systems are more important than your position sizing strategies in meeting your objectives, we strongly encourage you to study this book. Understanding position sizing topics will have more impact on your trading results than any other single “technical” subject. After reading it, you'll understand why many traders keep the book close by as desk reference.
It's a substantial book, well worth its $249 price tag, however, during our sale you can get the NEW edition for just $199! But hurry, the sale will be ending today.
Learn More | Order Now
Ask Van...
Everything we do here at the Van Tharp Institute is focused on helping you improve as a trader and investor. Consequently, we love to get your feedback, both positive and negative!
Click here to take our quick, 6-question survey.
Also, send comments or ask Van a question by clicking here.
Back to Top
Contact Us
Email us at [email protected]
The Van Tharp Institute does not support spamming in any way, shape or form. This is a subscription based newsletter.
To change your e-mail Address, e-mail us at [email protected].
To stop your subscription, click on the "unsubscribe" link at the bottom left-hand corner of this email.
How are we doing? Give us your feedback! Click here to take our quick survey.
800-385-4486 * 919-466-0043 * Fax 919-466-0408
SQN® and the System Quality Number® are registered trademarks of the Van Tharp Institute
Be sure to check us out on Facebook and Twitter!
 
Back to Top |
|
January 8, 2014 #663

Our Mission
Yahoo and Gmail Users:
Viewing on-line eliminates spacing, and formatting problems that may be unique to your email program.

Ongoing Contest: Learn how you could win a free workshop

A Must Read for All Traders
Super Trader
How are we doing?
Give us your feedback!
Click here to take our quick survey.
From our reader survey...
"I think the newsletter is extremely generous and it is a resource I utilize constantly. I have saved every single one since I first subscribed."
Trouble viewing this issue?
View On-line. »
Tharp Concepts Explained...
-
Trading Psychology
-
System Development
-
Risk and R-Multiples
-
Position Sizing
-
Expectancy
-
Business Planning
Learn the concepts...
Read what Van says about the mission of his training institute.
The Position Sizing Game Version 4.0
Have you figured out yet how to pick the right stocks? Are you still looking for a high win-rate trading system? When you’re ready to get serious about your trader education, download the Position Sizing Game to learn some true fundamentals of trading success. Learn more.
To Download for Free or Upgrade Click Here

Download the 1st three levels of Version 4.0 for free.
Register now. »
Trouble viewing this issue?
View On-line. »

Dr. Tharp is on Facebook

Follow Van through
Twitter »

Check out our home study materials, e-learning courses, and best-selling books.
Click here for products and pricing
What kind of Trader Are You? Click below to take the test.
Tharp Trader Test
Back to Top

Introduction to Position Sizing™ Strategies
E-Learning Course
Only $149
Learn More
Buy Now
SQN® and the System Quality Number® are registered trademarks of the Van Tharp Institute
|
