Tharp's Thoughts Weekly Newsletter (View On-Line)
-
Article A Trader's Approach to Residential Real Estate Investing by Jim Weigel
-
-
Trading Tip A Rare Occurrence Adds Fuel to a Rebounding Market by D.R. Barton, Jr..
-
-
Two Premium Day-Trading Systems, with Simulations, Case Studies, and Optional Live Trading.
In the second presentation of his new day-trading workshop, Ken Long teaches the FROG trading system and the RLCO (regression line crossover) system. You'll trade the FROG via a trading simulator, offering you the equivalent of many hours of trading experience. And, Ken will exhibit numerous case studies of Regression Line Crossover Trades in simulated real-time using recorded ticks. Then to further expand your experience trading these systems, stay on for the three days of optional live trading.
We are one month away from this workshop and at current registration rates, we expect to sell out. To ensure a seat, register now. For more information click here.
 A Trader’s Approach to Residential Real Estate Investing A Trader’s Approach to Residential Real Estate Investing
by Jim Weigel
View On-line
Just as traders don’t trade the markets, real estate investors don’t invest in real estate, we invest in our beliefs about investing and real estate. My experiences as a real estate lender, homebuilder, developer, contractor, landlord and consultant have helped me develop methods that work. In addition, working through Van Tharp’s Ultimate Trader program some years ago and trading stocks, options and futures since then have given me new perspective on real estate investing. As many readers understand the principles of Tharp Think, this article is about my beliefs; perhaps you may find them as useful as I find them.
Business Owners and Investors
Successful real estate investing works best within the context of being an Investor to or with a Business Owner (I use those two terms specifically as defined by Robert Kiyosaki in his CASHFLOW Quadrant® model). Many busniess owners in real estate appear to be Business Owners. Many investors appear to be Investors. Almost none of the “professionals” in real estate, however…
- Really know how to be a true Business Owner or deal with other true Business Owners.
- Understand the typical risk and reward profiles for their method.
- Make plans to manage a change in market conditions—even while it’s very easy to know if they are in an up or down market.
- Act fast enough or act at all when market conditions do change.
- Think they have much new to learn as they believe they already know it and have done it all.
I can say all of that because I myself have made each of those mistakes.
Over time, I have learned to simplify and focus. Just as when a trader focuses on one market or one trading method to improve their performance, simplifying real estate investing across one or two property types, in one or two market areas or using one or two methods will also help your performance. It’s also important to work with a few, systematic professionals. I have become most comfortable as an Investor to and with a few Business Owners who develop land and build homes.
Risk
Life is much more pleasant when we recognize and manage risk in any kind of venture. Van’s concept of R multiples helps traders better understand, quantify and manage risk but the concept also works in real estate.1 “R” equals the initial amount we plan to risk; what we might reasonably expect to lose if things don’t go favorably. An “R multiple” is the amount we actually make or lose on the deal divided by R, the initial risk. A profitable trade or deal yields a positive R multiple, a loss yields a negative R.
Real estate tends to have a high win rate or rather a high probability of profitable transactions, typically 90%-99% — though these figures are skewed toward favorable market conditions and competent people. This high level of success tends to breed complacency, even overconfidence to the point that a loss can seem a virtual impossibility because “This deal is so good” or “I am so good” or both.
More realistically, banks and larger institutions consider 0.25%-20.0% of the investment (usually a loan) as their initial risk or R.2 Smaller institutions, businesses and individuals typically think in terms of initial risk being 5%-100% of the cost of a property.3
However, most of the people and businesses who invest in real estate don’t truly recognize, plan for, or even seriously consider risk. In other cases, risk may equal “all the cash I want to (or can) use and all the cash I want to (or can) borrow to get into this deal.” In these cases, R can equal all of their net worth.
The second most common way that real estate investors deal with risk is to underestimate the average or range of losses. This is especially true for those with supposedly sophisticated risk models because they tend to use too little historical data (say 10 years) which causes them to underestimate or ignore the frequency of large losses. This is like a trader trying to use only a handful of trades (without having seen the -5R loss yet) to extrapolate a forty-five degree upward sloping equity curve over many years. Real estate investors also tend to ignore the possibility that future losses may be larger than past losses even though the disclosure documents say something like that everywhere. Perhaps this behavior exhibits judgmental biases at work?
Reward
Conceptually, real estate reward comes in two forms: periodic net income (usually monthly or annually) and the net gains from a terminal exit or sale. All of this is before tax effects.
If you held a stock over a long period, you would add the accumulated dividends received to the capital gain on the sale of the stock to calculate your R multiple. For real estate, you would add the net periodic income to the net gains from the sale to calculate your R multiple — if your holding period is a few years or less. On the other hand, if your holding period spans one or more market cycles, it may be more useful to break the R multiple calculation down into multiple segments.
All of this is fairly easy to calculate, but real estate investors usually forget or simply don’t track many of the annual items to really understand their true risk adjusted reward.
Some R-Multiple Examples
Say you bought a house for $150,000 in 2010, with $30,000 down. You rented it out for three years, netting $15,000 in rental income and then sold it for $165,000, netting $26,500 (a bit less than your down payment) after paying transaction costs and the mortgage balance. Your total profit was $41,500. Your initial risk, or R, was $30,000 so your R multiple on this transaction was $41,500/$30,000 = 1.38.
As another example, say I bought a piece of land in 2007 for $1,000,000, with $400,000 down and a mortgage for $600,000 (seller carryback, non-recourse). I have paid $10,000 per year for property taxes and maintenance and $36,000 a year for interest. I still own the land. My R-multiple at this point, six years later, is -.69, assuming R = my down payment of $400,000 (-276,000/400,000 = -.69).
But -.69R doesn’t take into account the value of the land that I’m still holding. Well, let’s say that land dropped in value to $300,000 in 2009, so then my R multiple was -1.98, (-$92,000 for interest, taxes and maintenance, -$700,000 capital loss for -792,000/400,000).
Now let’s say I get an offer to buy the land today for $850,000 (net $780,000 on the sale transaction). Rather than calculate one R multiple figure for the entire holding period (which spans a market cycle), I prefer to calculate R-multiples by market trend. I’d keep the 2009 R multiple at -1.98 to measure performance in a down market and now I’ll calculate my R multiple since 2009, an up market, at +.74 (-$184,000 for interest, taxes and maintenance, + $480,000 net capital appreciation = 296,000/400,000).
By the way, those examples are actual transactions (though they were not mine) with rounded numbers for simplicity.
R-Multiple History
In general, residential real estate investing seems to have the following R multiple distribution pattern:
- many transactions with a low average reward, and
- many transactions with a low average loss, and
- a few transactions with a high average reward,
then, (for most with leverage)
- very few transactions (maybe only one) with an asteroid size loss.
Over time, this distribution sucks some people in (who haven’t experienced the losses) and it keeps other people out (who have experienced the losses). Some of the data I have gathered (see below) might be helpful to both groups.
I have 33 years of R-multiple data (though I didn’t think in terms of R for the first 23 years). While incomplete and approximate, this residential land, for-rent residential property and for-sale residential property data is still very useful. Depending on how one classifies market conditions, the data includes 2-5 market cycles. I gathered it from a few banks, several builders, developers and my own firms. The timeframe for each R-multiple is one year or less.4
Assuming R = 20% of initial value, here are the percent of transactions and the correlating R multiples -
| |
Up Market |
Down Market |
| For Sale |
99.5% +.25R |
91% +0.10R |
| |
0.5% -.75R |
6% -0.75R |
| |
| For Rent |
98% +.45R |
90% +0.25R |
| |
2% -.90R |
7% -.90R |
| |
| Land |
95% +0.20R |
10% +0.10R |
| |
4% -1.50R |
80% -2.50R |
| |
1% -2.50R |
10% -4.50R |
Interestingly, during the last down market of 2007-2011, land didn’t do as poorly on a historical basis, but for-sale houses did worse.
I reference these figures as a base case5 for evaluating investment opportunities. Can you see the dramatic differences that the market type makes in the R multiple distributions? Traders who understand Tharp Think will realize that the different market types require different strategies and different position sizing rules (or “policies” for institutions) to reach the same objectives. However, few real estate investors apply this kind of thinking to their business.
Conclusion
Taking a trading approach to residential real estate will provide an investor with a number of edges. Understanding some relatively simple principles like risk, risk adjusted returns and market types can be a huge advantage for the small minority of people who apply them to their investing.
In the second part of this article, which will appear in next week’s newsletter, we’ll continue exploring a trading approach to real estate investing by focusing on: how to adjust to changing market conditions, some typical real estate investing methods, the method I have used successfully for years and how you might find similar opportunities.
Footnotes:
- It is also probably much more useful than more “sophisticated” measures of risk. But that is a discussion for another day.
- They didn’t call it R, but they used the concept. They often use a term called “reserve”, short for a loan loss reserve, based on the idea that various asset classes have had quantifiable histories of loan losses.
- Only the most experienced or conservative consider recourse loans in their risk calculations. Most others simply don’t think about it much. A recourse loan is typical: it means the borrower, and often guarantors, are liable to repay the loan, whether the income and sale of the property does so or not.
- If anyone has any other R-multiple experience with real estate, or something similar, I’d love to hear from you.
- My own performance has been much better for land, much worse on rental properties, and better on for sale homes.
About the Author: Jim Weigel has had a career in real estate finance, development and construction. In addition to trading, he currently consults with companies in the construction industry. He lives with his family in the Denver, CO area.
Trading Education
Van Tharp considers his Oneness Awakening Weekends such a powerful process for transformation he even allows it as an entry point to be considered for Super Trader Program. If you have any interest in powerful personal transformations consider the weekend of August 10-11. The cost is only $195.
| August 10-11 |
Oneness Awakening Weekend
with Van Tharp |
August 16-18 |
Day Trading Systems
with Ken Long
Ken's workshops tend to sell out. Register soon to retain a seat.
|
August 19-21 |
Live Day Trading
with Ken Long
Day Trading Systems is a prerequisite to this course. You'll trade alongside Ken for 2-3 days.
|
October 3-5 |
Peak Performance 101
with Van Tharp |
| Berlin, Germany Workshops |
September 6-8 |
How to Develop a Winning Trading System
with Van Tharp and RJ Hixson
|
September 10-12 |
Blueprint for Trading Success
with Van Tharp and RJ Hixson
|
September 14-16 |
Forex Trading
with Gabriel Grammatidis
|
Register for all 3 and save $800!
|
To see the full schedule, including dates, prices, combo discounts and location, click here.
Trading Tip
 A Rare Occurrence Adds Fuel to a Rebounding Market A Rare Occurrence Adds Fuel to a Rebounding Market
by D. R. Barton, Jr.
View On-line
After taking the month of June off and spending the first half of July in recovery mode, the markets seem ripe to test and will most likely exceed the record highs set in May. On Monday, the S&P 500 traded up to within 3 points of its all-time high. According to Barron’s, this index has posted all-time record close.
As I mentioned in last week’s article, the Russell 2000 already started posting new record highs last week and did so for an impressive six straight days (seven days in a row for closing highs). The NASDAQ has also posted a new 12-year high on Monday though its recent highs are still a far cry from the all-time NASDAQ highs set back in 2000.
As we approach this record setting juncture, let’s take a look at three important developments that might help shape our expectations — one short-term, one intermediate and one longer-term.
My, That’s An Impressive Pop
Welles Wilder’s Relative Strength Index is a widely used momentum oscillator. Many folks have written about using this indicator as an extremely short-term overbought/oversold indicator, which is done by reducing Wilder’s prescribed default period of 14 daily bars down to two. The resulting indicator gives us a useful, albeit choppy, description of very near-term market rate of change (or momentum). Take a look at the chart below. It shows this indicator as applied to the S&P 500 cash index. paying special attention to the two circled areas:
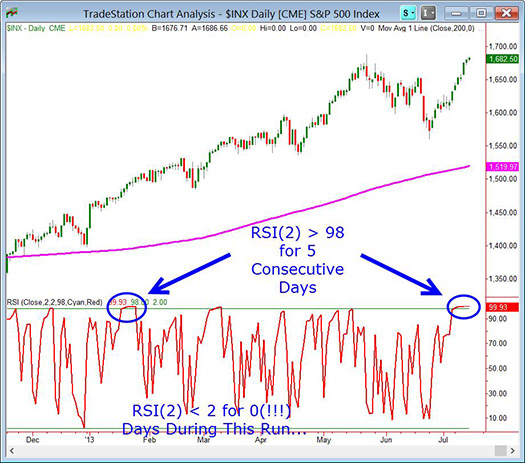
A string of five consecutive RSI(2) days is rare for an index. According to my research, it hasn’t happened since 1995 but in the first seven months of 2013, it has happened twice!
The other note at the bottom of this chart is a related reminder of how strong and one-way this market has been. While we’ve had two historic, five-day momentum pushes by the bull (at least by our RSI(2) indicator), the same indicator has never hit an extreme oversold level for even one day during the same time period. While this market will correct at some point, it may come later than some technicians think.
Going Against Conventional Wisdom by Going with the Flow
Almost all momentum oscillators seek to provide information on when an instrument is overbought or oversold in hopes of finding a point at which reversion toward the mean is a high probability. In other words, momentum oscillators tell us when price might move from an outer edge back to the middle. Ironically, such a long overbought streak like we have just had leads to an unexpected conclusion.
Where’s the irony here? When RSI(2) stays at an extreme for an extended period, history tells us there is usually follow-through strength for the next week or two. During the last six decades, this five-day RSI(2) > 98 pattern has happened a little more than once every other year. On average, four out of five of these occurrences have been accompanied by a market that keeps going up over the next week. Rather than reverting to the mean, this strong of an overbought market generates a strong tendency for momentum follow-through afterwards.
Could this time around, however, be different? Two mitigating factors could keep the 4 out of 5 probability event from occurring this time: Fed Chairman Bernanke is scheduled to testify before a joint session of congress on this week and there’s an inevitable test of the S&P 500 all-time from May 22nd. Any misplaced sigh or eye twitch on the part of Dr. Bernanke during his testimony Wednesday and Thursday could send the markets skyward or toward the rocky crevasse below. As for the S&P high retest, often initial tests will fail—meaning the market will not have a meaningful break through on the first try, but will have a pullback instead. A break may be more likely on the second test of the May 22 high.
Even with those caveats, the market’s momentum readings are pointing to short-term strength.
As always, your comments and feedback are welcome! Please send your thoughts to drbarton “at” vantharp.com
Great Trading,
D. R.
About the Author: A passion for the systematic approach to the markets and lifelong love of teaching and learning have propelled D.R. Barton, Jr. to the top of the investment and trading arena. He is a regularly featured guest on both Report on Business TV, and WTOP News Radio in Washington, D.C., and has been a guest on Bloomberg Radio. His articles have appeared on SmartMoney.com and Financial Advisor magazine. You may contact D.R. at "drbarton" at "vantharp.com".
Disclaimer
Matrix Insight
Van,
Been following you for years now. Love the book. I did not realize that you were such a mystic until I read Trading Beyond the Matrix. I always did better with my trading throughout the years when I was connected with my higher self. I knew this on the inside but continued to make the same mistakes over and over, always listening to the impatient rambler inside. In my case, I have made every possible mistake since 1998 that one can make. It's less acceptable for someone like me because I am also a statistician and Martial Artist!
So, in your book the most valuable concept for me was holding different parts of yourself in each hand by visualization, negotiating and clearing. I was able to clear some disruptive things. Within two weeks of trading options, I turned $350 into over $18,000. This has never happened. I was receiving flashes and insights just by being relaxed and centered. I was able to get the parts to talk and work together. Of course, knowing how to look at charts and studying market behavior for many years helped but this was the breakthrough.
I am very interested in receiving the oneness blessing.....asap.
Best wishes and peace profound!
Daniel M.
Editor's Note: Recently, we wrote to you to tell you about a new contest. We want to hear about the one most profound insight that you got from reading Van's new book, Trading Beyond the Matrix, and how it has impacted your life. If you haven't purchased Trading Beyond the Matrix yet, you can do so here. When you are ready to tell us about your insight, send an email to [email protected]. We are looking forward to hearing from you. If we pick your submission we will share it this newsletter.
 In Case You Missed It In Case You Missed It
Earlier this week, Forex Instructor, Gabriel Grammatidis wrote a short article about the reality of Forex Trading. You can read it here, as well as watch two trading videos below, in which Gabriel narrates two example trades from the systems he teaches in his workshop.
Busted4h
Dax 1m
Ask Van...
Everything we do here at the Van Tharp Institute is focused on helping you improve as a trader and investor. Consequently, we love to get your feedback, both positive and negative!
Click here to take our quick, 6-question survey.
Also, send comments or ask Van a question by clicking here.
Back to Top
Contact Us
Email us at [email protected]
The Van Tharp Institute does not support spamming in any way, shape or form. This is a subscription based newsletter.
To change your e-mail Address, e-mail us at [email protected].
To stop your subscription, click on the "unsubscribe" link at the bottom left-hand corner of this email.
How are we doing? Give us your feedback! Click here to take our quick survey.
800-385-4486 * 919-466-0043 * Fax 919-466-0408
SQN® and the System Quality Number® are registered trademarks of the Van Tharp Institute
Be sure to check us out on Facebook and Twitter!
 
Back to Top |


