Tharp's Thoughts Weekly Newsletter (View On-Line)
-
Article Market Condition: Bull Normal by Van K. Tharp, Ph.D.
-
-
-
Ken's Class VIDEO: Case Study on Core and Turbo Positions
Van Tharp Coming to Europe This September
Van does not take his workshops to Europe every year. But, this September he will be in Berlin, Germany for three powerhouse workshop events!
We'll have two primary Van Tharp workshops, How to Develop A Winning Trading System That Fits You and The Blueprint for Trading Success Workshop which forms the basis every trader can use to go from average to above-average. And we'll have three-days of Forex Trading Systems that will give you several systems you can trade immediately.
Check out the dates, pricing and links to more on each workshop
 Market Update for the Period Ending July 2, 2013 Market Update for the Period Ending July 2, 2013
Market Condition: Bull Normal
by Van K. Tharp, Ph.D.
View On-line
I always say that people do not trade the markets; they trade their beliefs about the markets. Consequently, I'd like to point out that these updates reflect my beliefs. I find the market update information useful for my trading, so I do the work each month and am happy to share that information with my readers.
If, however, your beliefs are not similar to mine, then this information may not be useful to you. If you are inclined to perform some sort of intellectual exercise to prove one of my beliefs wrong, simply remember that everyone can usually find lots of evidence to support their beliefs and refute others. Know that I acknowledge that these are my beliefs and that your beliefs may be different.
These updates are in the first issue of Tharp's Thoughts each month. This allows us to get the closing month's data. These updates cover 1) the market type (first mentioned in the April 30, 2008 edition of Tharp's Thoughts and readable on our web site), 2) the five-week status on each of the major U.S. stock market indices, 3) our four star inflation-deflation model plus John Williams' statistics, and 4) the movement of the dollar. I now report on the strongest and weakest areas of the overall market in a separate SQN® Report.—Van K. Tharp
Part I: Commentary—The Big Picture
I sent out a warning recently about the market decline. The market had gone from strong bull to neutral quite quickly, however, that warning went out at about the end of the decline. Since that time, it’s gone up and is now bull normal. But that means that the market is still down significantly from last month and volatility has gone up.
Fundamentally, I’m expecting interest rates to continue to rise later this year. The Federal Reserve has already stated that they’d stop their massive infusion of money into the market (which they do by purchasing as much as $85 billion in debt each month). Our official debt is nearly $17 trillion and has gone up about one trillion dollars in the past 12 months. Our unofficial debt is over $100 trillion. We are the largest debtor nation in the history of the world. Just 50 years ago, we were the largest creditor nation in the world.
According to the debt clock, our national debt stands at $16.89 trillion. That’s up more than $50 billion from last month. The US population remains at 316 million with taxpayers standing at 113.8 million. The Boomer retirement wave is in its earliest stages, as retirees now stand at 46.4 million. Disabled people collecting social security stands at 14.3 million, while food stamp recipients total 48.06 million so that’s 108.4 million people that are supported either by the government or the 113.7 million taxpayers. This means that 113.8 million workers are supporting 108.8 million other people through the government. But really, about 11 million taxpayers pay 90% of U.S. taxes. Do these numbers add up to you? Do they seem sustainable?
Here’s the update for some figures from the debt clock website so you can watch the changes over time. Some of the figures vary from month-to-month and may not totally make sense — those variations, however, tend to be relatively small. Besides, when you get into the trillions, rounding to the nearest ten billion mark just makes sense. I have no idea why the trade deficit jumped to a trillion and then back down to 708 billion.
The State of the United States |
Month Ending |
National Debt |
Federal Tax Revenue |
Federal Spending |
Trade Deficit |
Debt Per Family |
Savings per family |
Workforce (taxpayers) |
People supported by them |
July 31 2012 |
$15.93 trillion |
$2.364 trillion |
$3.632 trillion |
$810 billion |
$684,405 |
$4,854 |
|
|
Aug 31 2012 |
$16.00 trillion |
$2.374 trillion |
$3.585 trillion |
$797 billion |
$683,397 |
$4,784 |
|
|
Sept 30 2012 |
$16.08 trillion |
$2.367 trillion |
$3.645 trillion |
$793 billion |
$700,492 |
$4,727 |
|
|
Oct 31 2012 |
$16.04 trillion |
$2.426 trillion |
$3.550 trillion |
$776.6 billion |
$702,824 |
$4,667 |
|
|
Nov 30 2012 |
$16.17 trillion |
$2.438 trillion |
$3.545 trillion |
$741.3 billion |
$705,249 |
$4,607 |
|
|
Dec 30 2012 |
$16.42 trillion |
$2.452 trillion |
$3.540 trillion |
$740.7 billion |
$732,086 |
$5,789 |
|
|
Jan 31
2013 |
$16.50 trillion |
$2.495 trillion |
$3.541 trillion |
$740.9 billion |
$732,611 |
$5,725 |
|
|
Feb 28 2013 |
$16.66 trillion |
$2.494 trillion |
$3.540 trillion |
$728.2 billion |
$733,045 |
$5,672 |
|
|
Mar 28 2013 |
$16.75 trillion |
$2.51 trillion |
$3.569 trillion |
$723.7 billion |
$745,862 |
$7,611 |
|
|
Apr 30 2013 |
$16.83 trillion |
$2.53 trillion |
$3.580 trillion |
$1,045 billion |
$747,282 |
$7,779 |
113.7 million |
108.4 million
95.3% |
May 31 2013 |
$16.84 trillion |
$2.57 trillion |
$3.588 trillion |
$707.6 billion |
$748,828 |
$7,963 |
113.7 million |
108.4 million
95.3% |
Jun 30 2013 |
$16.89 |
$2.57 trillion |
$3.589 trillion |
$706.4 billion |
$747.867 |
$3,314 |
113.9 million |
108.8 million
95.6% |
Part II: The Current Stock Market Type Is Strong Bull Normal
Each month, I look at the market SQN® score for the daily percent changes in the S&P 500 Index over 200, 100, 50 and 25 days. For our purposes, the S&P 500 Index defines the market. The market SQN 200 and 100 are both bull, while the market SQN 50 is neutral and the shortest term, the market SQN 25 is in bear mode.
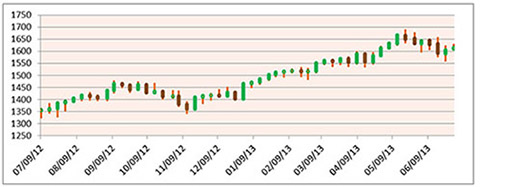
The first chart is a weekly bar chart of the S&P 500 with the last bar only being two days. Notice the beautiful uptrend. Also notice the last two weeks.
(To see the three following charts stacked and aligned, click here)
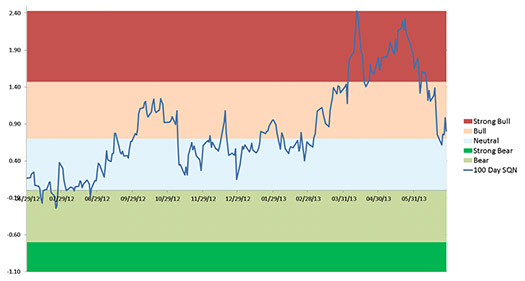
The next graph shows the market SQN 100 score. The July 1 reading was 0.86 (0.7 is neutral). The recent retracement is why the market SQN 25 and 50 scores are now bearish and neutral, respectively.
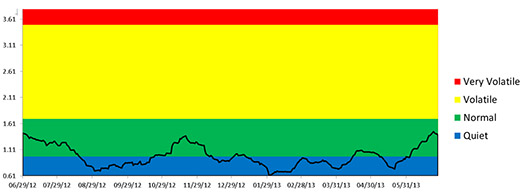
Lastly, let’s look at the market volatility. Market volatility has moved toward normal and could be volatile by next month.
(To see the three previous charts stacked and aligned, click here)
The next table shows the activity of the three major U.S. indices with the closing price from each recent Friday:
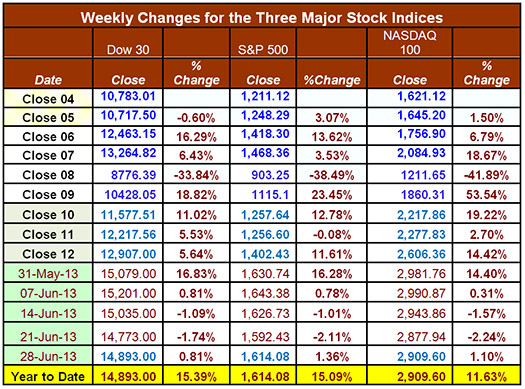
All three indices show solid gains for the year, all being up by double digits — which is usually a good year by itself.
Part III: Our Four Star Inflation-Deflation Model
In the simplest terms, inflation means that stuff gets more expensive, and deflation means that stuff gets cheaper. There’s a correlation between the inflation rate and market levels, so the inflation rate can help traders understand big-picture processes.
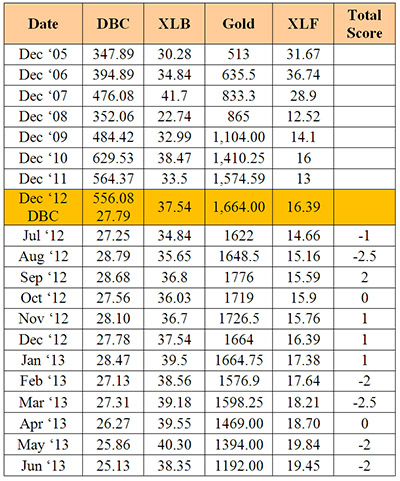
For this model, I have used the CRB:CCI data for years to measure the overall commodity price level, however, the CRB site does not seem to have any data past April 17. As a result, I have switched to the ETF called DBC to look at commodity prices. Let me know if you have some idea of what happened to the CCI.
Looking back over the most recent two-month and six-month periods provides the current month's score, given in the table below.
Month |
CRB2 |
CRB6 |
XLB2 |
XLB6 |
Gold2 |
Gold6 |
XLF2 |
XLF6 |
Total Score |
|
Lower |
Lower |
Lower |
Higher |
Lower |
Lower |
Lower |
Higher |
|
Mar-13 |
|
-1 |
|
+1/2 |
|
-1 |
|
-1/2 |
-2 |
Four out of the last five months signal deflation, which is not great. Even the Shadowstats.com estimate of inflation is getting lower. They show real inflation at about 5%, compared with government figures at about 1.5%.
Part IV: Tracking the Dollar
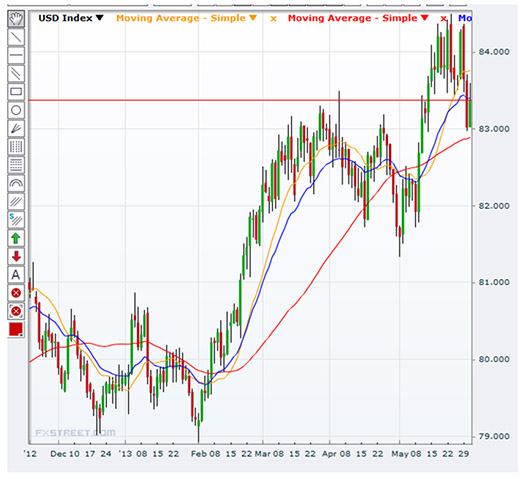
In May, the dollar had a pretty strong surge, moving above 84. However, it moved lower at the middle of June, touching 81. Though the Fed rumors of increasing interest rates has pushed it back up to almost 84. I’m going to India next week and a dollar is now worth about 60 rupees, up from about 53 the last time I was there.
General Comments
With the fundamental conditions we have in place, the market is a real crap shoot unless you do short-term trading with lots of low risk ideas. At some point in time, the Fed has to end their bond buying program, at which point interest rates will start to skyrocket and the market will crash. But who knows when that will happen? It could be this month or the market could go back to making new highs. Don’t bank on any long-terms trends staying in place.
Until next month, this is Van Tharp.
These monthly market updates are not intended for predictive purposes; rather, they’re intended to help traders decide which of their trading systems should work best in the current market conditions. In bear markets—which are almost always volatile by nature—shorter-term strategies, and those that allow going short, tend to work better than long-only or intermediate/longer-term systems.
Which of your trading systems fit this current market type? Of course, this question implies that you have multiple trading systems and that you know how they perform under various market conditions. If you haven't heard of this concept or the other concepts mentioned above, read my book, Super Trader, which covers these areas and more, so that you can make money in any kind of market condition.
Crisis always implies opportunity. Those with good trading skills can make money in this market—a lot of money. There were lots of good opportunities in 2012, and many more to come in 2013. Did you make money? If not, then do you understand why not? The refinement of good trading skills doesn't just happen by opening an account and adding money. You probably spent years learning how to perform your current job at a high skill level. Do you expect to perform at the same high level in your trading without similar preparation? Financial market trading is an arena filled with world-class competition. Additionally, and most importantly, trading requires massive self-work to produce consistent, large profits under multiple market conditions. Prepare yourself to succeed with a deep desire, strong commitment and the right training.
About the Author: Trading coach and author Van K. Tharp, Ph.D. is widely recognized for his best-selling books and outstanding Peak Performance Home Study Program—a highly regarded classic that is suitable for all levels of traders and investors. You can learn more about Van Tharp at www.vantharp.com. His new book, Trading Beyond The Matrix, is available now at matrix.vantharp.com.
Trading Education
The Frog day-trading system has multiple intraday opportunities every day the market is open. Positions are closed by the end of the day, so there’s no overnight risk or worrying about positions while you lay in bed at night. The Frog system is part of the Day-Trading Workshop in August.
July 13-14
SOLD OUT |
Core Trading Systems
with Ken Long
|
| August 10-11 |
Oneness Awakening Weekend
with Van Tharp |
August 16-18 |
Day Trading Systems
with Ken Long
Ken's workshops tend to sell out. Register soon to retain a seat.
|
August 19-21 |
Live Day Trading
with Ken Long
Day Trading Systems is a prerequisite to this course. You'll trade alongside Ken for 2-3 days.
|
October 3-14 |
Peak Performance 101, 202 and 203
Register for Peak 101 and get on the waiting list for 202 and 203 now.
|
| Berlin, Germany Workshops |
September 6-8 |
How to Develop a Winning Trading System
with Van Tharp and RJ Hixson
|
September 10-12 |
Blueprint for Trading Success
with Van Tharp and RJ Hixson
|
September 14-16 |
Forex Trading
with Gabriel Grammatidis
|
Register for all 3 and save $800!
|
To see the full schedule, including dates, prices, combo discounts and location, click here.
Trading Tip
June 2013 SQN® Report
by Van K. Tharp, Ph.D.
View On-line
There are numerous ETFs that now track everything from countries, commodities, currencies and stock market indices to individual market sectors. ETFs provide a wonderfully easy way to discover what’s happening in the world markets. Consequently, I now use the System Quality Number® (SQN®) score for 100 days to measure the relative performance of numerous markets in a world model.
The SQN 100 score uses the daily percent change for a 100-day period. Typically, an SQN score over 1.45 is strongly bullish and a score below -0.7 is very weak. We use the following color codes to help communicate the strengths and weaknesses of the ETFs:
- Green: ETFs with very strong SQN scores (0.75 to 1.5).
- Yellow: ETFs with slightly positive SQN scores (0 to 0.75).
- Brown: ETFs with slightly negative SQN scores (0 to -0.7).
- Red: Very weak ETFs that earn negative SQN scores (< -0.7).
The world market model spreadsheet report below contains most currently available ETFs; including inverse funds, but excluding leveraged funds. In short, it covers the geographic world, the major asset classes, the equity market segments, the industrial sectors and the major currencies.
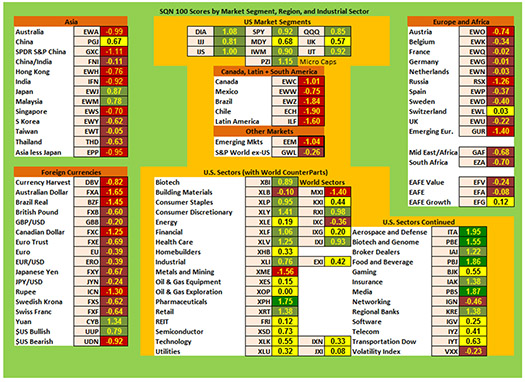
World Market Summary
All you have to do is look at the first part of the report to get the whole story. First, most of the world is looking pretty pathetic. The US, now light green and yellow, is essentially the only place that looks positive at all. So despite the fact that everything has gone from dark green to light green and yellow, most of the world is so dismal that the US looks good. But even though, the US is light green and the short term trend is down.
Aside from the US, we just have Japan and Malaysia showing light green and China and Switzerland showing yellow. The rest of the world is brown or red.
Pharmaceuticals, Aerospace, Biotech, Media, and Food and Beverage are the strongest sectors. But if you were invested in those sectors with tight stops, you were stopped out in late June. So do you want to get back into those sectors in this climate? Swing and day trading are the only places to be right now. What’s interesting is that even though volatility has gone from quiet to normal, VXX is still brown (but it was one of the worst sectors).
Currencies are all particularly weak with only the Chinese Yuan and the US Dollar being light green. No currencies are yellow. The Australian dollar is one of the worst places to be and the worst country is Brazil.
(To see a larger version of this chart, click here)
The next chart shows real estate, debt instruments, commodities and the top and bottom ETFs for the past 100 days.
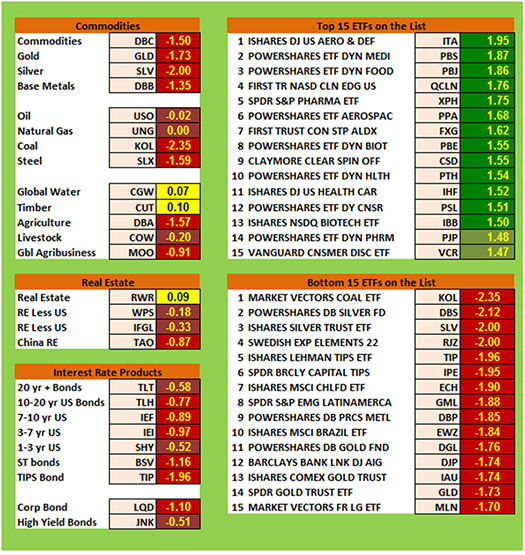
I can’t remember an SQN report in which commodities looked this weak. Silver has a market SQN 100 score of -2 which is about as negative as I have seen the precious metals. But it’s not the worst commodity — coal is at -2.35. The only neutral commodities are timber and global water, but those were much stronger last month.
Bonds all look weak with almost everything being red. Junk bonds are brown and very long-term bonds are also brown.
Finally, real estate is yellow, but that is only because of the US real estate. Chinese real estate is red and the rest are brown.
When we look at the strongest and weakest sectors, there are no dark green areas above +2. The green areas tend to be the sectors I mentioned above, food, drug, aerospace and defense, health care, and pharmaceuticals. Last month, the top 15 all had scores above 2.2, which means everything got weaker.
Amazingly, we are now seeing red ETFs with scores of -2.0 or weaker. Negative scores seldom go below 2.0, but we have four of them this month and ten below -1.8. Again, they tend to be the sectors I’ve mentioned, coal, silver, inflation protected bonds (bonds are weak and we have a deflationary environment), Sweden and Brazil, and even gold is on list of the weakest sectors.
What's Going On?
Overall, if you have been fully invested in US equities markets, you could have made some good yearly gains. Those who tend to buy and hold, however, might find that their gains by the end of the year are much, much less or even negative. Remember that pension money has stopped flowing into the market for now. So overall, except for the Fed, there should be a net outflow because of the number of retirees who now need their investments to live on.
There was no crisis at the last treasury auction and the Federal Reserve is still buying bonds. But who knows how long that will continue?
Until next month’s SQN report, this is Van Tharp.
The markets always offer opportunities, but to capture those opportunities, you MUST know what you are doing. If you want to trade these markets, you need to approach them as a trader, not a long-term investor. We’d like to help you learn how to trade professionally, trying to navigate these markets without an education is hazardous to your wealth.
All the beliefs given in this update are my own. Though I find them useful, you may not. You can only trade your beliefs about the markets.
Ken's Class
Case Study on Core and Turbo Positions
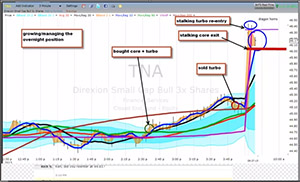 In this six minute video, Ken provides a case study from early last week on core and turbo positions. On the first day of momentum after a strong selloff, Ken finds opportunities in his intraday “turbo” trading to hold onto overnight sometimes for a “core” position. To hold a position overnight, however, he accounts for the risks that opening gaps present. He then manages the core position the next day as well as looks for additional turbo trades. In this six minute video, Ken provides a case study from early last week on core and turbo positions. On the first day of momentum after a strong selloff, Ken finds opportunities in his intraday “turbo” trading to hold onto overnight sometimes for a “core” position. To hold a position overnight, however, he accounts for the risks that opening gaps present. He then manages the core position the next day as well as looks for additional turbo trades.
Click here to watch the video.
Ask Van...
Everything we do here at the Van Tharp Institute is focused on helping you improve as a trader and investor. Consequently, we love to get your feedback, both positive and negative!
Click here to take our quick, 6-question survey.
Also, send comments or ask Van a question by clicking here.
Back to Top
Contact Us
Email us at [email protected]
The Van Tharp Institute does not support spamming in any way, shape or form. This is a subscription based newsletter.
To change your e-mail Address, e-mail us at [email protected].
To stop your subscription, click on the "unsubscribe" link at the bottom left-hand corner of this email.
How are we doing? Give us your feedback! Click here to take our quick survey.
800-385-4486 * 919-466-0043 * Fax 919-466-0408
SQN® and the System Quality Number® are registered trademarks of the Van Tharp Institute
Be sure to check us out on Facebook and Twitter!
 
Back to Top |


