Tharp's Thoughts Weekly Newsletter (View On-Line)
-
Article Why Band Trading Works, Part 1 by Ali Moin-Afshari
-
-
Trading Tip A Deeper Look at Unemployment Numbers by D.R. Barton, Jr.
-
Mailbag Dealing With Your Relatives
 This summer, Ken Long presents two high-caliber systems workshops, plus live day trading. This summer, Ken Long presents two high-caliber systems workshops, plus live day trading.
Longer Term Systems: Core Trading in July
These systems can be operated largely outside of market hours in an hour per week—or less. One system only requires adjusting its positions annually—that’s less than an hour a year!
Day Trading Systems: Three days of intensive training in the FROG and RLCO, followed by three days of live trading.
For more information and a complete list of our workshops, click here.
 Why Band Trading Works Why Band Trading Works
Part 1 - Trends
by Ali Moin-Afshari
View On-line
In this four-article series, I will discuss my belief that band trading works. My goal is to provide a concise overview of several band techniques and the strengths and weaknesses of each.
To start the series, I will discuss trends because without trends, bands would not work. In the remaining articles in the series, I will show how various bands work, discuss a lesser known type of band which I use in my own trading, and how bands can help improve the performance of trend-following systems.
Band trading systems depend on trends to work so let’s leave bands alone at first and answer a more fundamental question: why do trend systems work? Once we answer that question, then we can evaluate how bands might help trend systems. Without a trend, bands can be as useless as any other analysis technique in a trend-less market.
Trend Trading
Trends are the basis of many successful trading programs. Being able to identify the trend is important if you want to trade “the right side of the market”.
Trend systems work because:
- Fundamental factors tend to move prices.
- Money moves the markets. Most trends are supported by the flow of investor funds. This causes both short-term noise and the long-term trend. As a trend becomes clearer to the general public, additional money typically flows in to help continue the trend.
- Market prices are not normally distributed, — they tend to have fat tails. A fat tail means that there is an unusually large number (by statistically normal standards) of directional price moves that are larger and/or longer than would occur with randomly distributed prices. Fat tails generate exceptional profits which are essential to most trend systems’ long-term success.
Trend trading works when markets are trending and stops working in sideways conditions. When markets move sideways, it’s best to use other methods and when markets are trending, there is no one trending method that is always best. I have found that most trend-following methods have similar returns over time but also have different risk profiles. Risk profiles and trading frequency distinguish one trend method from another.
One way to measure trends is with moving averages. By netting all prices, a moving average removes noise and shows the underlying price direction.
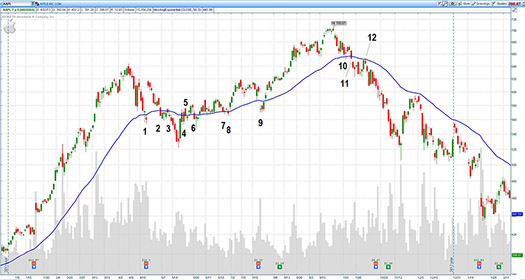
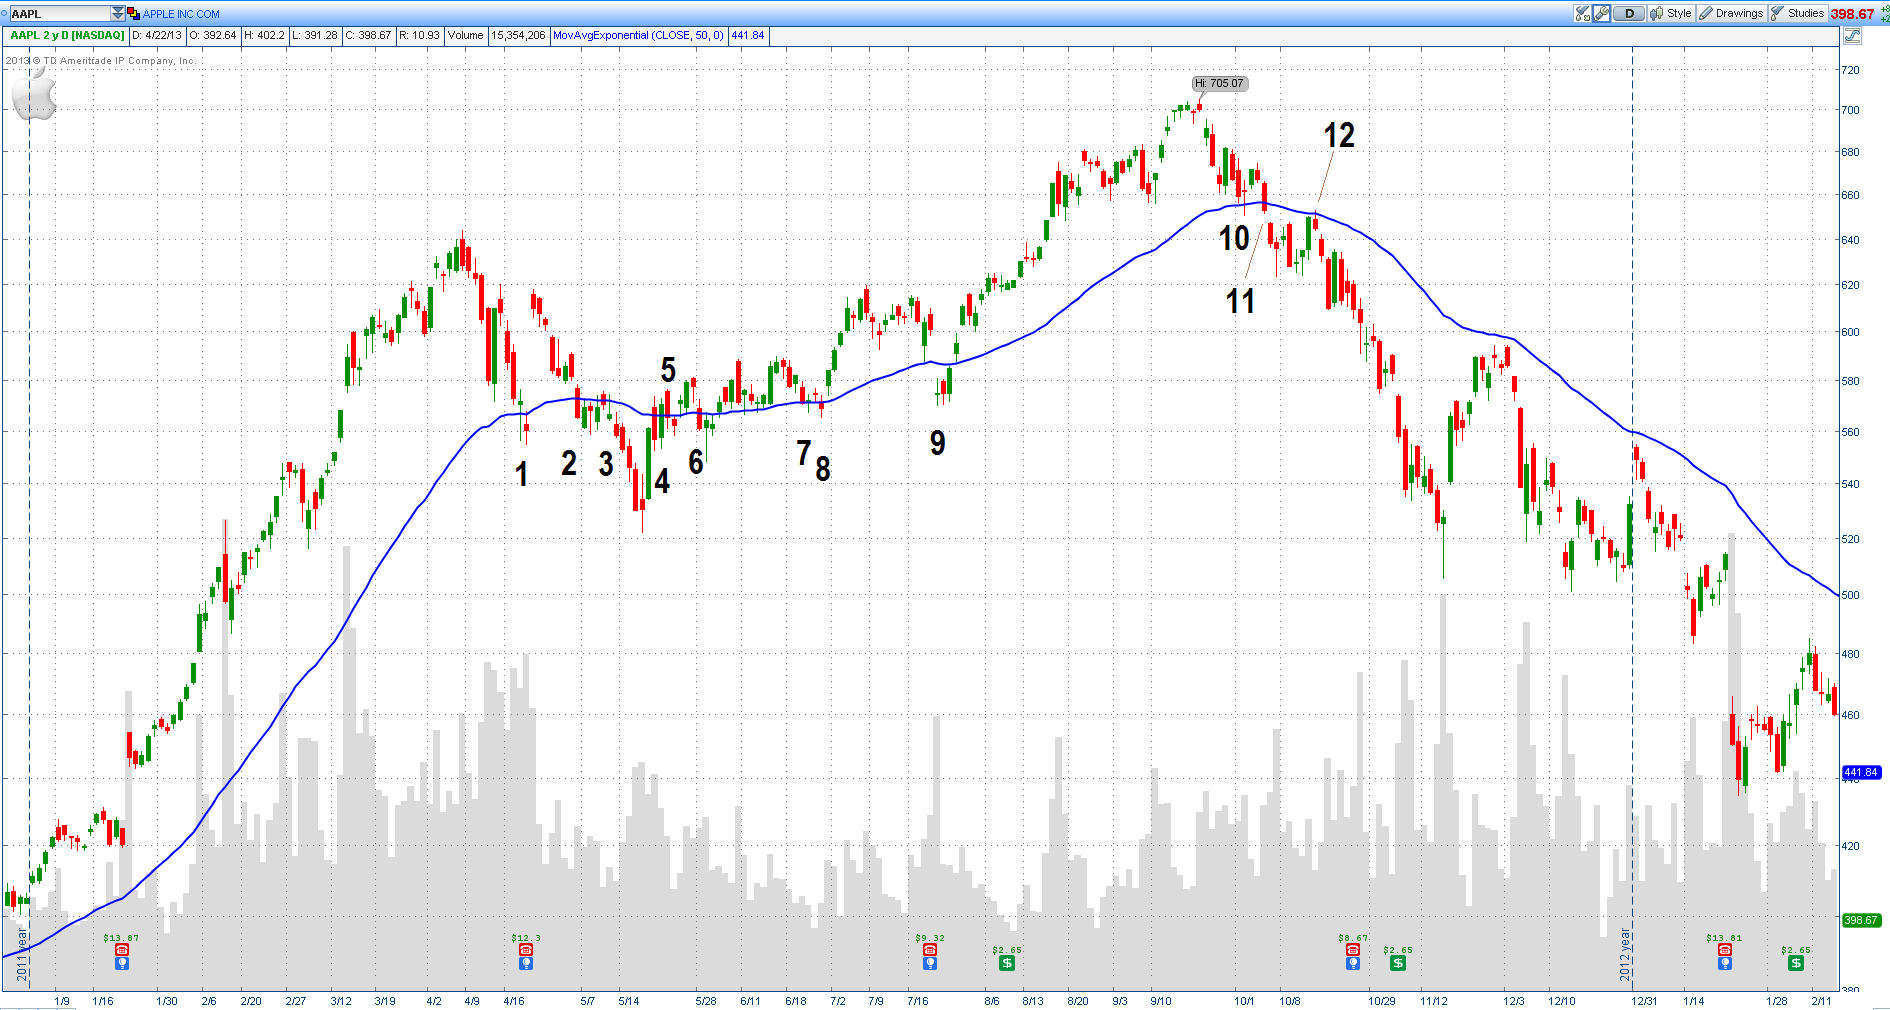
Figure 1: Daily Chart of Apple Computer with 50-day Exponential Moving Average
(For a larger version of this chart, click here)
Using Moving Average for Entry and Exit Signals
The basic idea behind using the moving average as a trend signal is to be long when prices are above the average and short when below. A very simple set of rules would be:
- Buy: when price crosses above the trendline.
- Sell: when price crosses below the trendline.
By following these rules, you can see in Figure 1 how Apple’s price dropped below the EMA ten times over six months before it finally established a new bear trend at bar 11 and stabilized at bar 12. If “crossing” the moving average was your only criteria, this scenario had ten losing short trades before catching the bear trend at bar 11.
At this point, you must make some important decisions:
- Do you place a trade the moment price crosses the trendline during the trading session?
- Or do you believe in the importance of the closing price and wait for the price to close on the other side of the moving average?
- Would you prefer to wait for the trendline to establish a direction before placing a trade?
If you subscribe to the closing price belief, your trading rules will be:
- Buy: when price closes above the trendline.
- Sell: when price closes below the trendline.
If you gravitate toward the moving average direction belief and also believe in closing prices, your rules will turn into:
- Buy: when the change in the trendline is up AND price closes above the trendline.
- Sell: when the change in the trendline is down AND price closes below the trendline.
A moving average tends to lag price movement and this characteristic is both a disadvantage and an advantage. Figure 1 shows price crossing below the 50-day EMA at bar #10—a few days ahead of the point where the average turned down in October. On the other hand, the benefit using the moving average signal is that the trend turn is clear and more stable. During April (bars labeled 1-3) and July (bars labeled 7-9), price crossed back and forth through the EMA, but in both cases the EMA maintained its direction; therefore the trend signal remained the same.
Results Profile of a Simple Trend System
To show what kind of results you might get with a simple moving average system, I backtested a simple trend following system on ten years of Nasdaq 100 futures data. I used a 50-day calculation period for the MA because typically, many traders pay attention to it and it seems to be fast enough to identify major price trends. Buy and sell signals were generated from the direction of the trendline. For this test, I assumed zero slippage and zero transaction fees.
Due to space limitations, I cannot present all of the data and other details of the test, but here are the results:
| Number of Trades |
142 |
| Number of Winning Trades |
43 |
| Percentage of Winning Trades |
30.2% |
|
| Average Winning Trade |
$454.26 |
| Average Losing Trade |
-$52.38 |
| Win/Los Ratio |
2.32 |
|
| Expectancy |
1.15 |
| SQN |
2.54 |
| Average Bars in Winners |
34.67 |
| Average Bars in Losers |
5.61 |
|
| Consecutive Winners |
7 |
| Consecutive Losers |
11 |
Figure—2: Profile of a Moving Average System
These results are consistent with other similar, well-documented trend system results in published literature. In general, trend-following systems generate this same basic profile:
- The percentage of profitable trades is low, often about 30%, sometimes less.
- On average, winning trades are held much longer than losing trades.
- The average winning trade must be significantly larger than the average losing trade to produce a positive expectancy. Given only 30% profitable trades, the ratio must be greater than 100:30 (or 10:3) to be profitable.
- There are lots of losing trades and long losing streaks in trend systems.
Many traders have tried improving on the above general profile with some success, but not without changing the risk characteristics of trend-following systems. For example, you can add any or both of the following measures:
- Add a profit taking exit.
- Add a more complex or adaptive stop loss.
Both measures, however, reduce or eliminate the chance of capturing the important fat tails which then adversely affects the long-term profitability of the system.
Summary
In this article, we looked briefly at price trends and how using moving averages can help monitor trends or even be the basis for a simple trading system.
In part two of this series, we will study some popular band and channel trading techniques and analyze how they might improve the performance of a trend following system.
“It is not the strongest of the species that survive, nor the most intelligent, but the ones most responsive to change.”
– Charles Darwin
About the Author: Ali is an IT architect based in Toronto, Canada. He started trading options in 2006. Despite early success, he realized he needed both a deeper understanding of self and of trading to ensure continued success. Reading Dr. Tharp’s books brought him to Cary, North Carolina to take various Van Tharp Institute courses. Ali has spent the past five years studying and perfecting his trading. He plans to trade full time after completing his current technology consulting project.
Trading Education
$700 Discount on Core Trading Systems Ends Soon
We've had a cancellation that has opened up one seat in Peak Performance 101, 202 and 203 in June. These workshop have been sold out for months! If you would like to attend please contact us at [email protected] or better yet, call 919-466-0043. The series starts next Thursday, the 20th.
|
July 13-14 |
Core Trading Systems
Longer Term Trading Systems from Ken Long
Even if you intend to trade shorter term, this workshop acts as a rock-solid foundation to trade swing systems later on.
|
August 16-18 |
Day Trading Systems
with Ken Long
|
August 19-21 |
Live Day Trading
with Ken Long
Day Trading Systems is a prerequisite to this course.
|
October 3-14 |
Peak Performance 101, 202 and 203
Register for Peak 101 and get on the waiting list for 202 and 203 now.
|
| Berlin, Germany Workshops |
September 6-8 |
How to Develop a Winning Trading System
with Van Tharp and RJ Hixson
|
September 10-12 |
Blueprint for Trading Success
with Van Tharp and RJ Hixson
|
September 14-16 |
Forex Trading
with Gabriel Grammatidis
|
Register for all 3 and save over $800!
|
To see the full schedule, including dates, prices, combo discounts and location, click here.
Trading Tip
A Deeper Look at Unemployment Numbers —
And a Surprise Conclusion
by D. R. Barton, Jr.
View On-line
On the first Friday of every month, the Bureau of Labor Statistics (BLS) releases the U.S. monthly data on Non-Farm Payrolls and the all-important Unemployment number. It is easily the most watched economic report each month, and the one that has the best chance to move markets.
The unemployment rate is, of course, an important indicator of economic health and it has ongoing importance to the politicos on both sides of the aisle. But for the moment, it has a major influence on the financial markets for one reason — Fed Chairman Bernanke and his committee have made a public declaration that “accommodative monetary policy” will stay in force until the unemployment rate reaches a threshold level of 6.5%. Until further notice, the global equities markets are responding to every syllable uttered that could indicate when the Fed will cut back on this intravenous injection of monetary glucose.
The Fed released the following statement about using an unemployment rate target, saying it was in line with their dual mandate from the Federal Reserve Act:
"The Board of Governors of the Federal Reserve System and the Federal Open Market Committee shall maintain long run growth of the monetary and credit aggregates commensurate with the economy's long run potential to increase production, so as to promote effectively the goals of maximum employment, stable prices and moderate long-term interest rates."
In fairness to those who see three goals in the statement above, the Fed combines stable prices and moderate long-term interest rates into one metric called “inflation” and hence a “dual mandate” to maximize employment and “control” inflation in a very Goldilocks fashion — not too hot or not to cold, but “just right.”
As for unemployment, the BLS released its most recent report last Friday and the current rate is 7.6%. Both supporters and detractors of the current labor statistics generation will tell you that there is much wrong with the absolute unemployment number that the BLS reports.
Today’s article is not about nit-picking the unemployment number (okay, maybe just a little). But we do want to put it on a level playing field with some other well-publicized numbers out of Europe and see if we can draw some conclusions about when the Fed-induced sugar high might start to recede.
Wow — There Are a Lot of Unemployed Folks Out There…
Cool chart alert! Long-suffering readers of these articles know that I’m a sucker for a great graphic — one that really presents data well. The following spider graph from Bloomberg shows, in a very compelling way, the widening of the employment gap between northern and southern European Union (EU) countries:
Please note that the numbers in the spider graph below reflect the percent of employable citizens who are working — which is a very different number than the BLS’s 7.6% unemployment figure for the U.S. (we’ll dig deeper into that difference next week).
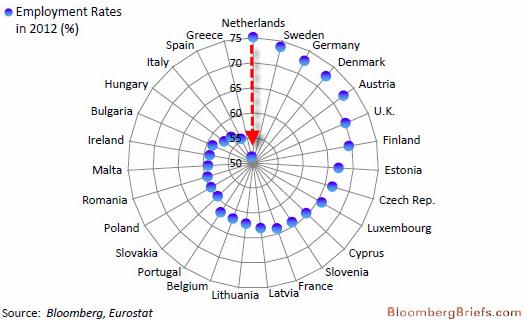
At the top of the chart, the highest employment level of all employable citizens (roughly — those over 16 years old and not institutionalized) is among the Dutch, with the Netherlands weighing in at 75.1%. Going clockwise, we see the other EU nations in descending order of employment all the way down to Greece’s anemic 51.3% rate. While it’s not perfect, there’s a strong relationship between generally higher employment rates in northern Europe and lower rates in southern and eastern Europe.
We’ll try to construct some similar figures for U.S. employment next week but let’s make two broad conclusions based on the employment figures in the US and Europe:
- EU austerity measures have resulted in the problems seen in the spider graph above. With reduced employment comes lower consumption and a weakening of even the northern EU economies that sell a lot of stuff to their EU neighbors. A growing trend toward incentivized growth could dig the EU out of its recession (and may be well underway already)…
- The U.S. is still distant from the Fed’s stated goal of 6.5% unemployment. But as we’ll see next week, the Fed may still have some employment number wrangling up its sleeve to assure that the proverbial printing presses keep roaring.
As always, your comments and feedback are welcome! And if you have any stats on U.S. employment rates as a percent of total employable population – please send them over! They might enhance everyone’s understanding of this beguiling number and add to the research I’ve already done. Please send comments or data to drbarton “at” vantharp.com
Great Trading,
D. R.
About the Author: A passion for the systematic approach to the markets and lifelong love of teaching and learning have propelled D.R. Barton, Jr. to the top of the investment and trading arena. He is a regularly featured guest on both Report on Business TV, and WTOP News Radio in Washington, D.C., and has been a guest on Bloomberg Radio. His articles have appeared on SmartMoney.com and Financial Advisor magazine. You may contact D.R. at "drbarton" at "vantharp.com".
Disclaimer
Mailbag
We received the following letter in response to Dr. Tharp's article, Memory is Made Up. We always appreciate the feedback we receive from our readers, if you ever have any questions or comments, we would love to hear from you! Please send an email to [email protected].
Dealing With Your Relatives
When I was about 18 years old, thinking a lot about time and truth, I concluded that almost everything was relative. So past memories are likely also relative I think.
You are saying something similar. ACIM talks about two existing sides to "mindkind" — an immortal side and a transient side. Stocks are certainly in the relative and transient side. It is not surprising that your memory may be flawed. Every person's memory likely is. For that is not memory's purpose, rather its purpose is to use in an relative and subjective story interpretation of what really happened as the raw materials of the mind-objects world that you seem to live in each day.
We all build our own experience, interpretation by interpretation. Such is human nature I suspect. The importance to the real you is strictly about your lessons from the remembered event.
An interesting book I just read, had a sidebar story about blind people who at 30 could suddenly see due to medical miracles — what did they see? Not at all what one would think and they didn't trust their vision knowing it to be an interpretation against the remembered stories they had already experienced while blind. It appears that the entire universe we live with is our own creation in our mind that shares enough characteristics with each other so that we can communicate and realize that there is other intelligent life out there. But our mind reality is most likely unique to us through our interpretation. So even our own created world can have infinite interpretations in which some things appear to exist or not exist. When we change our beliefs and other mind-objects, our world will shift just as the light changes and colors change in a 30 year-old's ability to express what they see for the first time. That is, our interpretation is also relative.
People troubled by ghostly images and the science of how they create what they see and the apparent egos that create multiple interpretations of reality (that we call multiple personalities) also seems to hint that what we see is what we want to see. Positive thinking and the law of attraction may work that way as well. It is not the real world that changes, but what we see in that world. That is we change our interpretation and our world changes to match our needs. None of our minds can tell the difference between what we imagine and what we interpret. My elderly mom experiences bleed-through of her dreams and her waking life. That is the transient part, but the love that my mom and I still feel for each other shines through as strongly as ever.
Quantum mechanics is troubling some scientists today because it has no time in the mathematical equations that govern us and yet seem to prove out so well in experiments. It says that interpretation of the experimenter is not separate from the world seen in his experiment. So is time itself relative? Is it merely the speed of our own interpretation and story making of our experienced world? And perhaps the famous "collapse of the wave equation" problem is simply one of interpretation — to each to his own.
I enjoyed Van's story about his stock and memory adventures.
—From a long-time Tharp’s Thoughts reader, "L7"
Ask Van...
Everything we do here at the Van Tharp Institute is focused on helping you improve as a trader and investor. Consequently, we love to get your feedback, both positive and negative!
Click here to take our quick, 6-question survey.
Also, send comments or ask Van a question by clicking here.
Back to Top
Contact Us
Email us at [email protected]
The Van Tharp Institute does not support spamming in any way, shape or form. This is a subscription based newsletter.
To change your e-mail Address, e-mail us at [email protected].
To stop your subscription, click on the "unsubscribe" link at the bottom left-hand corner of this email.
How are we doing? Give us your feedback! Click here to take our quick survey.
800-385-4486 * 919-466-0043 * Fax 919-466-0408
SQN® and the System Quality Number® are registered trademarks of the Van Tharp Institute
Be sure to check us out on Facebook and Twitter!
 
Back to Top |


