Tharp's Thoughts Weekly Newsletter (View On-Line)
-
Article Market Condition: Strong Bull Quiet, by Van K. Tharp, Ph.D.
-
-
-
-
 This summer, Ken Long presents two high-caliber systems workshops, plus live day trading. This summer, Ken Long presents two high-caliber systems workshops, plus live day trading.
Longer Term Systems: Core Trading in July
These systems can be operated largely outside of market hours in an hour per week—or less. One system only requires adjusting its positions annually—that’s less than an hour a year!
Day Trading Systems: Three days of intensive training in the FROG and RLCO, followed by three days of live trading.
For more information and a complete list of our workshops, click here.

Market Update for Period Ending June 1, 2013
Market Condition: Strong Bull Quiet
by Van K. Tharp, Ph.D.
View On-line
I always say that people do not trade the markets; they trade their beliefs about the markets. Consequently, I'd like to point out that these updates reflect my beliefs. I find the market update information useful for my trading, so I do the work each month and am happy to share that information with my readers.
If, however, your beliefs are not similar to mine, then this information may not be useful to you. If you are inclined to perform some sort of intellectual exercise to prove one of my beliefs wrong, simply remember that everyone can usually find lots of evidence to support their beliefs and refute others. Know that I acknowledge that these are my beliefs and that your beliefs may be different.
These updates are in the first issue of Tharp's Thoughts each month. This allows us to get the closing month's data. These updates cover 1) the market type (first mentioned in the April 30, 2008 edition of Tharp's Thoughts and readable on our web site), 2) the five-week status on each of the major U.S. stock market indices, 3) our four star inflation-deflation model plus John Williams' statistics, and 4) the movement of the dollar. I now report on the strongest and weakest areas of the overall market in a separate SQN® Report. I may come out with that report twice a month if there are significant market changes.—Van K. Tharp
Part I: Commentary—The Big Picture
I’m a little nervous about calling this market strong bull. It’s now June and the seasonal tendency for the stock market has clearly ended. Pension money is no longer flowing into the market to support it; however, the Federal Reserve is still buying 85 billion dollars’ worth of bonds every month. The market over the last few weeks has been down sharply, but nevertheless, it is relatively quiet and the 100-day market SQN is still reading strong bull with an SQN value of over 2.
Fundamentally, we are in as bad of shape as ever but fundamentals are fairly meaningless right now, at least in the short term. Our official debt is nearly 17 trillion dollars and has gone up about a trillion dollars in 12 months. Our unofficial debt is over 100 trillion dollars. That makes us the largest debtor nation in the history of the world! Over 50 years ago, however, the US was the largest creditor nation in the world.
In the last few weeks, Bernanke commented on a possible slowdown of QE and that has impacted the markets. For the first time in 13 months, 10-year treasury notes broke above 2% as investors stopped buying them.
According to the debt clock, our national debt stands at $16.84 trillion. The US population remains at 316 million with taxpayers standing at 113.7 million. The Boomer retirement wave is in its earliest stages, as retirees now stand at 46.3 million. Disabled people collecting social security stands at 14.2 million, while food stamp recipients total 47.9 million; that’s 108.4 million people that are supported by the government, actually by those 113.7 million taxpayers. This means that 113.7 million workers are supporting 108.4 million other people through the government. But really about 11 million taxpayers pay 90% of U.S. taxes. Do these numbers add up to you? Do they seem sustainable?
Here’s the update for some figures from the debt clock website so you can watch the changes over time. Some of the figures vary from month-to-month and may not make total sense— those variations, however, tend to be relatively small but not in every case. I have no idea why the trade deficit jumped to a trillion and then back down to 708 billion.
The State of the United States |
Month Ending |
National Debt |
Federal Tax Revenue |
Federal Spending |
Trade Deficit |
Debt Per Family |
Savings per family |
Workforce (taxpayers) |
People supported by them |
July 31 2012 |
$15.93 trillion |
$2.364 trillion |
$3.632 trillion |
$810 billion |
$684,405 |
$4,854 |
|
|
Aug 31 2012 |
$16.00 trillion |
$2.374 trillion |
$3.585 trillion |
$797 billion |
$683,397 |
$4,784 |
|
|
Sept 30 2012 |
$16.08 trillion |
$2.367 trillion |
$3.645 trillion |
$793 billion |
$700,492 |
$4,727 |
|
|
Oct 31 2012 |
$16.04 trillion |
$2.426 trillion |
$3.550 trillion |
$776.6 billion |
$702,824 |
$4,667 |
|
|
Nov 30 2012 |
$16.17 trillion |
$2.438 trillion |
$3.545 trillion |
$741.3 billion |
$705,249 |
$4,607 |
|
|
Dec 30 2012 |
$16.42 trillion |
$2.452 trillion |
$3.540 trillion |
$740.7 billion |
$732,086 |
$5,789 |
|
|
Jan 31
2013 |
$16.50 trillion |
$2.495 trillion |
$3.541 trillion |
$740.9 billion |
$732,611 |
$5,725 |
|
|
Feb 28 2013 |
$16.66 trillion |
$2.494 trillion |
$3.540 trillion |
$728.2 billion |
$733,045 |
$5,672 |
|
|
Mar 28 2013 |
$16.75 trillion |
$2.51 trillion |
$3.569 trillion |
$723.7 billion |
$745,862 |
$7,611 |
|
|
Apr 30 2013 |
$16.83 trillion |
$2.53 trillion |
$3.580 trillion |
$1,045 billion |
$747,282 |
$7,779 |
113.7 million |
108.4 million
95.3% |
May 31 2013 |
$16.84 trillion |
$2.57 trillion |
$3.588 trillion |
$707.6 billion |
$748,828 |
$7,963 |
113.7 million |
108.4 million
95.3% |
Part II: The Current Stock Market Type Is Strong Bull Normal
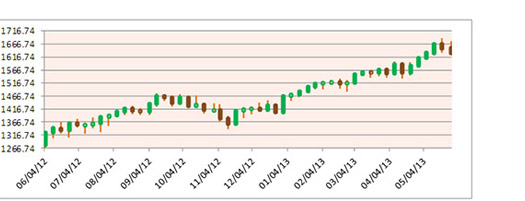
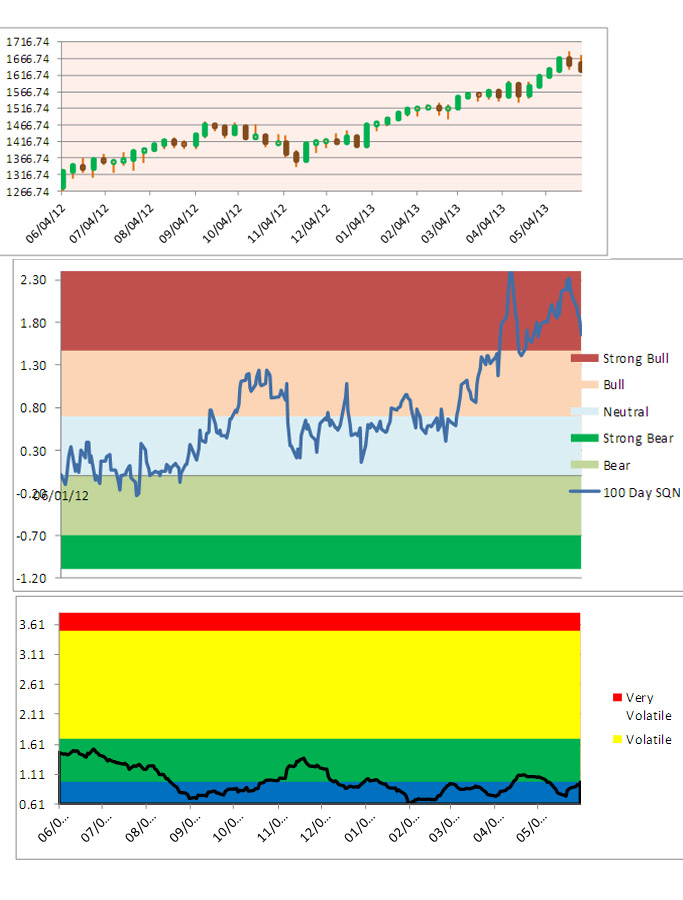
Each month, I look at the market SQN® score for the daily percent changes in the S&P 500 Index over 200, 100, 50 and 25 days. For our purposes, the S&P 500 Index defines the market. The market SQN for 200 days and 100 days are both strong bull, while the market SQN for 50 days and 25 days have both deteriorated to bull territory.
The first chart is a weekly bar chart of the S&P 500 with the last bar only being two days. Notice the beautiful, long uptrend and also notice the last two weeks.
(to see the three following charts stacked and aligned, click here)
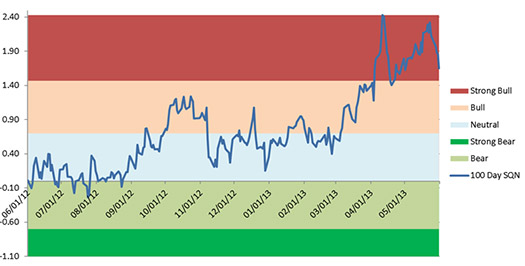
The next graph shows the 100 day market SQN score. The reading is currently 1.65 but that’s down from its high of 2.43 on April 11th. The recent retracement is why the market SQN scores for 50 days and 25 days came down to the bull zone.
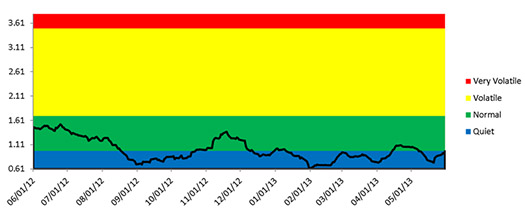
Lastly, let’s look at the market volatility. Market volatility remains quiet, although it has increased and is now near the normal zone, as shown in the chart below.
(to see the three previous charts stacked and aligned, click here)
The next table shows the activity of the three major U.S. indices at the closing Friday of each week:
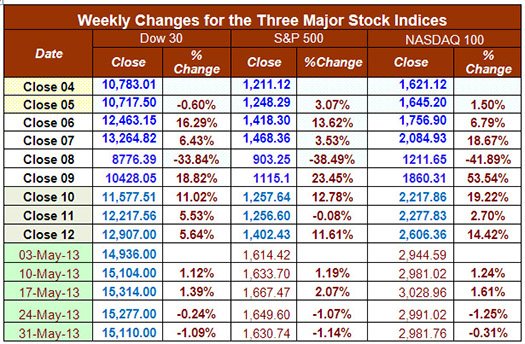
All three indices show solid gains for the year, each up by double digits—which is usually a good year by itself. The S&P 500 has been hitting new highs and both the DOW and the S&P 500 are showing double digit gains over just a three-month period. The NASDAQ 100 includes AAPL or else it would be doing the same.
Part III: Our Four Star Inflation-Deflation Model
In the simplest terms, inflation means that stuff gets more expensive and deflation means that stuff gets cheaper. There’s a correlation between the inflation rate and market levels, so the inflation rate can help traders understand big-picture processes.
Something has gone wrong with the CRB:CCI data and I can’t find any data past April 17th. In fact, last month I probably used the April 17th data for the model instead of the end of the month data. As a result, I’m switching to the ETF called DBC to track commodity prices. Let me know if you have some idea of what happened to the CCI.
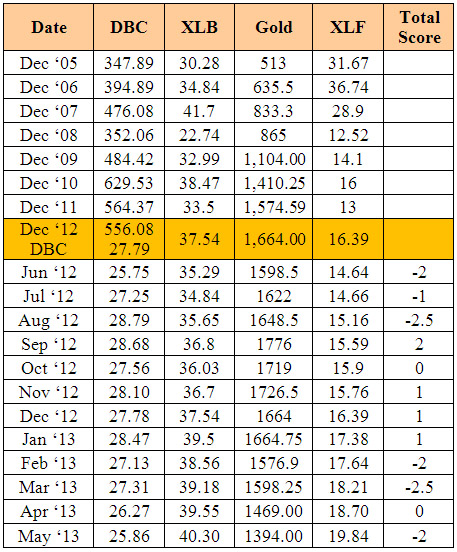
Looking back over the most recent two-month and six-month periods provides the current month’s score, given in the table below.
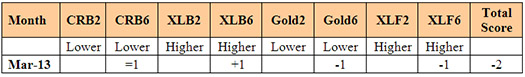
So the model suggests that we are heading back to deflation with three of the last four being negative and one neutral. As a result, I decided to once again check the real inflation at shadowstat.com. They show real inflation at about 9%, compared with government figures at about 1%.
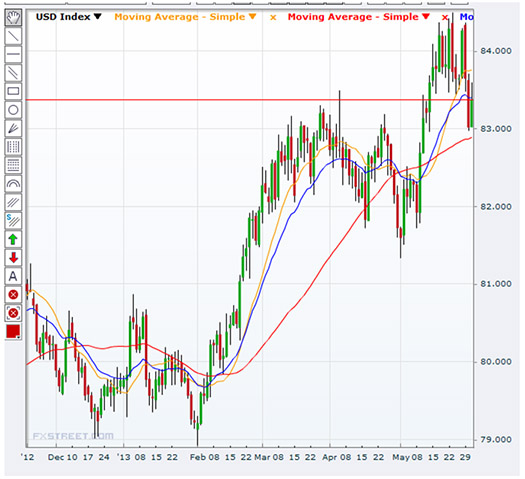
Part IV: Tracking the Dollar
In May, the dollar had a pretty strong surge moving above 84, however, then it moved lower right at the end of the month—touching 83. With historically low interest rates, a fiat currency and a huge debt, however, there is really nothing supporting the dollar.
General Comments
I recently read a newsletter announcement about a 3 minute event on June 13 that will affect $93 trillion. I couldn’t find out what that event might be and since $93 trillion is about the size of J.P Morgan’s derivative position, curiosity got the better of me and I paid $49 for a newsletter subscription. Congrats on great copy boys! Anyway, the underlying strategy they recommended is exactly what I had been doing in the Van Tharp Institute retirement account since 2008. Last year, however, the strategy stopped working and generated some big losses.
The event mentioned on June 13th is a treasury auction and this particular newsletter writer says that his “inside” sources says that the major players will not show up. Thus, those that do show up will demand huge interest rates in order to purchase what is available. And this will have a huge worldwide impact. He basically says the coming event could slash the $93 trillion bond market in half, while interest rates on ten year treasuries soar past their old highs of 15.84% yield. This could mean unprecedented interest levels on mortgages, car payments and credit cards.
Whether this will happen in June or not is just conjecture, but it could. In case you have a large position in bonds, that’s a very risky place to be. If interest rates went up 600%, for example, imagine what could happen to your bond portfolio, not to mention your mortgage and car payments.
For the foreseeable future, the Fed will keep short-term interest at an effective rate of zero and continue its efforts to drive money into the economy— which shows up in equities. In search of yield, capital has little elsewhere to go for now. But if the event mentioned above happens, capital will have someplace to go.
Until next month, this is Van Tharp.
These monthly market updates are not intended for predictive purposes; rather, they’re intended to help traders decide which of their trading systems should work best in the current market conditions. In bear markets—which are almost always volatile by nature—shorter-term strategies, and those that allow going short, tend to work better than long-only or intermediate/longer-term systems.
Which of your trading systems fit this current market type? Of course, this question implies that you have multiple trading systems and that you know how they perform under various market conditions. If you haven't heard of this concept or the other concepts mentioned above, read my book, Super Trader, which covers these areas and more, so that you can make money in any kind of market condition.
Crisis always implies opportunity. Those with good trading skills can make money in this market—a lot of money. There were lots of good opportunities in 2012, and many more to come in 2013. Did you make money? If not, then do you understand why not? The refinement of good trading skills doesn't just happen by opening an account and adding money. You probably spent years learning how to perform your current job at a high skill level. Do you expect to perform at the same high level in your trading without similar preparation? Financial market trading is an arena filled with world-class competition. Additionally, and most importantly, trading requires massive self-work to produce consistent, large profits under multiple market conditions. Prepare yourself to succeed with a deep desire, strong commitment and the right training.
About the Author: Trading coach and author Van K. Tharp, Ph.D. is widely recognized for his best-selling books and outstanding Peak Performance Home Study Program—a highly regarded classic that is suitable for all levels of traders and investors. You can learn more about Van Tharp at www.vantharp.com. His new book, Trading Beyond The Matrix, is available now at matrix.vantharp.com.
Trading Education
Day Trading Systems and Live Day Trading
Dates Added for August!
July 13-14 |
Core Trading Systems
Longer Term Trading Systems from Ken Long
Even if you intend to trade shorter term, this workshop acts as a rock-solid foundation to trade swing systems later on.
|
August 16-18 |
Day Trading Systems
with Ken Long
|
August 19-21 |
Live Day Trading
with Ken Long
Day Trading Systems is a prerequisite to this course.
|
October 3-14 |
Peak Performance 101, 202 and 203
Register for Peak 101 and get on the waiting list for 202 and 203 now.
|
| Berlin, Germany Workshops |
September 6-8 |
How to Develop a Winning Trading System
with Van Tharp and RJ Hixson
|
September 10-12 |
Blueprint for Trading Success
with Van Tharp and RJ Hixson
|
September 14-16 |
Forex Trading
with Gabriel Grammatidis
|
Register for all 3 and save $800!
|
To see the full schedule, including dates, prices, combo discounts and location, click here.
Trading Tip
May 2013 SQN® Report
by Van K. Tharp, Ph.D.
View On-line
There are numerous ETFs that now track everything from countries, commodities, currencies and stock market indices to individual market sectors. ETFs provide a wonderfully easy way to discover what’s happening in the world markets. Consequently, I now use the System Quality Number® (SQN®) score for 100 days to measure the relative performance of numerous markets in a world model.
The SQN 100 score uses the daily percent change for a 100-day period. Typically, an SQN score over 1.45 is strongly bullish and a score below -0.7 is very weak. We use the following color codes to help communicate the strengths and weaknesses of the ETFs:
- Green: ETFs with very strong SQN scores (0.75 to 1.5).
- Yellow: ETFs with slightly positive SQN scores (0 to 0.75).
- Brown: ETFs with slightly negative SQN scores (0 to -0.7).
- Red: Very weak ETFs that earn negative SQN scores (< -0.7).
The world market model spreadsheet report below contains most currently available ETFs; including inverse funds, but excluding leveraged funds. In short, it covers the geographic world, the major asset classes, the equity market segments, the industrial sectors and the major currencies.
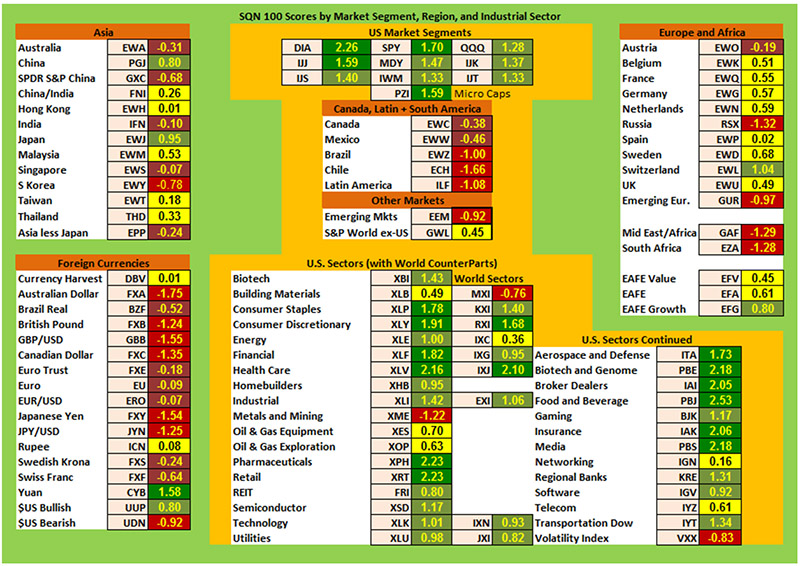
World Market Summary
The US equities markets are green in all major categories (see top middle box of the next chart) versus last month, when most of them were dark green. Most of the sectors are still green and dark green as well, although weaker than last month. Read the monthly update first to better understand the big picture.
The rest of the world isn’t nearly as strong, only showing some light green. Light green countries include China, Japan and Switzerland. Notice that Thailand, Hong Kong, Malaysia, Belgium, Sweden and the UK have moved from light green to yellow. Australia, Singapore and Brazil have moved from light green to red or brown. This is a sure sign that things might be changing for the worse.
Last month, only Russia and S. Korea were brown. This month, nine countries are brown and another nine are red. The red countries include South Korea, Brazil, Chile, Latin America, Emerging Markets, Russia, Middle East and South Africa.
Currencies are all particularly weak with only the Chines Yuan being green and the US dollar being light green. The Indian Rupee is the only yellow currency.
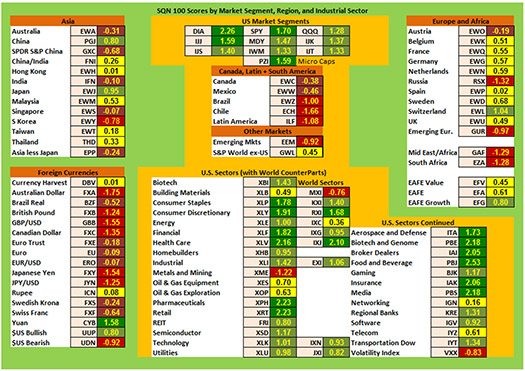
(to see a larger version of this image, click here)
The next chart shows real estate, debt instruments, commodities and the top and bottom ETFs for the past 100 days.
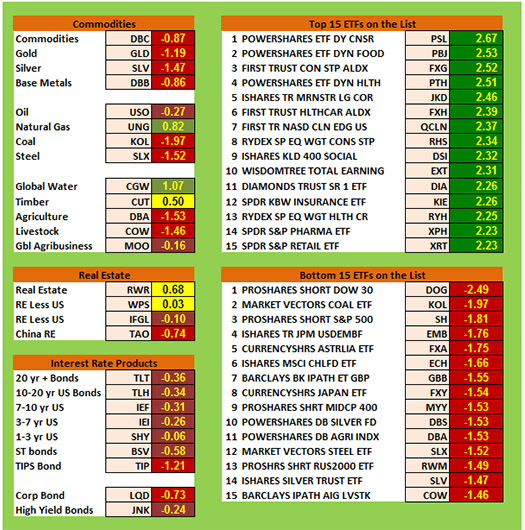
First, commodities as a whole are suggesting that deflation is a good probability with most areas being red. The red areas include commodities, gold, silver, base metals, coal, steel, agriculture and livestock. The brown areas include oil and global agribusiness. Perhaps this really shows how terrible the economy is doing and despite that, the stock market is doing well because of new money from the Federal Reserve pump.
Timber weakened to yellow. Natural gas and global water are light green. Nothing is dark green on the commodities side. Isn’t it interesting how water is now the best commodity?
Bonds all seem weak with everything being brown or red. Government debt is brown, but corporate and inflation protected debt are both red. As we discussed in this month’s global report, bonds are a very dangerous place to be.
Real estate as a category got weaker across the board with Chinese real estate moving to red and US real estate moving from green to yellow.
Of the strongest ETFs in the database, the top 15 all have SQN scores over 2.2. Last month I mentioned that the top ETFs were all utilities and were probably a good short candidate (that was not a recommendation) and I notice that they have all gone from the list. This month the top ETFs include: consumer staples, food and beverage, healthcare, big companies and even DIA made it only this month’s list. It’s rare that the DOW 30 would be a best performer.
The weakest ETF is still an inverse ETF (short the Dow 30). Most of the weakest ETFs are still short funds, however, this month coal, the Aussie dollar, the Yen, silver and steel also stand out as being weak. Lacking a duration of trends, these might be good long candidates— again, that’s not a recommendation.
What's Going On?
Overall, if you have been fully invested in US equities markets, you should have done very well in the first five months of the year. US stocks have been the place to be in 2013 and it doesn’t hurt that the dollar has recently been the strongest currency. Be careful, however, as there is weakness short-term, and the seasonal period for the stock market has ended.
In addition, please read my comments on the debt crisis in this month’s update because you might find a nasty shock at the next treasury auction on June 13th. We will see if a shock comes this month or later.
Generally, the market says you should be fully invested. But be very cautious now. Everything could change in a month or so.
Until next month’s SQN report, this is Van Tharp.
The markets always offer opportunities, but to capture those opportunities, you MUST know what you are doing. If you want to trade these markets, you need to approach them as a trader, not a long-term investor. We’d like to help you learn how to trade professionally, trying to navigate these markets without an education is hazardous to your wealth.
All the beliefs given in this update are my own. Though I find them useful, you may not. You can only trade your beliefs about the markets.
Ken's Class
A Day in the Life of the Chat Room
 In this 10 minute video recorded after the Monday, June 3rd trading session, Ken shares what he calls “A Day in the Life of the Chat Room” by highlighting some chat room member trades and a few of his. One member found a recent Larry Connors setup in TSLA and executed a trade using the RLCO methodology. Ken talks through a few of his trades and also a set of trades that yielded 17R on Monday for one trader who attended Ken’s recent day trading workshop. He finishes the video with his assessment of the recent market action. In this 10 minute video recorded after the Monday, June 3rd trading session, Ken shares what he calls “A Day in the Life of the Chat Room” by highlighting some chat room member trades and a few of his. One member found a recent Larry Connors setup in TSLA and executed a trade using the RLCO methodology. Ken talks through a few of his trades and also a set of trades that yielded 17R on Monday for one trader who attended Ken’s recent day trading workshop. He finishes the video with his assessment of the recent market action.
Click Here to Watch the Video
Gold Report
Gold Analysis and Strategy: June 2, 2013
by Florian Grummes
From time to time we'll share Florian's gold report with you. Click here to see the June report.
About the Author: Florian Grummes (born 1975 in Munich) has been studying and trading the gold market since 2003. In addition to his trading business, he is a very creative and successful composer, songwriter and music producer.
Ask Van...
Everything we do here at the Van Tharp Institute is focused on helping you improve as a trader and investor. Consequently, we love to get your feedback, both positive and negative!
Click here to take our quick, 6-question survey.
Also, send comments or ask Van a question by clicking here.
Back to Top
Contact Us
Email us at [email protected]
The Van Tharp Institute does not support spamming in any way, shape or form. This is a subscription based newsletter.
To change your e-mail Address, e-mail us at [email protected].
To stop your subscription, click on the "unsubscribe" link at the bottom left-hand corner of this email.
How are we doing? Give us your feedback! Click here to take our quick survey.
800-385-4486 * 919-466-0043 * Fax 919-466-0408
SQN® and the System Quality Number® are registered trademarks of the Van Tharp Institute
Be sure to check us out on Facebook and Twitter!
 
Back to Top |


