Tharp's Thoughts Weekly Newsletter (View On-Line)
-
Article Market Condition: Bull Quiet, by Van K. Tharp, Ph.D.
-
-
-
 Buy Van's New Book, Trading Beyond the Matrix, on February 25th (But Not Before) and Get an Exclusive Super Trader Lesson and up to $1,295 in bonuses! Buy Van's New Book, Trading Beyond the Matrix, on February 25th (But Not Before) and Get an Exclusive Super Trader Lesson and up to $1,295 in bonuses!
When you purchase Dr. Van Tharp’s new book on February 25th, we have a gift for you that we have never offered to ANYONE outside of the Super Trader program: Lesson Five from Van’s exclusive Super Trader Program. In addition, those who buy 10 books on February 25th will receive the brand new, never-before-seen, Tharp Think Webinar (valued at $495). We also have many other discounts and bonuses for everyone that buys the book on February 25th, valued at up to $1,295! So mark your calendars and be sure to purchase your copy of Trading Beyond the Matrix on February 25th (not before) so you won't miss out on these exclusive offers. More details coming next week.
Market Update for Period Ending February 1, 2013,
Market Condition: Bull Quiet
by Van K. Tharp, Ph.D.
View On-line
I always say that people do not trade the markets; they trade their beliefs about the markets. Consequently, I'd like to point out that these updates reflect my beliefs. I find the market update information useful for my trading, so I do the work each month and am happy to share that information with my readers.
If, however, your beliefs are not similar to mine, then this information may not be useful to you. If you are inclined to perform some sort of intellectual exercise to prove one of my beliefs wrong, simply remember that everyone can usually find lots of evidence to support their beliefs and refute others. Know that I acknowledge that these are my beliefs and that your beliefs may be different.
These updates are in the first issue of Tharp's Thoughts each month. This allows us to get the closing month's data. These updates cover 1) the market type (first mentioned in the April 30, 2008 edition of Tharp's Thoughts and readable on our web site), 2) the five-week status on each of the major U.S. stock market indices, 3) our four star inflation-deflation model plus John Williams' statistics, and 4) the movement of the dollar. I now report on the strongest and weakest areas of the overall market in a separate SQN® Report. I may come out with that report twice a month if there are significant market changes.—Van K. Tharp
Part I: Commentary—The Big Picture
I am writing this on February 4th of the New Year. The fiscal cliff has been postponed and the real decisions are a few months away, so there have been no real changes. The markets, however, seemed to like the postponement, as they went up significantly in January. We moved from neutral to bull and the shorter term SQNs are actually strong bull.
According to the U.S. National Debt clock (www.usdebtclock.org), our National Debt stands at $16.35 trillion — that’s up $180 billion in the last month. That’s equivalent to the United States increasing its debt by $600 per person in one month — that’s an annual rate of $7,200. So how would you like your taxes to go up by $7,200 per person in your household this year? If you are a family of four, that means an extra $28,800 per year in taxes are necessary this year just to cover how mismanaged our government is. It really doesn’t matter who the President is -- it’s a horrible situation for anyone and most Americans really don’t have a clue how bad the situation is.
Federal tax revenue for the year is currently at $2.49 trillion, while spending is at $3.54 trillion – that’s basically 50% deficit overspending. The U.S. trade deficit for the year stands at $740.9 billion. The total debt in the US per family is $732,610, while the average family has less than $5,800 in savings. In addition, U.S. unfunded liabilities now total $122.6 trillion - or over one million dollars per taxpayer. Do you see any way to overcome these problems that doesn’t hurt? Do you understand what I mean by terrible fundamentals?
The debt clock also shows this month’s population for the US at 315 million. We have a work force of 143.3 million (down 200K from last month) supporting 62.3 million retirees or social security recipients. 48.3 million food stamp recipients are included in that population. Additionally, there have been 1.3 million bankruptcies and 743,480 foreclosures so far this year.
Here’s my update for you from the debt clock web site with figures so you can watch the changes over time.
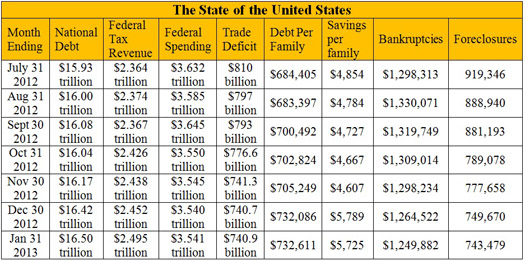
Some of the numbers fluctuate and do not make sense to me, but I’m just reporting the monthly figures as I see them on the debt clock. As reported, the bankruptcies and foreclosures figures don’t make sense to me unless they are rolling 12 month windows. Watching the debt per family grow from July’s $684,405 to $732,611 in six months has been quite interesting. Someone has to pay for that eventually and the bottom line points to each of us.
Part II: The Current Stock Market Type Is Bull Quiet
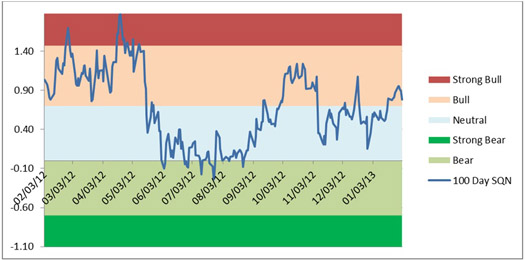
Each month, I look at the market SQN® score for the daily percent changes in the S&P 500 Index over 200, 100, 50 and 25 days. For our purposes, the S&P 500 Index defines the market. The market SQN helps me understand the market’s trend.
The two short term SQN® scores for 25 and 50 days are both strong bull. The 100 and 200-day SQNs are both bull. These scores are much stronger than last month and shows the short term run up. Personally, I like to have some short positions in IITM’s retirement account and currently, I only have one good short. I do have several good long positions though.
This is the chart tracking the 100 day Market SQN for the last year. You can see how we have moved up from neutral to bull in the last month.
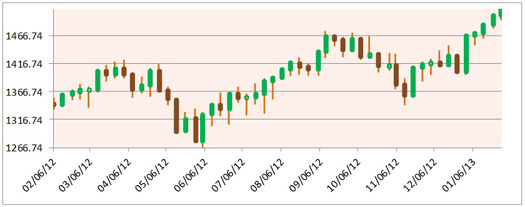
Here’s a weekly candlestick chart of the S&P 500. Notice the nice run up over the last two months. It’s no wonder the short term market types are strong bull.
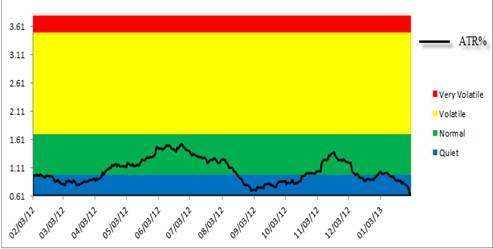
The next graph shows that the volatility is still quiet. Although that can change quickly, you are generally pretty safe to say that the market is in no immediate danger of falling strongly when the volatility is this quiet.
The next chart shows the activity of the three major U.S. indices at the closing Friday for each week last month and at the end of the last few years as well. In 2012, both the S&P 500 and the NASDAQ 100 were up over 10% in 2012.
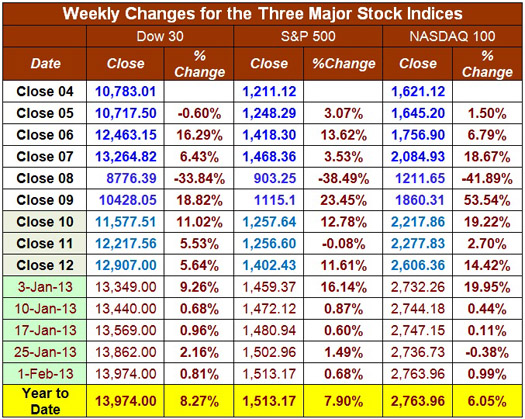
The first month of 2013 was almost as good as the entire year of 2012. In fact, the Dow 30 did better in January (up 8.27%) than it did in all of 2012 (up 5.64%). So perhaps the end of the world meant the end of bad markets. I doubt that, but it would be nice.
Overall, 2012 was positive, in fact, probably a little better than inflation with both the S&P 500 and the NASDAQ 100 being in double digits. Lastly, Jason Goepfert’s Daily Sentiment Report for February 1st shows that smart money is 38% confident in a rally, but down from 42% — so they probably missed the January rally, while dumb money is 63% confident (up from 50%). That’s a slightly risky picture.
Part III: Our Four Star Inflation-Deflation Model
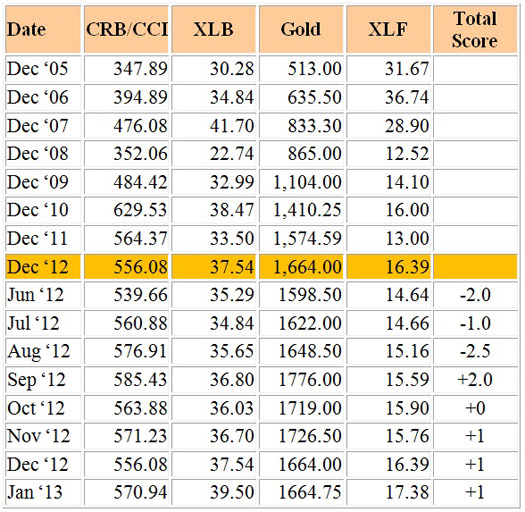
In the simplest terms, inflation means that stuff gets more expensive, and deflation means that stuff gets cheaper. There’s a correlation between the inflation rate and market levels, so the inflation rate can help traders understand big-picture processes. Here is my four star inflation-deflation model for the last few years and the last six months of 2012:
Looking back over the most recent two-month and six-month periods provides the current month's score, given in the table below.
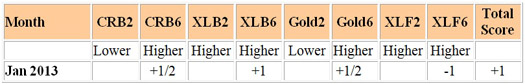
So, now the model has shown a slight inflationary tendency for three straight months. Four of the last five months in 2012 showed an inflationary tendency.
www.Shadowstats.com still shows that the real inflation rate is about 10% based upon the way the CPI was calculated in 1980, and about 5.5% based upon the way it was calculated in 1990. Based upon how the government currently constructs its lie sheet, the CPI is officially about 2%. Right now, at www.shadowstats.com, you’ll find that the rate of GDP growth (subtracting real inflation) is at -2%. Based upon those statistics, the GDP has shown negative growth since 2000 (meaning recession) in all but one quarter of 2003.
Part IV: Tracking the Dollar
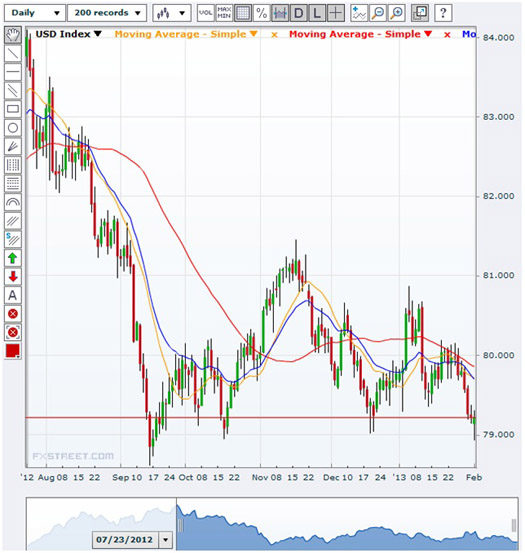
Look what has happened to the US dollar since August. We’ve suffered a huge decline from 84 to below 79. Shortly after, we have had a slight up movement, but now it looks like we are going to test the lows again. I’m going to Australia this month, so I’d expect to see the Tharp Effect to cause the US dollar to drop against the Aussie dollar. The Tharp Effect has been a long running joke but it seems to happen every time I travel internationally.
General Comments
Money is definitely flowing into the market. We still don’t know what Congress will do with the fiscal considerations they just postponed but remember that everything they do is short term and in the direction of getting elected - always. They do not think about the long term consequences of what they are doing. Also, remember earlier in this article, I said they’d need to raise taxes by $28,800 per family this year in order just to balance the budget. Better yet, they could cut spending by $28,800 per family. Meanwhile, they argue about whether the rich should handle the burden?
These monthly market updates are not intended for predictive purposes; rather, they’re intended to help traders decide which of their trading systems should work best in the current market conditions. In bear markets—which are almost always volatile by nature—shorter-term strategies, and those that allow going short, tend to work better than long-only or intermediate/longer-term systems.
Which of your trading systems fit this current market type? Of course, this question implies that you have multiple trading systems and that you know how they perform under various market conditions. If you haven't heard of this concept or the other concepts mentioned above, read my book, Super Trader, which covers these areas and more, so that you can make money in any kind of market conditions.
Crisis always implies opportunity. Those with good trading skills can make money in this market—a lot of money. There were lots of good opportunities in 2012, and many more to come in 2013. Did you make money? If not, then do you understand why not? The refinement of good trading skills doesn't just happen by opening an account and adding money. You probably spent years learning how to perform your current job at a high skill level. Do you expect to perform at the same high level in your trading without similar preparation? Financial market trading is an arena filled with world-class competition. Additionally, and most importantly, trading requires massive self-work to produce consistent, large profits under multiple market conditions. Prepare yourself to succeed with a deep desire, strong commitment and the right training.
About the Author: Trading coach and author Van K. Tharp, Ph.D. is widely recognized for his best-selling books and outstanding Peak Performance Home Study Program—a highly regarded classic that is suitable for all levels of traders and investors. You can learn more about Van Tharp at www.vantharp.com. His new book, Trading Beyond The Matrix, is expected for publication February 2013.
Trading Education
Workshops
Ken Long Has A New Day Trading Workshop in April!
|
$700 Discounts Expire Soon on the Australia Workshops
|
March 1-3 |
Peak Performance 101 - Australia |
March 5-8 |
Peak Performance 202- Australia
|
March 15-17 |
Peak Performance 203 - Australia
"The Happiness" Workshop
|
April 6-7 |
Oneness Awakening Workshop |
April 19-21 |
NEW Day Trading Workshop with Ken Long
|
April 22-24 |
Live Day Trading Sessions with Ken Long
|
May 17-19 |
Swing Trading with Ken Long
|
May 21-23 |
Forex Trading with Gabriel Grammatidis
|
June 20-22 |
Peak Performance 101 |
June 24-27 |
Peak Performance 202
|
Jun 29-Jul 1 |
Peak Performance 203
"The Happiness" Workshop
|
To see the schedule, including dates, prices, combo discounts and location, click here.
Trading Tip
January 2013 SQN® Report
by Van K. Tharp, Ph.D.
View On-line
There are numerous ETFs that now track everything from countries, commodities, currencies and stock market indices to individual market sectors. ETFs provide a wonderfully easy way to discover what’s happening in the world markets. Consequently, I now use the System Quality Number® (SQN®) score for 100 days to measure the relative performance of numerous markets in a world model.
The SQN 100 score uses the daily percent change for a 100-day period. Typically, an SQN score over 1.45 is strongly bullish and a score below -0.7 is very weak. We use the following color codes to help communicate the strengths and weaknesses of the ETFs:
• Green: ETFs with very strong SQN scores (0.75 to 1.5).
• Yellow: ETFs with slightly positive SQN scores (0 to 0.75).
• Brown: ETFs with slightly negative SQN scores (0 to -0.7).
• Red: Very weak ETFs that earn negative SQN scores (< -0.7).
The world market model spreadsheet report below contains most currently available ETFs; including inverse funds, but excluding leveraged funds. In short, it covers the geographic world, the major asset classes, the equity market segments, the industrial sectors and the major currencies.
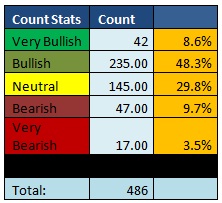
World Market Summary
I’m amazed at how much green I’m seeing in the world summary. We track 486 ETFs in the World Market Summary. The Table below shows the make-up of the market. So right now, 57.1% of the world model is bullish and 8.6% is strongly bullish.
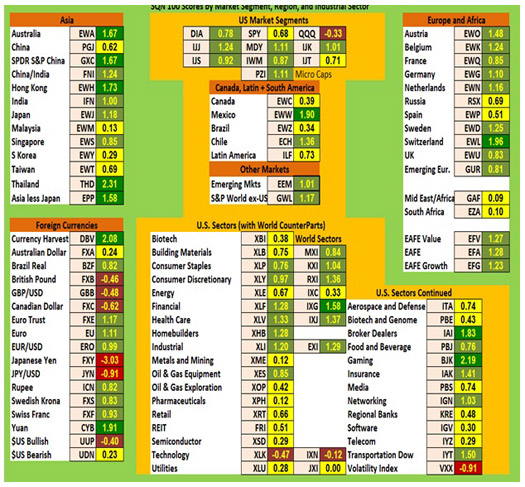
Let’s see what the markets look like as shown in our first figure.
The SQN world market summary is still green and there are no red areas except for the Japanese Yen and the VXX; the same as last month. Most of the US stock market is light green, aside from the small cap growth stocks and the QQQ (which is slightly negative because of AAPL). Europe is totally green except for Russia and Spain. Asia is green except for China, Malaysia, S. Korea and Taiwan. The only brown on the chart is the British Pound, the Canadian Dollar, the US Dollar, and the technology sector.
The next chart shows real estate, debt instruments, commodities and the top and bottom ETFs for the past 100 days.
Since most bonds are now either yellow or brown, people are moving out of that sector; only the junk bonds are green. Among the commodities, gold, silver and oil are all brown, while agriculture has turned red.
Timber, however, appears to be a shining star, as it is now dark green.
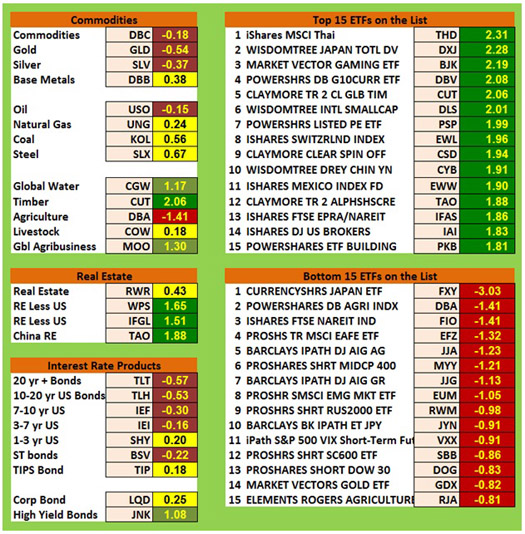
We have six ETFs with SQN scores over two. They include: Thailand, Japan Dividend, Gaming, Global Currencies (probably as basket), Timber and International Small Cap stock.
The weakest area, by far, is the Japanese Yen with a -3SQN (perhaps that’s more a function of the ETF than the Yen); many of the weak funds are also short funds.
What's Going On?
Last month, I talked about the strength of municipal bonds. Today, they’ve disappeared off the list. As I have said before, wait two months and the whole picture will be different.
Fundamentally, the U.S. is in the worst shape it’s been in a long, long time. Our debt looks asymptotic and the dollar could soon be dismissed as the world’s reserve currency. Given all of that, the markets look relative strong, at least for a while.
Next month, I’ll be in Sydney presenting three Peak Performance workshops and RJ Hixson will be doing the update; so until next time, this is Van Tharp.
Crises always offer opportunities, but to capture those opportunities you MUST know what you are doing. If you want to trade these markets, you need to approach them as a trader, not a long-term investor. We’d like to help you learn how to trade professionally; trying to navigate these markets without an education is hazardous to your wealth.
All the beliefs given in this update are my own. Though I find them useful, you may not. You can only trade your beliefs about the markets.
Ken's Class
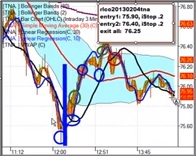 In this thirteen minute video, Ken describes a combination trade he took on Monday morning, February 4. Ken starts his preparation for the trading day with an analysis of the recent market action and what may be in store for the short term. The gap down on Monday morning was not a surprise for him and Ken explains his two short trades for the morning using an inverse ETF and a volatility based ETF. As the market bottomed later in the morning, Ken exited those shorts and then went long. Nothing spectacular by Ken’s standards, and as he said, he got paid about 4R for taking care of business that morning. In this thirteen minute video, Ken describes a combination trade he took on Monday morning, February 4. Ken starts his preparation for the trading day with an analysis of the recent market action and what may be in store for the short term. The gap down on Monday morning was not a surprise for him and Ken explains his two short trades for the morning using an inverse ETF and a volatility based ETF. As the market bottomed later in the morning, Ken exited those shorts and then went long. Nothing spectacular by Ken’s standards, and as he said, he got paid about 4R for taking care of business that morning.
http://youtu.be/FMN4eDJ4Bsk
Ask Van...
Everything we do here at the Van Tharp Institute is focused on helping you improve as a trader and investor. Consequently, we love to get your feedback, both positive and negative!
Click here to take our quick, 6-question survey.
Also, send comments or ask Van a question by clicking here.
Back to Top
Contact Us
Email us at [email protected]
The Van Tharp Institute does not support spamming in any way, shape or form. This is a subscription based newsletter.
To change your e-mail Address, e-mail us at [email protected].
To stop your subscription, click on the "unsubscribe" link at the bottom left-hand corner of this email.
How are we doing? Give us your feedback! Click here to take our quick survey.
800-385-4486 * 919-466-0043 * Fax 919-466-0408
SQN® and the System Quality Number® are registered trademarks of the Van Tharp Institute
Back to Top |


