Tharp's Thoughts Weekly Newsletter (View On-Line)
-
Article Special Market Update —Market Condition: Bull Quiet by Van K. Tharp, Ph.D.
-
-
TradingTip Algorithmic Trading Rears its Ugly Head —Again by D.R. Barton, Jr.
October is all about Transformation!
Oneness Awakening Workshop
Peak Performance 101 Workshop
Peak Performance 202 Workshop
 Special Market Update for the Period Ending Sep 14th, 2012 Special Market Update for the Period Ending Sep 14th, 2012
Market Condition: Bull Quiet
by Van K. Tharp, Ph.D.
I don’t usually write a mid-month update, but a few things have happened since the beginning of the month that I thought would make a special update worthwhile for my readers. Namely, the Federal Reserve announced QE3 last week, the market type changed to bull quiet, and I experienced the best two-day period I’ve ever had managing the Van Tharp Institute retirement plan.
Long-term, we remain in a secular bear market, but that doesn’t mean there won’t be up moves during this period. Some of the up moves in secular bears are fantastic, and this very well could be one of them. The Fed’s announcement may also signal the beginning of some pretty strong inflation, but more about that point later.
While recently finishing my new book, Trading Beyond the Matrix (published by Wiley, available probably next March), I happened to be looking at a long-term chart of the S&P 500. I saw a low-risk idea that potentially yielded 5 to 1 on both the long side and the short side. I rarely see anything like that, where both the long and short directions offer a great trade. In late August, the market just had to decide which way it wanted to go. The 2012 S&P 500 weekly bar chart I used in the book is shown below.
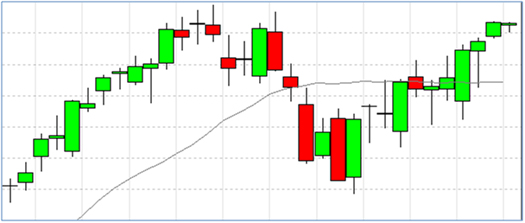
The market was running into resistance from its highs in late March/early April; you can see the downside possibility in the chart about 10 bars back, at the swing low in early June. If it broke to the downside and went to its recent lows, we would be looking at a 5:1 reward-to-risk trade. If it broke to the upside, we would be looking at a potential move up to the 2007 highs—another 5:1 reward-to-risk rate.
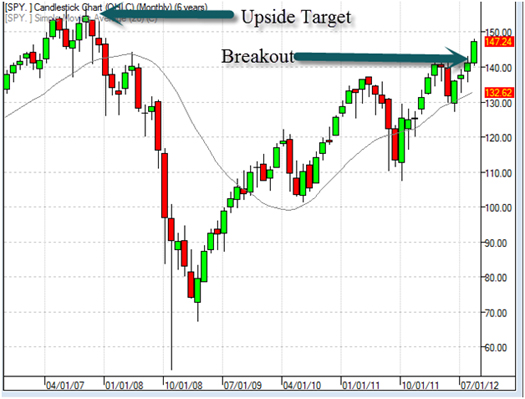
The market has now clearly moved up beyond that resistance. In fact, it’s already achieved at least 2R in profit to the upside. To show this, I have to use a monthly candlestick chart that goes back to the 2007 highs. You can see clearly just how far the big September breakout bar has gone past the resistance area it hit last month in the chart above.
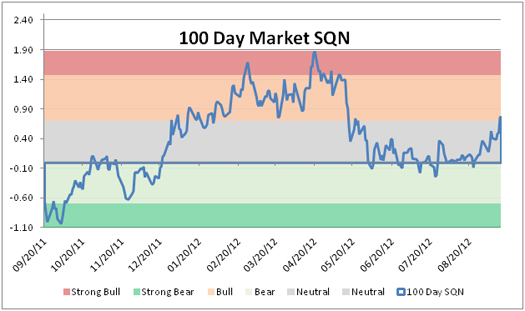
The Current Stock Market Type Is Bull Quiet
The 200-day Market SQN is in strong bull mode, while the 100-, 50- and 25-day Market SQN scores are all in the bull range. I primarily use the 100-day time frame to determine market type.
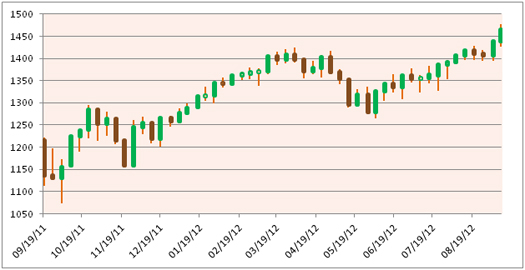
The market started going up late last year. In April-May, it showed a significant correction and then resumed its uptrend. Here’s a weekly candlestick chart of the S&P 500.
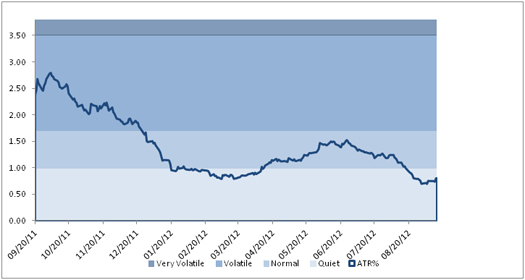
The next graph shows that volatility is now quiet, which is an excellent sign that the bull phase will continue. VXX, the VIX-based ETF, is extremely weak.
General Comments
We may be in for a nice period of up moves during which you could buy and use a 25% trailing stop. Some of the best investments may be inflation hedges like gold, silver, or gold and silver mining stocks. Why?
First, the Federal Reserve committed to their low interest rate policy until 2015. Furthermore, they instituted QE3, for which they plan to buy long-term bonds, especially mortgages—without a specified end date. Ben Bernanke studied the Great Depression extensively as an academic and is committed to keeping another one from occurring—even if it means causing hyperinflation and the destruction of the dollar. And that’s probably what it does mean. That’s why long-term inflation hedges are a good idea in this market.
Let’s look at what might happen to the QE3 money. For a long time, the Fed’s primary method of stimulating or retracting the economy has been to raise or lower interest rates. However, that method is not effective right now because we’re in a recession (according to www.shadowstats.com, which uses real statistics rather than the current government-manipulated statistics, we’ve been in a recession since 2000, with the exception of one quarter) and interest rates cannot go any lower. If interest rates were to rise, the interest expense on the government’s huge amount of debt would become truly massive. Even though rates are currently near zero, interest already makes up a huge part of the deficit.
The only recourse for the Fed is to print money, and it’s doing that by buying bonds. However, the Fed buys bonds directly from large institutions, which typically channel the money directly into the stock market. In other words, the Fed is basically giving the large banks (who happen to own the Fed) a gift.
Of course, the Fed hopes that some of the QE3 money will be channeled into the economy. We’ll see. In my regular market updates, I usually show a chart of the M1 money multiplier, which has been below 1 since the 2008 financial crisis. Until it rises well above 1, you’ll know that QE3 money is going directly into the markets rather than into the economy.
Furthermore, the European Central Bank seems to be committed to buying the bad government bonds of its member countries—in unlimited quantities. Again, this supports a global policy of hyperinflation.
The bottom line is that the economy is dismal, and the Fed no longer has the ability to manipulate it. These are the fundamentals behind today’s economy, and it’s no better in the rest of the world.
About the Author: Trading coach and author Van K. Tharp, Ph.D. is widely recognized for his best-selling books and outstanding Peak Performance Home Study Program—a highly regarded classic that is suitable for all levels of traders and investors. You can learn more about Van Tharp at www.vantharp.com.
Trading Education
Workshops
Peak Performance 101 is a prerequisite for Peak Performance 202 and the Super Trader Program. It forms the most solid foundation for all of Dr. Tharp's principles for great trading.
To see the schedule, including dates, prices and location, click here.
Trading Tip

Algorithmic Trading Rears its Ugly Head—Again
by D.R. Barton, Jr.
In the months following the May 2010 Flash Crash, I wrote eight separate articles that dug deeply into what really happened and how individual traders should adapt to the new realities of the market. Last month, R.J. revisited the Flash Crash after his broker issued alerts similar to the ones from May, 2010. Even though High Frequency Trading (HFT) was often cited as a cause of the monstrous volatility of that day, the data show that HFT firms only played a supporting role in the whole scenario.
Interestingly, Nanex—the little-known data firm that almost single-handedly exonerated HFT in the Flash Crash—has come out with one of the most stunning graphics that I’ve seen this year. Their data show that algorithmic trading
- Controls a lion’s share of the liquidity in many markets and
- Is being driven by a newfound herd mentality.
Rage Against the Machine(s) & Yet Another Cool Graphic
On the Nanex website under the very descriptive title, “The most disturbing chart on market stability we have ever seen,” these data crunchers posted a series of charts, two of which we’ll examine today.
First, look at an example of what has typically happened to the size of bids and offers (or general market liquidity) before an important economic announcement. For the triggering event, Nanex used what is currently the most watched economic number, the monthly employment report. Here’s what happened in the minutes before and after the May announcement:
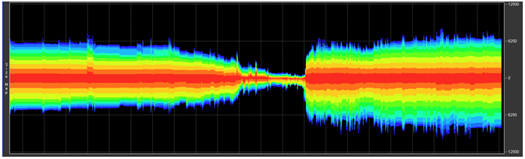
You can't see the time scale here, but the number of orders started to decline and gradually dropped to a minimum about a minute and a half ahead of the announcement. Now compare that to what happened last Thursday during the lead-up to the FOMC announcement from the Fed:
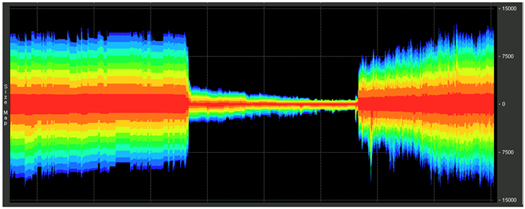
Liquidity dried up almost instantaneously five minutes ahead of the announcement!
Here is Nanex’s description of this eye-opening visual:
On September 13, 2012, at 12:25:27, the December 2012 eMini contract experienced an evaporation of liquidity at such an alarming rate that it produced one of the most disturbing charts on market stability we have ever seen. Basically, about 80% of the orders resting in the book vanished in a second. To be sure, liquidity before major news events always dries up beginning 1 to 2 minutes before the scheduled time, but always, at, a, gradual, rate (Editor’s note: Nanex included the extra commas for emphasis and hyperlinked each word to a chart showing gradual liquidity declines leading up to economic announcement times). This event tells us that either one firm controls 80% of this contract, or that algorithms have become dangerously susceptible to herd behavior and can be triggered to stampede in a heartbeat.
So What?
For years, I’ve written that intraday traders should be careful about (or even avoid) trading during known news events like major economic announcements. The herd behavior and hair-trigger responsiveness of the algorithmic traders has made this sage advice even more important. In general, when liquidity dries up, you don’t want to be exposed. Swing traders should also be aware of what’s happening during major events and make adjustments for expected volatility.
Algorithmic and HFT firms are here to stay. As individual traders, our first line of defense is to understand the field we’re playing on. Consequently, you should be aware that when it comes to economic announcements, the game could be changing.
Forewarned is forearmed.
As always, I welcome your comments at drbarton “at” vantharp.com.
Great Trading,
D. R.
About the Author: A passion for the systematic approach to the markets and a lifelong love of teaching and learning have propelled D.R. Barton, Jr. to the top of the investment and trading arena. He is a regularly featured guest on both Report on Business TV and WTOP News Radio in Washington, D.C., and has been a guest on Bloomberg Radio. His articles have appeared on SmartMoney.com and Financial Advisor magazine. You may contact D.R. at "drbarton" at "vantharp.com".
Disclaimer
Ask Van...
Everything we do here at the Van Tharp Institute is focused on helping you improve as a trader and investor. Consequently, we love to get your feedback, both positive and negative!
Click here to take our quick, 6-question survey.
Also, send comments or ask Van a question by clicking here.
Back to Top
Contact Us
Email us at [email protected]
The Van Tharp Institute does not support spamming in any way, shape or form. This is a subscription based newsletter.
To change your e-mail Address, click here
To stop your subscription, click on the "unsubscribe" link at the bottom left-hand corner of this email.
How are we doing? Give us your feedback! Click here to take our quick survey.
800-385-4486 * 919-466-0043 * Fax 919-466-0408
SQN® and the System Quality Number® are registered trademarks of the Van Tharp Institute
Back to Top |
Sept 19, 2012 - Issue 595

Special Reports, Self-Sabotage Reexamined
$19.95 Ea
Special, Buy One Get One Free

A Must Read for All Traders
Super Trader
How are we doing?
Give us your feedback!
Click here to take our quick survey.
From our reader survey...
"I think the newsletter is extremely generous and it is a resource I utilize constantly. I have saved every single one since I first subscribed."
Trouble viewing this issue?
View On-line. »
Tharp Concepts Explained...
-
Trading Psychology
-
System Development
-
Risk and R-Multiples
-
Position Sizing
-
Expectancy
-
Business Planning
Learn the concepts...
Read what Van says about the mission of his training institute.
The Position Sizing Game Version 4.0
Have you figured out yet how to pick the right stocks? Are you still looking for a high win-rate trading system? When you’re ready to get serious about your trader education, download the Position Sizing Game to learn some true fundamentals of trading success. Learn more.
To Download for Free or Upgrade Click Here

Download the 1st three levels of Version 4.0 for free.
Register now. »
Trouble viewing this issue?
View On-line. »

A Thousand Names for Joy: A Commentary
You can read Super Trader Curtis Wee's full review here.
Dr. Tharp is on Facebook

Follow Van through
Twitter »
Van Tharp Trading Education Products are the best training you can get.

Check out our home study materials, e-learning courses, and best-selling books.
Click here for products and pricing
What kind of Trader Are You? Click below to take the test.
Tharp Trader Test
Back to Top

Introduction to Position Sizing™ Strategies
E-Learning Course
Only $149
Learn More
Buy Now
SQN® and the System Quality Number® are registered trademarks of the Van Tharp Institute
Dr. Tharp on Producing a Rarity with his limited edition Safe Strategies book.
Click to read more.
|