Tharp's Thoughts Weekly Newsletter (View On-Line)
-
Article Seven Steps for Developing a Low-Risk Idea, Pt. 2 by Van K. Tharp, Ph.D.
-
-
TradingTip More Monetary Easing and the Law of Diminishing Returns by D.R. Barton, Jr.
-
Mailbag Where Can I Start If I Don't Have Enough Money to Trade?
The Core Trading System—Perfect When You Don't Have a Lot of Time to Trade.
$700 Early Enrollment Discount Expires Next Week, July 3
Next week is the July 4th holiday in the U.S. If you're going to register for this course, we highly recommend you do it this week—before the holiday creeps up on you and you forget and miss the discount!
Click Here to Learn More About The Workshop.
 Seven Steps for Developing a Low-Risk Idea Seven Steps for Developing a Low-Risk Idea
Part 2
by Van K. Tharp, Ph.D.
Last week (click here), we discussed the first three steps of a seven-step approach to developing low-risk trading ideas:
- Knowing the big picture and trading a strategy that will work given that big picture
- Developing a fictional short-term model for what the market is doing
- Finding a low-risk trade within the model for which your risk is minimal
This week, we'll talk about steps 4-7, which address the need to manage risk and adapt your system when necessary.
4. Make Sure Your Trade Has At Least a 3R Potential Gain.
Now that you know what a 1R loss will be, it’s important to determine your profit potential. If your model is correct, the prices should go to the other end of the channel. Ask yourself, “what kind of move is likely, and how big is that move with respect to my initial risk?” If it is at least three times your initial risk, it’s probably a good trade for you to take. If it’s less than three times your initial risk, skip it. You can find a better trade later.
Notice what this step means:
- The smaller the initial risk set up by your model, the more likely you are to get an acceptable trade.
- The model is useful as long as you’re not married to it. As soon as you decide that it might be real, you run the risk of developing a psychological need to be right about the model, and that will influence your decisions.
- It doesn’t matter whether or not the model is accurate or real—just that it gives you low-risk trades.
Consider this chart (Figure 1) from last week's article, which shows daily bars of the USD/JPY prices for 2012 (through mid-June). If we entered a short trade at 79.30 and placed our initial stop at the upper trend line, 79.50, our risk per unit would be 0.2. Our first exit target might be the swing-low close at 78.00 on June 1, so we'd have the potential for an 8R profit—well above our minimum of 3R.
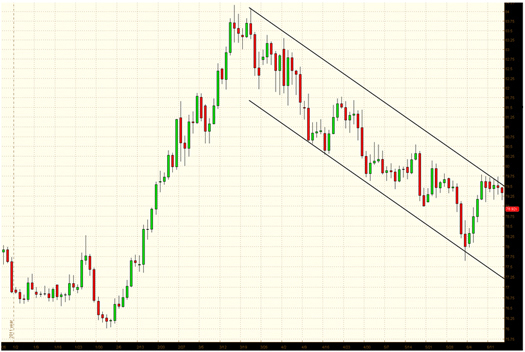
Figure 1: USD/JPY Daily Bars Jan. 1, 2012 through June 14, 2012
5. Take the Trade With a Position Size That Allows You To Continue to Play the Game.
Essentially, we’ve already talked about this step in our definition of a low-risk idea. You are basically trading beliefs that you made up, but as long as you remember that you made them up and keep from getting attached to them, it doesn’t matter.
Think about it. Let’s say you make money on 50% of your trades and that your average profit is about 2R, while your average loss is 1R. This gives you a pretty good system - even though you invented everything.
Keeping this illusory nature of your system in mind, you must trade it at a low-risk level that will allow you to survive any unexpected occurrence. Although I recommend that generally you risk no more than 1% on each trade, you are probably much safer risking ½% per trade when you start trading, especially if this is a new model with which you don’t have much experience.
By the way, let’s make sure everyone understands what risking 1% means. Suppose you found a stock and decided that your initial risk was $2.50 per share—the difference between your entry price and the initial stop. You would get out of the position if the price dropped by $2.50 after you entered. If you have a $50,000 portfolio, and you want to risk 1% of that, then you’d risk $500 on the trade. Now, if you divide that $500 by the $2.50 unit risk you get 200 shares. If the stock cost $40 per share then you purchase $8,000 worth of stock. You would get out of the trade if the price moved against you by $2.50, so your risk is only $500—not the entire $8,000 position. This is what we mean by risking 1% of your portfolio.
6. Continue to Trade the Model if the Trade Works Out
If the trade works out, you might find that the model you made up will work for four or five more trades. If so, that’s great; continue trading the model.
Even if a trade doesn’t work out, it might not destroy the model. For example, the trade might retrace and go back above the line you drew, stopping you out. However, it if just stays there or then reverses again, it doesn’t invalidate the model. You might still get some more trades out of it. Continue to do that. You might have made up the model, but as long as it works, just continue to use it.
7. Adjust the Model if the Trade Doesn’t Work
Let’s say that the position does reverse and goes way back above the line. In fact, it goes so far above the line that your model no longer makes sense. At this point, you must realize that your model is just made up. Abandon the old one and find a new one.
From our previous example, you may find that you simply need to redraw your channel lines. In Figure 1, the USD/JPY bars were rolling over at the upper trend channel line. They did go lower but then later reversed to go through the upper trend line (see Figure 2 below). You might make up that there’s a new upward channel in which prices are now moving—or at least until they don’t anymore.
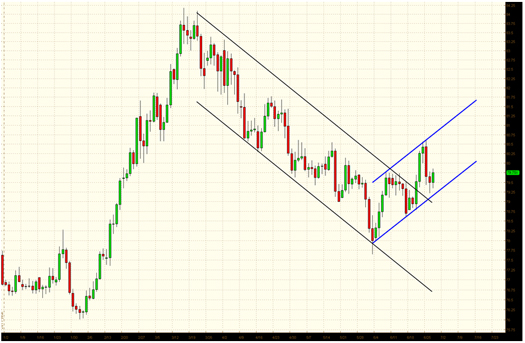
Figure 2: USD/JPY Daily Bars Jan. 1, 2012 through June 27, 2012
You might find that nothing you invent makes sense. However, later, after studying the charts some more, you find that another pattern seems to jump out at you. Okay, that seems to be what now fits. Go ahead and use the new model to help you generate new low-risk trades using the same principles we’ve just described.
If you trade complex models (made-up models in my opinion) such as Gann or Elliot Wave, always remember that those are just invented models and you’ll be fine. You are simply following the steps I’ve just outlined. Once traders start believing the model, however, they have become convinced that their model is real and they stop seeing what the market is truly doing. Problems always occur at this point and the net result is usually a disaster.
Just remember that you are simply inventing models that give you the basis for low-risk trades. If those models are based upon commonly accepted trading practices (e.g., trend lines, support and resistance, Fibonacci numbers, etc) then enough traders may believe them to give them some validity. If not, then you still have a low-risk idea and you must act on it and get out. The net result, even though your idea is based on a fictitious model, is still a good trade.
Remember, the key is that you cannot trade the market; you can only trade your beliefs about the market. So why not make up some useful beliefs?
About the Author: Trading coach and author Van K. Tharp, Ph.D. is widely recognized for his best-selling books and outstanding Peak Performance Home Study program—a highly regarded classic that is suitable for all levels of traders and investors. You can learn more about Van Tharp at www.vantharp.com.
Trading Education
Workshops
The July Core Systems Workshop looks like it's going to consist of a small, intimate group of interesting people. If you would like to receive focused, personalized instruction from Ken Long, sign up now. Anyone who wants great systems to trade but has little time or limited investment options (many retirement plans) will find a system that fits them in this workshop.
July
21-22
$2,295
|
Core Trading Systems: Market Outperformance and Absolute Returns
— Are you more of an investor than a trader but want to manage your funds a bit more actively?
— Do you have very little time to trade?
— Does your retirement plan offer only limited choices on where you can put your money?
— Are you a short-term trader who wants to put some of your equity to work in intermediate and longer-term systems?
Learn profitable longer-term systems that take very little of your time to trade. Learn More. |
August
3-5
$3,295
|
Frog Trading System Boot Camp
— Do you have the patience and discipline to follow a simple trading system consistently to earn profits in the long run?
— Have you been looking for a trading system that doesn’t require market technicians’ certification or an engineering degree to understand?
— Would you like to learn how to trade one system really, really well instead of trying to remember all the rules for a dozen systems?
— Would you like daily setups and trades?
The Frog Trading System Boot Camp is the first of a new type of workshop we’re presenting. Learn More. |
August
24-26
$2,295
|
Peak Performance 101
You’ll leave this workshop knowing, for the first time in your life, why some people consistently make profits over and over again while others are erratic and unsuccessful. |
August
28-30
$3,295
$5,090
(Peak Combo) |
The Happiness Workshop
When you really understand that you are not your beliefs about the market, but the awareness of those beliefs, then you can really know what the market is doing. It gives you a tremendous edge. That type of trading is possible for everyone. |
Sept 21-28 |
Mechanical Systems for Day and Swing, and Discretionary Live Trading
Presented by Ken Long |
October 6-7 |
Oneness Awakening Weekend |
October 19-21 |
Peak Performance 101
Van Tharp's Signature Workshop |
October 23-26 |
Peak Performance 202
with Van Tharp and Dr. Libby Adams |
To see our full workshop schedule, including dates, prices and location, click here.
Trading Tip 
More Monetary Easing and the Law of Diminishing Returns
by D.R. Barton, Jr.
Last week, the Federal Open Market Committee (FOMC) held another highly anticipated meeting after which they announced their policy decisions. The market was expecting more quantitative easing goodness, but this august body decided only to extend Operation Twist until the end of the year. On the following day, the market showed its disdain by dropping 30 points in the S&P 500 and 250 points in the Dow.
For a moment, let’s step back from the immediate consequences of the announcement to consider the bigger picture. Basically, central banks are dumping cash down the gullets of the insatiable global financial markets. Each new stimulus program continues to generate a short-term sugar high in the markets, but the long-term retention of those gains grows weaker and weaker. Common sense would tell us that the effects of monetary policy interventions are becoming smaller and smaller.
Central Bank Euphemisms
Everyone knows that the central banks have been practicing “quantitative easing,” a euphemism for increasing the monetary base by any means possible in order to provide economic stimulus. In recent times, the more obscure the means, the better. Operation Twist is one such funky measure.
The Fed started “twisting” the yield curve with Operation Twist in the fall of 2011 and then just extended it with their announcement last week. The term attempts to create a visual representation of twisting the short-term end of the yield curve up while twisting the long-term end down. The following chart shows the actual effect of the original manipulation:
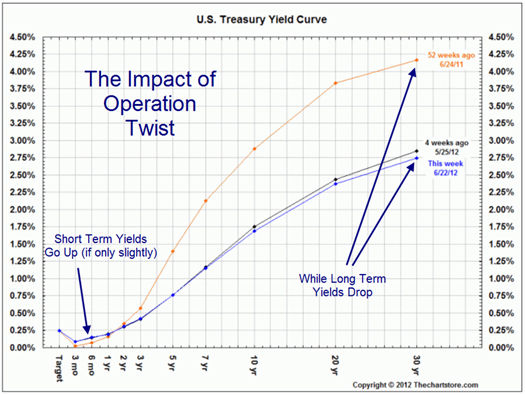
As you probably know, the price of treasuries and their yields move in opposite directions. As prices move up, yields drop, and vice versa. So, to achieve their goal of driving longer-term rates down, the Fed sold short-term U.S. treasuries and bought longer maturity bonds. Applying the basic law of supply and demand, selling the short-term bonds pushed prices down (and pushed yields up). Conversely, the demand from massive purchases of longer-term bonds drove the price up and the yields down. And now the Fed has promised to keep doing this until the end of the year.
So What’s The Problem?
Here's the Fed's problem in a nutshell: the effects from their stimulus programs have been waning. Injecting new money into the financial system has been producing diminishing returns.
The law of diminishing returns is a centuries-old economics dictum from various forms of production. It asserts that, all other things being equal, an extra unit of input will eventually result in less than a unit of additional output.
Indeed, we see just that effect if we look at the markets’ response to the various measures of monetary stimulus that have been tossed at it. Let’s look at another excellent graphic from thechartstore.com to see a rather broad but useful interpretation:
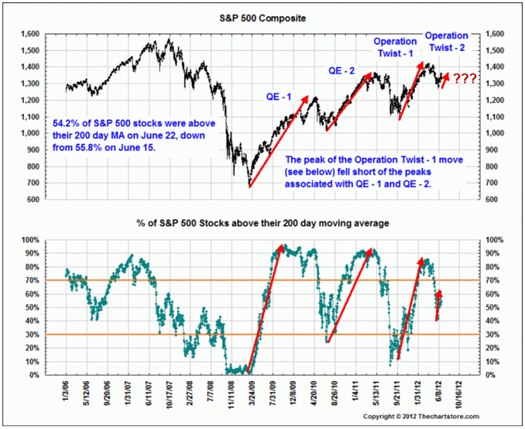
There are two observations to note here. First, notice how the four bouts of monetary stimulus in the top chart are associated with S&P 500 rallies. It’s fairly clear that each successive stimulus program generated smaller moves in both magnitude and duration.
The second observation comes from the bottom graph, which shows the percent of stocks on the S&P 500 above their individual 200-period moving averages. Each successive dose of stimulus percentage peaks with fewer stocks above their 200-day moving average than the time before.
The Bottom Line
The charts above provide us with a qualitative view that shows less output from stimulus programs for each unit of input.
So what can we expect from this extension of Operation Twist? Some more upside in the markets this summer, but weaker and briefer than previous moves.
For the long view, all of this “free” cash tossed into the system will show up as a bubble of some sort. We can take heart in some good news, however: financial bubbles give us warning signs as they build. Clearly, we’re not there yet.
Great Trading,
D. R.
About the Author: A passion for the systematic approach to the markets and a lifelong love of teaching and learning have propelled D.R. Barton, Jr. to the top of the investment and trading arena. He is a regularly featured guest on both Report on Business TV and WTOP News Radio in Washington, D.C., and has been a guest on Bloomberg Radio. His articles have appeared on SmartMoney.com and Financial Advisor magazine. You may contact D.R. at "drbarton" at "vantharp.com".
Disclaimer
Mailbag

Q: I read your book Super Trader, and I reviewed your Super Trader Program offer. You said in the offer that if you do not have $200k to invest—the program would not be worthwhile. You also mentioned that "if you have $50,000 to $100,000, this program probably doesn’t make financial sense. Instead, take the time to learn about and achieve financial freedom."
My question is, how and where do I learn how to achieve financial freedom as you define it? Where do you recommend that I start? I don't have $50k to $100k. My plan was to start with $20k to $30k and build my account up. What products, seminars, etc. do you recommend that would teach me so that I can get to the $200k level and qualify to [enroll in the Super Trader program]?
I am very eager to learn and will do anything you suggest to get to that level.
A: We used to teach a workshop on Infinite Wealth. It was a 3-day workshop that focused on how to get passive income that was greater than your monthly expenses (which is how I define infinite wealth).
However, what we discovered was that we were covering the same areas as people like Robert Kiyosaki and Suzi Orman. To compete with them, we’d need regular TV shows or book sales in the millions. So we started focusing 100% on our primary business, training traders.
That being said, here are the steps to achieving financial freedom:
First, you need to ask yourself, "What are my average monthly expenses, including taxes and debt payments?”
- Let’s say your monthly expenses are $5,000.
- Let’s also say that 50% of that is debt service and taxes,
- and that perhaps $500 goes toward trivial, non-essential expenses.
Second, you need to ask, “What is my passive income?” This could include such things as:
- Rent income
- Royalties
- Dividends
- Trading income that doesn’t require more than two hours of your time to earn per day
Let’s say you make $1,000 in passive income (for most people, it’s zero). This means that your financial freedom number is $4,000 per month. If you were to find a way to eliminate your trivial expenses, it would drop to $3,500.
Now let’s say you could refinance your house from 7% interest to 3.5% interest. This could reduce your monthly expenses by another $500 a month—bringing your financial freedom number down to $3,000. See? Without much work, we’ve already reduced it by 25%.
Last, you have to figure out how to earn $3,000 per month in passive income.
Ideas:
- Write an ebook that sells 10 copies per day at $10 (that’s $3000 per month).
- Buy some property (at very little down) that gives you a positive cash flow of $500 per month, and repeat the process six times.
- Learn to become a good trader and make 1R or more per day. Our Frog Boot Camp Workshop in August will help you learn how to do that (learn more here).
I also wrote a whole book on this topic, Safe Strategies for Financial Freedom. Many of these ideas above come from this book, plus there are many more. We have copies autographed by the book authors, including myself, which you can purchase for the reduced price of $15.00.
Ask Van...
Everything we do here at the Van Tharp Institute is focused on helping you improve as a trader and investor. Consequently, we love to get your feedback, both positive and negative!
Click here to take our quick, 6-question survey.
Also, send comments or ask Van a question by using the form below.
Click Here for Feedback Form »
Back to Top
Contact Us
Email us at [email protected]
The Van Tharp Institute does not support spamming in any way, shape or form. This is a subscription based newsletter.
To change your e-mail Address, click here
To stop your subscription, click on the "unsubscribe" link at the bottom left-hand corner of this email.
How are we doing? Give us your feedback! Click here to take our quick survey.
800-385-4486 * 919-466-0043 * Fax 919-466-0408
SQN® and the System Quality Number® are registered trademarks of the Van Tharp Institute
Back to Top |


