Tharp's Thoughts Weekly Newsletter (View On-Line)
-
Article Seven Steps for Developing a Low-Risk Idea, Pt. 1 by Van K. Tharp, Ph.D.
-
-
TradingTip Risk-On & Risk-Off Trading—The New Normal, Pt. 4 by D.R. Barton, Jr.
The Core Trading System Is Perfect When you Don't Have a Lot of Time to Trade.
Click Here to Learn More About The Workshops.
 Seven Steps for Developing a Low-Risk Idea Seven Steps for Developing a Low-Risk Idea
Part 1
by Van K. Tharp, Ph.D.
People tend to think it’s hard to develop trading systems. I believe that having a process to follow makes developing trading systems a learnable skill. Let’s list the steps you might take to develop a low-risk idea and then look at each step in detail:
- Knowing the big picture and trading a strategy that will work given that big picture;
- Developing a fictional short-term model for what the market is doing;
- Finding a low-risk trade within the model where your risk is minimal;
- Taking the trade only if your potential profit is at least three times the size of the potential loss;
- Trading it at a risk level that allows you to continue to play the game;
- Continuing to trade the model if the trade works out or
- Adjusting the model if the trade proves that it is no longer valid. Let’s look at each of these seven steps.
1. Know the Big Picture and Develop an Appropriate Strategy
I believe we entered a long-term, or secular, bear market in 2000 and that it should last about another eight years. A secular bear market does not mean that stock prices are in a steady decline over the period; rather, it means that price-earnings ratios will be much lower at the end of the period—in the single-digit range—than they were at the start. A secular bear market may include strong economic cycles, and the market can actually seem to be bullish for long periods. In our current situation, however, the economic fundamentals for the U.S. are perhaps the worst ever on record.
My beliefs about the big picture mean that I will likely not be holding any equity positions for very long. The volatility associated with bear markets means great conditions for shorter-term traders. If inflation appears, commodities and real estate are likely to be very good areas for investing or trading. Because the U.S. dollar may be in for trouble ahead, gold and silver probably make some sense too.
If you understand your big picture and the elements involved in trading it, then you might come up with several types of strategies. You could use a model that predicts when stocks are rising or falling to buy stocks during up markets and short stocks when the market falls. You could develop an inflationary model and apply it to a long-term gold strategy because gold usually does very well in an inflationary market. Another strategy could be to wait for the market to become extremely oversold and then buy stocks that are deeply discounted.
My point is that you need to understand the big picture and what kinds of strategies will work given your view of the big picture. You have to understand the big picture and how it changes in order to make money in the long run.
2. Develop a “Fictional” Model for What the Market is Doing
Part of my big picture is the long-term decline in the value of the dollar. From 2002 until 2008, the U.S. dollar lost about one third of its value. Since then, dollar index has been moving sideways in a range, but for about the last year, it has been rallying.
Let’s say you decide you want to trade a foreign currency pair with a good trend, keeping the big picture in mind. Figure 1 shows a monthly bar chart of the U.S. dollar versus the Japanese Yen. You can easily see the decline in the value of the USD and the appreciation of the Yen since 2006. The trend is very clear. Generally, you would like your trades to be in the direction of the major trend in congruence with the big picture.
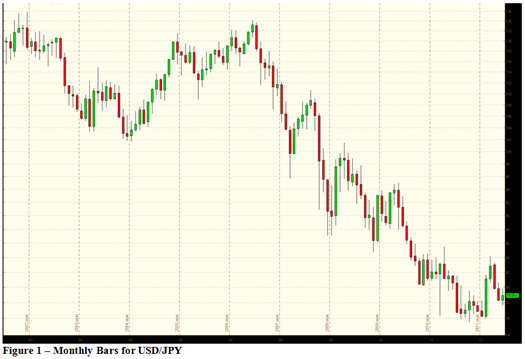
View Larger Image
Your next step is to simply invent a model that will allow you to generate a low-risk idea within that big picture. Now take a look at Figure 2, which is a daily bar chart of USD/JPY since the beginning of 2012.
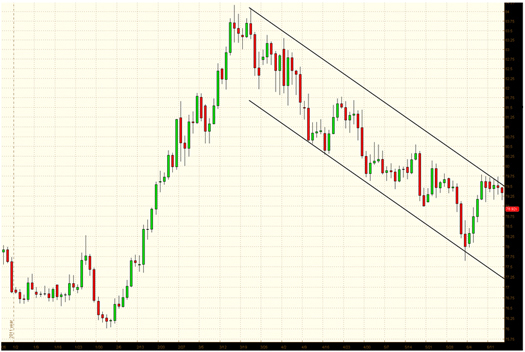
View Larger image
The daily prices seem to be moving in a down-trending channel since the highs in mid-March. Two trend lines have been drawn to reflect this, but are the prices really moving in that channel? Have prices really reacted to and stayed within those lines? Who knows? Whatever the case, we can still use this (invented) channel to find a low-risk trade. Currently, it looks like prices are hitting resistance against the upper trend line, and they seem to be rolling over.
So here’s an idea for a low-risk trade using a channel:
- Determine the direction of the longer-term trend (which in this case is down).
- We want to be ready to trade when prices get to the top of the channel. Ideally, we would like to see price go slightly above the top channel and then come back down through it.
- We don’t enter a trade until prices move in our direction. This is a very important principle for all traders: only take trades when prices are moving in your favor.
Notice that it doesn’t really matter whether the lines we drew reflect anything “real” or not. Do candlestick charts and price channels really reflect anything real? No, they’re simply tools or guidelines that help us set up a low-risk idea. In fact, the worst thing you could do is to start believing that your lines are real phenomena rather than an invented model. If you do that, you might be convinced that your model is right and fail to get out when price action proves it wrong. Many people who trade sophisticated models like Gann, Elliot Wave or others with similar complexity may run into trouble if they believe the model more than the market at some critical juncture.
3. Find a Low-Risk Trade That is Set Up By the Model
We’ve already started to do this with our lines on the chart. Our criteria for this low-risk trade include the following ideas:
First, we want the longer-term trend to be in our favor. Consequently, we really only want to take trades that are moving down off the top line. This is happening in the last few bars in Figure 2.
Second, we want to have some point of reference for our trades to set up the low-risk idea. This is the overall purpose of our model. The model suggests that the market is currently moving within the channel we’ve drawn with our imaginary lines. We don’t know that this is truly the case, but the model gives us a frame of reference. If prices leave the channel, the model is no longer useful.
Third, we could be rigid or fairly loose about our frame of reference. If we want to be rigid, we might demand that prices cross (or touch) our upper boundary line of the channel and then cross below it again before we could enter. The problem here is that we’d get very few trades. If we are willing to be more flexible, we might just require that prices approach the upper-line reverse and then we could enter a short position. It really doesn’t matter, because you only trade your beliefs anyway. And since you made up the model, you can make up the rules.
Fourth—and this is very important—we must set up a point at which we know that we are wrong about the trade. We might say that if the price reverses after our entry and moves above the upper trend line, we would cover the position. We might also say that if the price just goes sideways for more than a week, then something else is happening, the model is wrong about the trade and we would exit. You must have a clear point at which you declare yourself wrong about the trade so that you exit. The amount you are willing to risk (lose) is your 1R for the trade.
I chose a model based on channel lines because most people can see fairly easily that it’s just made up. However, your model could involve Elliot Wave, Fibonacci numbers, support and resistance, pivot points or anything else you care to invent. In every case, there’s only one purpose for the model: to set up low-risk trades.
I'll discuss steps 4-7 in next week's newsletter.
About the Author: Trading coach and author Van K. Tharp, Ph.D. is widely recognized for his best-selling books and outstanding Peak Performance Home Study program—a highly regarded classic that is suitable for all levels of traders and investors. You can learn more about Van Tharp at www.vantharp.com.
Trading Education
Workshops
Would you like to learn a longer-term system? Check out July.
Would you like to learn a new intraday system? Check out August.
July
21-22 |
$2,295
$2,995
|
Core Trading Systems: Market Outperformance and Absolute Returns
-
Are you more of an investor than a trader but want to manage your funds a bit more actively?
-
Do you have very little time to trade?
-
Does your retirement plan offer only limited choices on where you can put your money?
-
Are you a short-term trader who wants to put some of your equity to work in intermediate and longer-term systems?
Learn profitable longer-term systems that take very little of your time to trade.
|
Cary, NC |
August
3-5 |
$3,295
$3,995
|
Frog Trading System Boot Camp
- Do you have the patience and the discipline to follow a simple trading system consistently to earn profits in the long run?
- Have you been looking for a trading system that doesn’t require market technicians’ certification or an engineering degree to understand?
- Would you like to learn how to trade one system really, really well instead of trying to remember all the rules for a dozen systems?
- Would you like daily setups and trades?
The Frog Trading System Boot Camp is the first of a new type of workshop we’re presenting. Learn More.
Presented by Ken Long |
Cary, NC |
August
24-30 |
$5,090
(combo) |
Peak 101 and Peak 203 (AKA, The Happiness Workshop) |
Cary, NC |
| Sept 21-28 |
Varies |
Mechanical Systems for Day and Swing, and Discretionary Live Trading
Presented by Ken Long |
Cary, NC |
| October 19-21 |
$2,295
$2,995
|
Peak Performance 101
Van Tharp's Signature Workshop |
Cary, NC |
| October 23-26 |
$3,295
$3,995
|
Peak Performance 202
with Van Tharp and Dr. Libby Adams |
Cary, NC |
To see our full workshop schedule, including dates, prices and location, click here.
Trading Tip 
Risk-On & Risk-Off Trading—The New Normal
Part 4
by D.R. Barton, Jr.
For the past few weeks, we’ve been looking at risk-on, risk-off (RORO) market behavior. Risk-on assets tend to attract more capital during up, or greed-based markets, while the opposite is true of risk-off assets, which are more attractive in down, or fear-based markets. Depending on the condition of the market, institutions tend to flock to either risk-on or risk-off assets en masse; as Jeremy Grantham explains, when you’re trading with other people’s money, the last thing you want is to be wrong alone.
RORO trading also leads to higher correlations among specific types of assets, whether positive or negative; especially in periods of higher volatility, assets do not move in isolation. Understanding the effects of these new patterns on the market is essential to managing trades in what has become the “new normal” RORO-influenced market.
Implications for Trading in a Risk-On, Risk-Off World
RORO trading by institutions and individuals has led to three distinct market types. The first is the grinding bull. An apt metaphor for market movement says that the market crawls up the staircase. In this market type, the upward movement is slow and relatively steady with small and short-lived pullbacks. A great recent example of this market condition began after the December 19th low late last year and lasted until April. Let’s look at a chart:
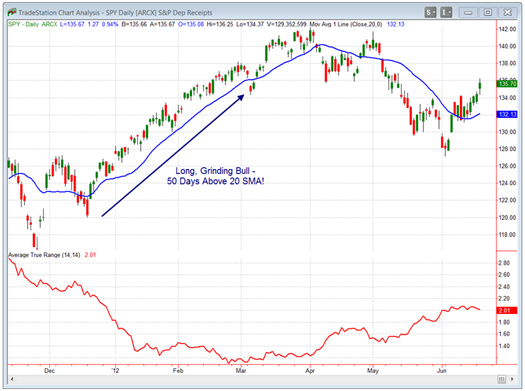
View Larger Image
If the grinding bull is the climb up the stairs, the volatile bear market is a jump out the window. Down markets tend to have much more volatility and movement in the short-term than we would see in an up market and unfold much more quickly. Let’s look at the extension of the grinding bull chart from earlier:
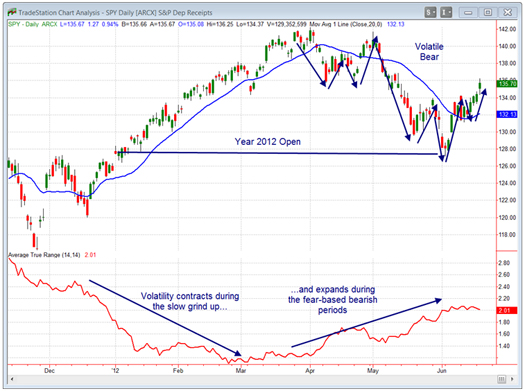
View Larger Image
Note that we were near the yearly high on May 1st and gave back four months of gains in one short month as the market “jumped out the window” in May. Sell in May and go away, indeed!
As noted in the chart above, the grinding bull is accompanied by volatility contraction, while the wild bearish times see greatly expanded volatility.
These grinding bull and volatile bear markets are separated by periods of range consolidation. In an earlier article, I described this phenomenon as “pop and chop” (click here to view that article), which is characterized by a quick directional move (or “pop” up or down) and then a longer period of sideways movement (the “chop”).
What to Do about Risk-On, Risk-Off Trading
Van and I have always been adamant about the importance of understanding market types. With these new patterns of market movement, it’s especially vital to use the tools at our disposal to understand the market type on a long-, intermediate- and short-term basis.
For the longer term, Van’s monthly market review is an excellent resource; it contains tools like the SQN, market volatility, inflation/deflation, and updates on the three major indices.
For the intermediate and short term, we can use simple but effective support and resistance levels to monitor range consolidations and break outs. Combined with any type of dynamic price band (Bollinger, Keltner, etc.) and some short-term sentiment indications like VIX, support-and-resistance levels can be great guides to finding short-term turning points in volatile bear markets.
As I’ve written many times before, indicators of market extremes like the VIX are much more useful for helping to identify pullbacks in bull markets and much less useful for identifying tops. However, most of our short-term sentiment tools provide useful guidance for intermediate tops AND bottoms in volatile bear markets.
We hope you’ve enjoyed this four-week series on risk-on, risk-off. As new developments and insights come along, we’ll be glad to pass them on. A special thanks to Meg Barton, a very talented writer and researcher in her own right, for contributions to this article. Please let us know if you’ve found the series useful or if you have additional RORO insights by sending an email to drbarton “at” vantharp.com.
Great Trading, D. R.
About the Author: A passion for the systematic approach to the markets and a lifelong love of teaching and learning have propelled D.R. Barton, Jr. to the top of the investment and trading arena. He is a regularly featured guest on both Report on Business TV and WTOP News Radio in Washington, D.C., and has been a guest on Bloomberg Radio. His articles have appeared on SmartMoney.com and Financial Advisor magazine. You may contact D.R. at "drbarton" at "vantharp.com".
Disclaimer

Peak Performance Home Study Program for Traders and Investors
Are you interested in learning how to make extra profits from the market over the next year or two?
With this home study course, you’re going to learn to do exactly that with your trading—regardless of any limits you may have put on your time—by discovering the simple "edge" you need for super success in the markets today.
Once you master key trading principles often overlooked by even the most experienced investors and traders, you’ll finally understand and possess the same money-making and cash-flow secrets that have catapulted certain astute traders to superstar wealth and success status. You’ll understand why they continue to make money while everyone else is losing their shirts.
Learn More
Buy Now
"I would recommend the new Peak Performance Course to anyone who wants to excel in their trading. In fact, I would recommend that no one actively trade until they have gone through this material several times and understand it completely. The new version is excellent, and I found the new chapters on personal responsibility and changing your beliefs to be the most valuable. This course forces you to do the self-work that is critical to successful trading and improving all aspects of your life!"—a happy customer
Ask Van...
Everything we do here at the Van Tharp Institute is focused on helping you improve as a trader and investor. Consequently, we love to get your feedback, both positive and negative!
Click here to take our quick, 6-question survey.
Also, send comments or ask Van a question by using the form below.
Click Here for Feedback Form »
Back to Top
Contact Us
Email us at [email protected]
The Van Tharp Institute does not support spamming in any way, shape or form. This is a subscription based newsletter.
To change your e-mail Address, click here
To stop your subscription, click on the "unsubscribe" link at the bottom left-hand corner of this email.
How are we doing? Give us your feedback! Click here to take our quick survey.
800-385-4486 * 919-466-0043 * Fax 919-466-0408
SQN® and the System Quality Number® are registered trademarks of the Van Tharp Institute
Back to Top |


