Tharp's Thoughts Weekly Newsletter (View On-Line)
-
Article Market Condition: Bull Normal by Van K. Tharp, Ph.D.
-
-
Trading Tip April 2012 SQN® Report by Van K. Tharp, Ph.D.
Peak Performance Workshops May 2012
$700 Early Enrollment Discounts Expire Next Week, May 9th
Two core sets of beliefs determine your trading results: your beliefs about yourself and your beliefs about the market. The effective question for any trader is, “which of my beliefs are useful (or, which beliefs help me make money and reach my objectives)?” Until you have your own useful beliefs, you won’t succeed in trading.
These workshops help traders identify and develop their beliefs to trade with more profit and less stress.
 Market Update for the Period Ending April 30, 2012 Market Update for the Period Ending April 30, 2012
Market Condition: Bull Normal
by Van K. Tharp, Ph.D.
I always say that people do not trade the markets; they trade their beliefs about the markets. Consequently, I'd like to point out that these updates reflect my beliefs. I find the market update information useful for my trading, so I do the work each month and am happy to share that information with my readers.
If, however, your beliefs are not similar to mine, then this information may not be useful to you. If you are inclined to perform some sort of intellectual exercise to prove one of my beliefs wrong, simply remember that everyone can usually find lots of evidence to support their beliefs and refute others. Know that I acknowledge that these are my beliefs and that your beliefs may be different.
These updates are in the first issue of Tharp's Thoughts each month. This allows us to get the closing month's data. These updates cover 1) the market type (first mentioned in the April 30, 2008 edition of Tharp's Thoughts and readable on our web site), 2) the five-week status on each of the major U.S. stock market indices, 3) our four star inflation-deflation model plus John Williams' statistics, and 4) the movement of the dollar. I now report on the strongest and weakest areas of the overall market in a separate SQN® Report. I may come out with that report twice a month if there are significant market charges.—Van K. Tharp
Part I: Commentary—The Big Picture
Remember that we are in a long-term (probably 20-year) secular bear market. If you had invested your money in the stock market back when the secular bear began in 2000 and held it there until now, you’d be quite unhappy with the result—especially after you included the effects of inflation and the decline in the value of the U.S. dollar.
Secular bear markets do not necessarily correspond with weak big-picture fundamentals, but the fundamentals behind the current bear are very weak. I’m expecting this bear market to last eight more years at minimum, which means that the market could just go sideways with a lot of volatility.
Secular bear markets, however, don’t say much about where prices will go, just price-earning-ratios, which will probably go down into the single digits for blue chip stocks. We’re still a long way from that, though.
Right now, the market is going up nicely. Between May and October, however, the stock market tends to experience a seasonal down phase, partly because of lack of inflows. From November to May, pension money pours into the market, but after that, there’s less money flowing in. It’s now May, so whether or not the bull will continue will depend upon how much stimulation the Federal Reserve decides to give to the economy. This is an election year, so it might be a lot. The Federal Reserve (which is not part of the government but instead a privately owned institution) has said that it will continue to stimulate the economy and keep interest rates low. This created a nice run-up in the market and a nasty shock for all of those who went big into treasuries recently (for safety).
Part II: The Current Stock Market Type Is Bull Normal
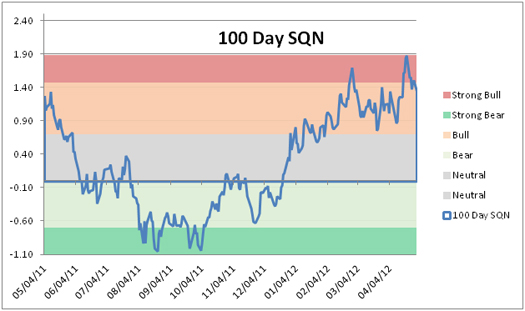
Each month, I look at the market SQN® score for the daily percent changes in the S&P 500 Index over 200, 100, 50 and 25 days. For our purposes, the S&P 500 Index defines the market. The 200-day SQN is neutral. The 25- and 100-day SQN scores are bull, while the 50-day is strongly bullish. We use the 100-day SQN score, which is bullish, as shown in the chart below.
Here’s a weekly candlestick chart of the S&P 500, so you can see how the SQN scores relate to the actual prices.
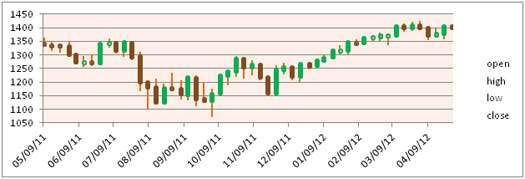
Notice the nice uptrend that has occurred since last December and how it was reflected in the market type. We actually had quite a strong period in which the market switched to strong bull, followed by some weakness, but it’s still firmly in bullish territory.
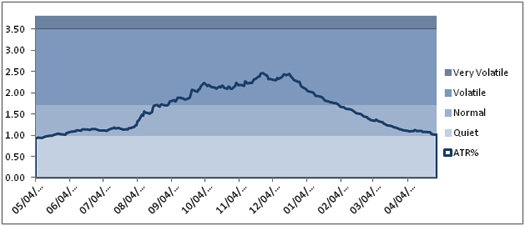
The next graph shows that the market volatility is now normal. This is a great sign that there is still more up movement to come.
The next table shows the activity of the three major U.S. indices.
| Weekly Changes for the Three Major Stock Indices |
| |
Dow 30 |
|
S&P 500 |
|
NASDAQ 100 |
|
| Date |
Close |
% Change |
Close |
%Change |
Close |
% Change |
| Close 04 |
10,783.01 |
|
1,211.12 |
|
1,621.12 |
|
| Close 05 |
10,717.50 |
-0.60% |
1,248.29 |
3.07% |
1,645.20 |
1.50% |
| Close 06 |
12,463.15 |
16.29% |
1,418.30 |
13.62% |
1,756.90 |
6.79% |
| Close 07 |
13,264.82 |
6.43% |
1,468.36 |
3.53% |
2,084.93 |
18.67% |
| Close 08 |
8776.39 |
-33.84% |
903.25 |
-38.49% |
1,211.65 |
-41.89% |
| Close 09 |
10428.05 |
18.82% |
1,115.1 |
23.45% |
1,860.31 |
53.54% |
| Close 10 |
11,577.51 |
11.02% |
1,257.64 |
12.78% |
2,217.86 |
19.22% |
| Close 11 |
12,217.56 |
5.53% |
1,256.60 |
-0.08% |
2,277.83 |
2.70% |
| 30-Mar-12 |
13,212.04 |
8.14% |
1,408.47 |
12.00% |
2,755.27 |
20.96% |
| 05-Apr-12 |
13,060.14 |
-1.15% |
1,398.08 |
-0.74% |
2,762.50 |
0.26% |
| 13-Apr-12 |
12,849.59 |
-1.61% |
1,370.26 |
-1.99% |
2,698.99 |
-2.30% |
| 20-Apr-12 |
13,029.26 |
1.40% |
1,378.53 |
0.60% |
2,676.04 |
-0.85% |
| 27-Apr-12 |
13,228.31 |
1.53% |
1,403.36 |
1.80% |
2,741.34 |
2.44% |
| Year to Date |
13,228.31 |
8.27% |
1,403.36 |
11.59% |
2,741.34 |
20.35% |
Notice that all three indices are up significantly over just 3 months and that the NASDAQ is up 20%.
Part III: Our Four Star Inflation-Deflation Model
In the simplest terms, inflation means that stuff gets more expensive, and deflation means that stuff gets cheaper. There’s a correlation between the inflation rate and market levels, so the inflation rate can help traders understand big-picture processes. Right now, it’s not so easy to tell if we have an inflationary environment or a deflationary one because there are strong crosscurrents of both forces at work. My model shows no trend since mid-2011. Here is my four star inflation-deflation model for the last few years.
| Date |
CRB/CCI |
XLB |
Gold |
XLF |
Total Score |
| Dec 05 |
347.89 |
30.28 |
513.00 |
31.67 |
|
| Dec 06 |
394.89 |
34.84 |
635.50 |
36.74 |
|
| Dec 07 |
476.08 |
41.70 |
833.30 |
28.90 |
|
| Dec 08 |
352.06 |
22.74 |
865.00 |
12.52 |
|
| Dec 09 |
484.42 |
32.99 |
1,104.00 |
14.10 |
|
| Dec 10 |
629.53 |
38.47 |
1,410.25 |
16.00 |
|
| Dec 11 |
564.37 |
33.50 |
1,574.59 |
13.00 |
|
| Aug 11 |
661.93 |
35.34 |
1,813.50 |
13.38 |
+0.5 |
| Sep 11 |
571.38 |
29.36 |
1,620.00 |
11.81 |
-0.5 |
| Oct 11 |
604.28 |
34.45 |
1,724.20 |
13.50 |
-0.5 |
| Nov 11 |
584.22 |
34.53 |
1,746.00 |
12.81 |
+0.5 |
| Dec 11 |
564.37 |
33.50 |
1,574.59 |
13.00 |
+0.5 |
| Jan 12 |
589.00 |
37.18 |
1,744.00 |
14.06 |
0 |
| Feb 12 |
600.32 |
36.97 |
1,724.60 |
14.76 |
-0.5 |
| Mar 12 |
572.94 |
36.97 |
1,662.57 |
15.80 |
+1.0 |
| Apr 12 |
558.55 |
36.67 |
1,651.25 |
15.43 |
-2.5 |
Looking back over the most recent two-month and six-month periods provides the current month's score, given in the table below.
| March 2012 |
CRB
2 Mo |
CRB
6 Mo |
XLB
2 Mo |
XLB
6 Mo |
Gold
2 Mo |
Gold
6 Mo |
XLF
2 Mo |
XLF
6 Mo |
Total Score |
| Current Level |
Lower |
Lower |
Lower |
Higher |
Lower |
Lower |
Higher |
Higher |
|
| Score |
|
-1 |
|
+1/2 |
|
-1 |
|
-1 |
-2.5 |
This month, deflationary seems to have picked up with the strongest score for some time. We’ll see if the trend develops into next month and beyond.
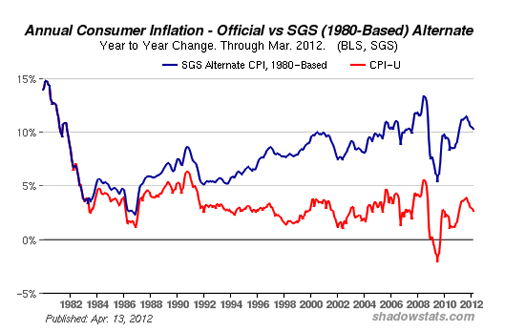
I wanted to also look at the real data as reported by economist John Williams at Shadowstats.com. There are lies, damned lies, and government statistics. Notice that using the pre-1980 methods of measuring the CPI, inflation is currently above 10%, whereas the government is reporting that the CPI is about 3%. Do you feel a little manipulated?
Part IV: Tracking the Dollar
While continued low interest rates have been good for the stock market, they have not been so good for the U.S. dollar. Let’s look at a daily chart that shows the dollar futures contract price for the last six months. You’ll notice that the dollar reached a peak around the first of the year and declined to a trading range between 80.5 and 78.2. It’s currently nearer to the bottom of that range.
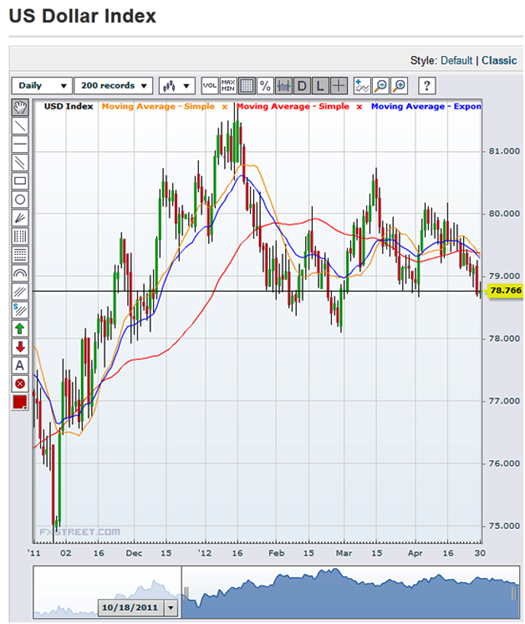
You can see that, since the beginning of the year, the dollar has gone down as the stock market has gone up.
General Comments
If you are playing the equities market and you have systems that work well in bull markets, you should be fully invested in equities. Hopefully, you did that when we first mentioned it some months back and the slight drawdowns did not shake you out. It’s probably safe to be invested for now, considering that we’re clearly at a point where it is relatively easy to make money by being fully invested. The stock market clearly doesn’t see the “end of the world” in 2012, but if you have no proven system, it can still be fairly hard to make money—even under the current market conditions.
If the market type were to move into bear territory and stay there, we would put out a special update. But that doesn’t look too likely in May.
These monthly market updates are not intended for predictive purposes; rather, they’re intended to help traders decide which of their trading systems should work best in the current market conditions. In bear markets—which are almost always volatile by nature—shorter-term strategies, and those that allow going short, tend to work better than long-only or intermediate/longer-term systems.
Which of your trading systems fit this current market type? Of course, this question implies that you have multiple trading systems and that you know how they perform under various market conditions. If you haven't heard of this concept or the other concepts mentioned above, read my book Super Trader, which covers these areas and more, so that you can make money in any kind of market conditions.
Crisis always implies opportunity. Those with good trading skills can make money in this market—a lot of money. There were lots of good opportunities in 2011 and, so far, many more in 2012. Did you make money? If not, then do you understand why not? The refinement of good trading skills doesn't just happen by opening an account and adding money. You probably spent years learning how to perform your current job at a high skill level. Do you expect to perform at the same high level in your trading without similar preparation? Financial market trading is an arena filled with world-class competition. Additionally, and most importantly, trading requires massive self-work to produce consistent, large profits under multiple market conditions. Prepare yourself to succeed with a deep desire, strong commitment and the right training.
About the Author: Trading coach and author Van K. Tharp, Ph.D. is widely recognized for his best-selling books and outstanding Peak Performance Home Study program—a highly regarded classic that is suitable for all levels of traders and investors. You can learn more about Van Tharp at www.vantharp.com.
Trading Education
Workshops
We have two new workshops added to our line-up!
- Forex Trading. This is the three-day version. Last year, our one-day version sold out, and we had to create a waiting list.
- We've added a new Tharp Think event. This is a one-day with Van Tharp for only $299.00
The rest of the line-up consists of our time-tested favorites. Click on the title of the workshop below to find out more.
May
17-19 |
$2,295
$2,995
|
Peak Performance 101
Van Tharp's Signature Workshop |
Cary, NC |
May
21-24 |
$3,295
$3,995
|
Peak Performance 202
with Van Tharp and Dr. Libby Adams |
Cary, NC |
| June 2 |
$299 |
Tharp Think
Learn the 8 important factors to successful trading. |
Cary, NC |
June
14-16 |
$3,295
$3,995
|
Forex Trading
New! Three-Day Workshop |
Cary, NC |
June
18-20 |
$2,295
$2,995
|
How to Develop A Winning Trading System That Fits You
Learn the key elements to develop any type of trading system. |
Cary, NC |
June
23-24 |
$195 |
Oneness Awakening Workshop
with Van Tharp |
Cary, NC |
July
21-22 |
$2,295 |
Core Trading Systems: Market Ourperformce and Absolute Returns
Longer Term Systems That Don't Tie You Down |
Cary, NC |
August
24-30 |
$5,090
(combo) |
Peak 101 and Peak 203 (AKA, The Happiness Workshop) |
Cary, NC |
| Sept 21-28 |
Varies |
Mechanical Systems for Day and Swing, and Discretionary Live Trading |
Cary, NC |
To see our full workshop schedule, including dates, prices and location, click here.
Trading Tip
April 2012 SQN® Report
by Van K. Tharp, Ph.D.
There are numerous ETFs that now track everything from countries, commodities, currencies and stock market indices to individual market sectors. ETFs provide a wonderfully easy way to discover what’s happening in the world markets. Consequently, I now use the System Quality Number® (SQN®) score for 100 days to measure the relative performance of numerous markets in a world model.
The SQN 100 score uses the daily percent change for a 100-day period. Typically, an SQN score over 1.45 is strongly bullish; a score below -0.7 is very weak. We use the following color codes to help communicate the strength or weakness of the ETFs.
- Green: ETFs with very strong SQN scores (0.75 to 1.5).
- Yellow: ETFs with slightly positive SQN scores (0 to 0.75).
- Brown: ETFs with slightly negative SQN scores (0 to -0.7).
- Red: Very weak ETFs that earn negative SQN scores (< -0.7).
The world market model spreadsheet report below contains most currently available ETFs, including inverse funds, but excluding leveraged funds. In short, it covers the geographic world, the major asset classes, the equity market segments, the industrial sectors and the major currencies.
World Market Summary
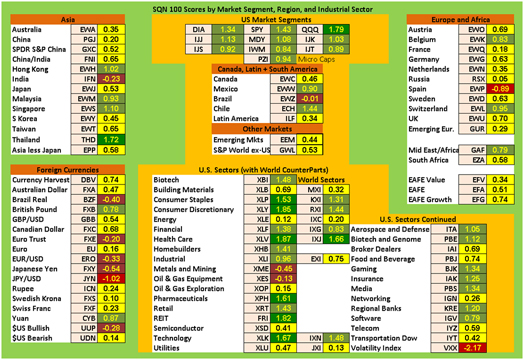
View Larger Image
Hopefully, all of you are trading your bull market systems now and doing quite well. U.S. equities have going up since December, and that trend continued through April, though things were a little shaky recently. Every U.S. stock market segment (as shown in the top center) is green. Most of the U.S. industrial sectors are green or yellow, with just three exceptions: Metals and Mining (XME), Oil & Gas Equipment (XES), and the Volatility Index (VXX).
Money is now beginning to shift out of the U.S. Europe is now mostly yellow with a bit of green. Belgium and Switzerland are green, while Spain looks weak.
Asia is also yellow and green. China turned yellow this month, but the other giant growth country, India, remains brown. Thailand looks excellent, and Singapore, Hong Kong, and Malaysia are all doing well.
Currencies are not as bad as they were last month, but they’re still weak as a class, with the Yen continuing to be the worst among them. The Brazilian Real and the dollar look weak, while the Chinese Yuan and the British Pound seem to be the strongest.
Other Asset Classes, Strongest/Weakest ETFs
The next table shows the relative performance of commodities, real estate and interest rates on the left-hand side. The strongest and weakest areas of all the ETFs are on the right.
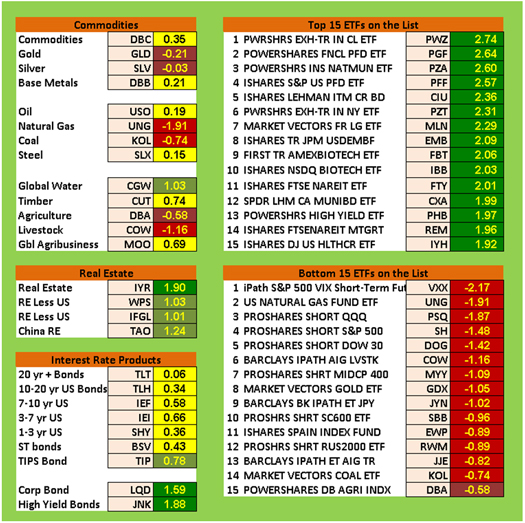
As a group, commodities are terrible, which is why I said in the market update article that most people do not consider inflation to be a problem right now. Natural gas (UNG) is terrible, just as it has been for some time, while livestock (COW) and coal (KOL) are also red. Gold and silver have turned brown for the first time in a long period of time. Last month, the only commodity that was green was timber (CUT), but this month, the only green commodity is Global Water (CGW). All of real estate is now green, with U.S. real estate being the best of the group.
Government interest rate products remain weak, but inflation adjusted bonds (TIP) and both corporate debt ETFs are now green.
Top-performing ETFs still include a lot of municipal debt, but they also include biotech and pharmaceuticals, health care and consumer staples. The worst list is topped by VXX, Natural Gas (UNG) and funds that are short the major market indices. We are actually now seeing gold stocks among the worst-performing ETFs.
What's Going On?
Ken Long used to see trends that lasted six months or more, but that seems to occur less and less now, so you should enjoy the ride while you can. There is a good chance that the market might be neutral by the end of May. Why? Because the big picture is not that good. Fundamentally, the U.S. is in the worst shape it’s been in a long, long time.
Crises always offer opportunities, but to capture those opportunities you MUST know what you are doing. If you want to trade these markets, you need to approach them as a trader, not a long-term investor. We’d like to help you learn how to trade professionally. Trying to navigate these markets without an education is hazardous to your wealth.
All the beliefs given in this update are my own, and though I find them useful, you may not. You can only trade your beliefs about the markets.
Until next month, this is Van Tharp.

Peak Performance Home Study Program for Traders and Investors
YOU are the most important factor in your trading success!
You create the results you want. Going through this home study course, you’ll gain a perspective on the "how" and "why" of your past trading results and learn techniques to increase profits and reduce stress.
Your success as a trader depends upon the amount of work you put into applying the principles of the course to your investing and trading. Get started now and take charge of your trading success!
Learn More
Buy Now
Ask Van...
Everything we do here at the Van Tharp Institute is focused on helping you improve as a trader and investor. Consequently, we love to get your feedback, both positive and negative!
Click here to take our quick, 6-question survey.
Also send comments or ask Van a question by using the form below.
Click Here for Feedback Form »
Back to Top
Contact Us
Email us at [email protected]
The Van Tharp Institute does not support spamming in any way, shape or form. This is a subscription based newsletter.
To change your e-mail Address, click here
To stop your subscription, click on the "unsubscribe" link at the bottom left-hand corner of this email.
How are we doing? Give us your feedback! Click here to take our quick survey.
800-385-4486 * 919-466-0043 * Fax 919-466-0408
SQN® and the System Quality Number® are registered trademarks of the Van Tharp Institute
Back to Top |
|
May 2, 2012 - Issue 575

A Must Read for All Traders
Super Trader
How are we doing?
Give us your feedback!
Click here to take our quick survey.
From our reader survey...
"I think the newsletter is extremely generous and it is a resource I utilize constantly. I have saved every single one since I first subscribed."
Trouble viewing this issue?
View On-line. »
Tharp Concepts Explained...
-
Trading Psychology
-
System Development
-
Risk and R-Multiples
-
Position Sizing
-
Expectancy
-
Business Planning
Learn the concepts...
Read what Van says about the mission of his training institute.
The Position Sizing Game Version 4.0
Picking the right stocks has nothing to do with trading success and neither do amazing trading systems with high percentage wins. The Position Sizing Game teaches you the key elements of trading success. Learn more.
To Download for Free or Upgrade Click Here

Download the 1st three levels of Version 4.0 for free.
Register now. »
Trouble viewing this issue?
View On-line. »

A Thousand Names for Joy: A Commentary
You can read Super Trader Curtis Wee's full review here.
Dr. Tharp is on Facebook

Follow Van through
Twitter »
Van Tharp Trading Education Products are the best training you can get.

Check out our home study materials, e-learning courses, and best-selling books.
Click here for products and pricing
What kind of Trader Are You? Click below to take the test.
Tharp Trader Test
Back to Top

Introduction to Position Sizing™ Strategies
E-Learning Course
Only $149
Learn More
Buy Now
SQN® and the System Quality Number® are registered trademarks of the Van Tharp Institute |