| Feature Article |
Using Simulation to Determine Your Worst Case Drawdown, By Van K. Tharp, Ph.D. |
| Listening In |
Commitment |
|
Quote of the Week: "The
significant problems we face cannot be solved at the same level of
thinking we were at when we created them" ~ Albert Einstein~
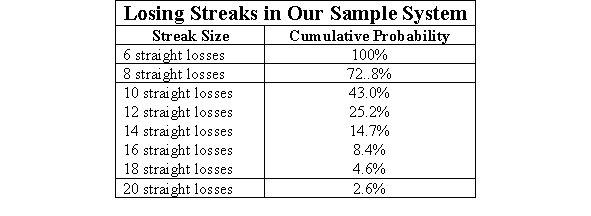
By Van K. Tharp, Ph.D. One way to do safe position sizing is to determine how big of a loss you would be willing to tolerate in your original equity. Let’s say, you are trading $40,000. You would be willing to risk $8,000 of that $40,000 in our trading strategy or 20%. How much could you risk? I usually suggest that 1% would be fairly safe, but let’s look at it one additional way. IITM’s simulator (not yet available) can simulate an R-multiple distribution 10,000 times and keep track of all sorts of information. We plugged in a sample distribution that has two 10R winners, seven 1R losers, and one 5R loser as our system and we’re going to assume that we make 30 trades a month. Thus, we know the expectancy of the system is 0.8, but can we determine what percentage of 30 trade games will have a positive expectancy? Certainly, with 80% losers, we know that some 30 trade blocks will lose money. We can also determine the worst case drawdown in terms of R. In other words, how many times your basic risk are you likely to lose (as a worst case) during the 30 trades. And what’s the worst case drawdown over 10,000 simulations? The first statistic that stands out is that we have about a 82.5% chance of making money in this game in 30 trades. That means if we were doing 30 trades per day, we’d make money on four out of five days. Superb system. If we were doing 30 trades per month, we’d make money on four out of five months. Great system. And, if we were doing 30 trades every year, we’d make money on four out of five years. Good system. Another interesting statistic are the losing streaks we might experience. These are shown in table one. The left column shows the size of the losing streak and the right column shows the probability of getting a streak that big or bigger. Notice that in 30 trades, you have 100% chance of getting at least six straight losers and a 43% chance of getting at least 10 straight losers. Most people would think that a system was broken when they got 20 straight losers, but it apparently would happen about 2.6% of the time. Actually, I’ve played this game about 150 times before various groups. I’ve seen one losing streak of 24 straight losses and another losing streak of 30 straight losses. The game with 24 straight losses actually made money at the end of 30 trades, but the 30 straight losses was a disaster.
But now let’s look at the most critical information for safety – how big might our losses against us be in terms of R? These are shown in the table two The left column shows the size of the drawdown (cumulative loss) in terms of R and the right column shows the size of the probability of getting a loss that big or bigger.
Our simulations showed that the average drawdown was 16.6R and that the maximum in 10,000 simulations was 60R. So how do we use this information to determine position sizing? We decided at the beginning of the section that we were willing to lose up to 20% of our starting equity. If we divided 20% by the average maximum R-multiple drawdown of 16.6R, then we’d be able to risk 1.2%. However, this would give us about a 50% chance of a 20% drawdown in our equity somewhere in the 30 trades. If we use the maximum drawdown of 60R, then we’d get 0.3% risk. Risking 0.3% would tell us that we had about one chance in 10,000 of losing as much as 20% of our starting equity. And if we were willing to tolerate a 5.8% chance of losing 20%, then we should probably risk 0.67% — almost at our original 1% estimate. Once again we must emphasize that simulator results are only accurate when you really know your R-multiple distribution. We know the R-multiple distribution of the marble game, but one can never do better than a rough estimate of the R-multiple distribution of your system.
1 This article was taken from Van’s new book, Safe Strategies for Financial Freedom to be published by McGraw Hill in the spring of 2004.
Excerpts from Dr. Tharp's Discussion Forum.
Reply To This Message
Author: Chris,
Date: 08-25-03 15:49
|


