Tharp's Thoughts Weekly Newsletter (View On-Line)
-
Article Market Condition, Neutral Normal by Van K. Tharp
-
-
-
Fun Check out Photos of VTI Staff Holiday Party

Market Update for the Period Ending December 30th, 2011
Market Condition: Neutral Normal
by Van K. Tharp, Ph.D.
I always say that people do not trade the markets; they trade their beliefs about the markets. In that same way, I'd like to point out that these updates reflect my beliefs. If my beliefs and your beliefs are not the same, you may not find them useful. I find the market update information useful for my trading, so I do the work each month and am happy to share that information with my readers.
If your beliefs are not similar to mine, then this information may not be useful to you. Thus, if you are inclined to perform some sort of intellectual exercise to prove one of my beliefs wrong, simply remember that everyone can usually find lots of evidence to support their beliefs and refute others. Know that I acknowledge that these are my beliefs and that your beliefs may be different.
These monthly updates are in the first issue of Tharp's Thoughts each month. This allows us to get the closing month's data. These updates cover 1) the market type (first mentioned in the April 30, 2008 edition of Tharp's Thoughts and readable on our web site), 2) the five week status on each of the major US stock market indices, 3) our four star inflation-deflation model plus John Williams' statistics, and 4) tracking the dollar. Beginning this month, I will now report on the strongest and weakest areas of the overall market as a separate SQN® Report. And that may come out twice a month if there are significant market charges.
Part I: Commentary—The Big Picture
Let me begin this update (and the New Year) with a synopsis of the big picture. First, the U.S. stock market is in a secular bear market that began in 2000 and should last 15-20 years. During this time, prices may go up or may go down, but the price-earnings (PE) ratio of the S&P 500 should decline dramatically. The following shows a chart of the PE ratio during the last 25 years.
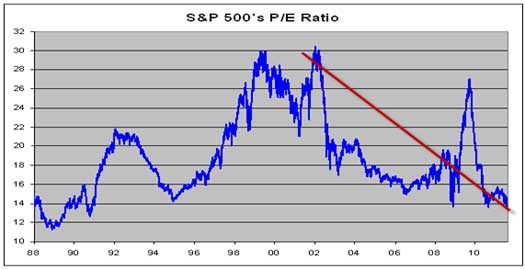
Some figures show the PE ratio at over 100 during the 2008-2009 crash simply because earnings crashed, but that was an anomaly. The chart depicts very well the declining trend. Secular bear markets do not end until PE ratios get into the single digit range.
Even though the secular trend is down, we can still have nice rallies. Some of the best up moves in the markets occurred during the secular bear market in the 1930s. Right now we’ve just moved into Neutral Normal territory in my market type.
A recession is said to occur when the GDP growth is negative, and GDP growth is usually adjusted for inflation. However, the government has manipulated the inflation statistics for some time. If you use the original inflation calculation, we have been in a recession since 2000 with the exception of one quarter of 2003 as you can see in the following graph from shadowstats.com.
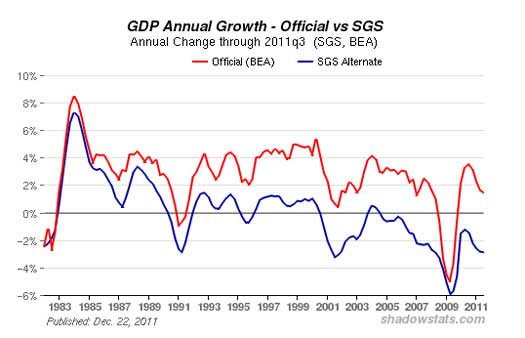
www.shadowstats.com/alternate_data/gross-domestic-product-charts
Notice that the blue line (the original GDP growth calculation method) has only been above 0% for one quarter since 2000.
The U.S. will probably never get itself out of the debt hole that it is currently in without some major heartache. We will probably have to default on at least the future contractual obligations such as Medicare and social security, and make budgetary reforms that politicians would not otherwise make. The U.S. dollar is in serious trouble long term.
Unfortunately, the situation in most of the world isn’t much better with the Euro crisis seeming to outdo the dollar crisis on a regular basis.
The US government relies on a private banking system, the Federal Reserve, to fix all of this by printing money and manipulating interest rates. The Fed has taken extraordinary measures in the recent past, however, we have a new problem: banks have not been lending money at historical rates to create the multiplier effect from the Fed’s printing press. Instead, the multiplier is below 1.0.
Secular bear markets do not necessarily correspond with fundamentals, but the fundamentals behind the current economic situation are very, very weak. I’m expecting this bear market to last 20 years at a minimum.
Part II: The Current Stock Market Type Is Neutral Normal
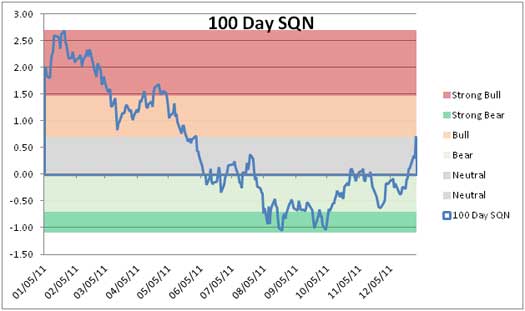
Each month I look at the market SQN® score for the daily percent changes over 100, 50 and 25 days. For our purposes, the S&P 500 Index defines the market. The 200- and 100- and 50-day SQN scores are neutral, while the 25-day is bullish. The 100-day SQN score is shown in the graph below.
The next graph shows the market volatility over the last year.
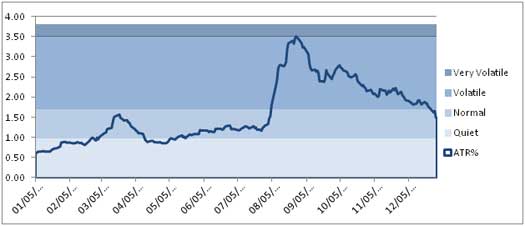
Volatility has decreased to normal range since its peak in mid-August. Very volatile conditions, however, could still develop quickly. Look how fast volatility rose in early August.
The Dow Jones and the NASDAQ both ended up slightly for the year, while the broad market (The S&P 500) was effectively unchanged.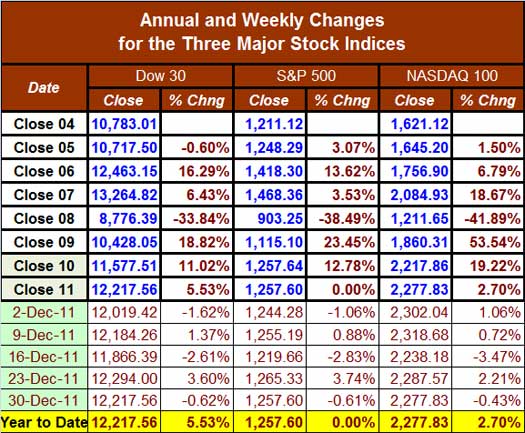
Part III: Our Four Star Inflation-Deflation Model
In the simplest of terms, inflation means that stuff gets more expensive and deflation means stuff gets cheaper. There’s a correlation between the inflation rate and market levels, so it’s of use to traders’ big picture processes. Given world conditions, it’s not so easy to tell as there are crosscurrents of both inflationary and deflationary forces at work. December continued to present a mixed message in this area and my model shows no strong trend since mid-2011. Here is my four star inflation-deflation model over the last few months and years.
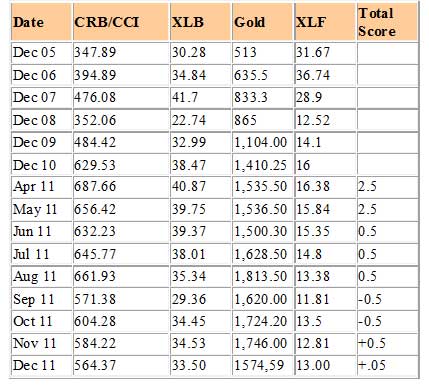
Looking back over two-month and six-month time periods provides the current month's score
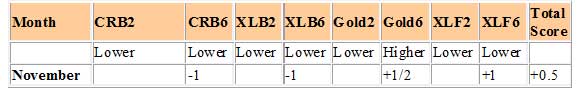
We’ve moved back into slight inflation, however, I want to point out that part of the reason that we are not seeing massive inflation is that the banks are not lending.
Part IV: Tracking the Dollar
This Eurozone debt crisis continued to dominate the currency markets and continued to make the dollar look very good for the month of December. In fact, the fall in gold in the last few months has primarily been due to the rise in the dollar. It’s a strong trend at the moment though it didn’t break the early January 2011 high for the year.
Let’s look at the daily chart of the dollar futures contract price for January – December 2011.
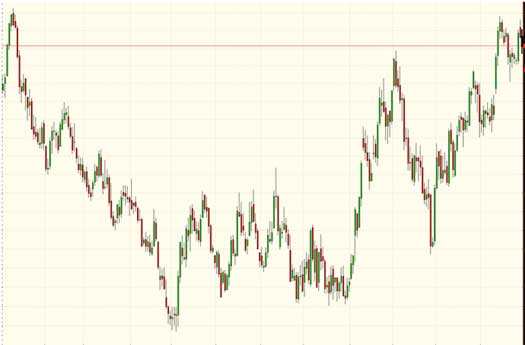
As you can see, the trend is definitely up, although it is again approaching old resistance levels. But I doubt of the price of the dollar will depend upon those levels. Instead, it depends on the psychology of the dollar versus the Euro which is a regular yo-yo event.
General Comments
I noticed one of the popular financial magazines for the New Year had the headlines, “2012—Where to Invest Now?” Here were their suggestions:
- Buy and hold their portfolio of six stocks for the year. (They indicated that their 2011 portfolio returned 16% from Nov 2010 through Nov 2011.)
- They offered six different ETF strategies. They suggested readers buy one of their portfolios in the allocation recommended and hold it for the year.
- Dump a certain set of mutual funds.
- Buy Apple.
- Watch a particular set of indicators: the S&P500 related to its 200-day moving average, the consumer confidence index, jobless claims, the U.S. dollar index, and the PE ratio of the S&P 500. (They neglected, however, to tell you what to do with your portfolio if the indicators behaved badly.)
This magazine also provided new rules for investing in 2012:
- Buy on weakness, sell on strength.
- Focus on dividends.
- Set low-ball limit orders.
- Avoid high-octane, all-or-nothing mutual funds.
Most people lose money following rules and recommendations like these but this is what the public gets from the investing industry and the financial media. If it really was as simple and as easy as following a magazine article’s suggestions, wouldn’t most people make lots of money from their investing? If you want to do well consistently in the markets, you need to prepare yourself and understand trading. To succeed at trading, you need about as much education as you need to do well in any profession.
You will do much better approaching this market in particular as a trader rather than an investor. Even many experienced traders, however, struggled with the sudden and substantial moves in 2011. You can expect those kinds of conditions to continue for some time. If you don’t have the trading systems and the temperament to handle the current volatility in the markets right now, sitting in cash (i.e., keeping your capital) may be a viable alternative to risking it in a market that could quickly revert to bear volatile conditions.
These monthly market updates are not for predictive purposes but rather to help traders decide which of their trading systems should work best in the current market conditions. In bear markets, which are almost always volatile by nature, shorter term strategies, and those that allow going short, tend to work better than long only or intermediate/longer-term systems.
Which of your trading systems fit this current market type? That question implies that you have multiple trading systems and that you know how they perform under various market conditions. If you haven't heard that concept before or the other ideas mentioned above, read my book Super Trader, which covers these areas and more so you can make money in any kind of market conditions.
Crisis always implies opportunity. Those with good trading skills can make money in this market—a lot of money. There were lots of good opportunities in 2011. Did you make money? If not, then do you understand why not? The refinement of good trading skills doesn't just happen by opening an account and adding money. You probably spent years learning how to perform your current job at a high skill level. Do you expect to perform at the same high level in your trading without similar preparation? Financial market trading is an arena filled with world class competition. Additionally and most importantly, trading requires massive self-work to produce consistent, large profits under multiple market conditions. Prepare yourself to succeed with a deep desire, strong commitment, and the right training.
About the Author: Trading coach, and author, Dr. Van K. Tharp is widely recognized for his best-selling books and his outstanding Peak Performance Home Study program—a highly regarded classic that is suitable for all levels of traders and investors. You can learn more about Van Tharp at www.vantharp.com.
Trading Education
$700 Early Enrollment Discounts Expire Next Week, January 11th, on Peak Performance 101 and Peak Performance 203.

Trading Tip
December 2011 SQN® Report
by Van K. Tharp, Ph.D.
There are numerous ETFs that now track everything from countries, commodities, currencies, and stock market indices, to individual market sectors. ETFs provide a wonderfully easy way to discover what’s happening in the world markets. As a result, I now use the System Quality Number® (SQN ®) score for 100 days to measure the relative performance of numerous markets in a world model.
The SQN 100 score uses the daily percent change for a 100-day period. Typically, an SQN score over +1.45 is strongly bullish; a score below -0.7 is very weak. We use the following color codes to help communicate the strength or weakness of the ETFs:
- Green: ETFs with very strong SQN scores (0.75 to 1.5).
- Yellow: ETFs with slightly positive SQN scores, which are not as strong as the green ones (0 to 0.75).
- Brown: ETFs with slightly negative SQN scores (0 to -0.7).
- Red: Very weak ETFs that earn negative SQN scores (< -0.7).
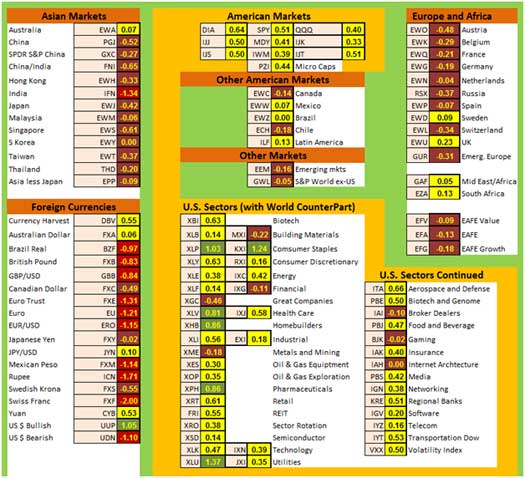
The World Market Model spreadsheet report below analyzes most of the currently available ETFs and includes inverse funds but excludes leveraged funds. In short, this model covers the geographic markets of the world, the major asset classes, the equity market segments, the industrial sectors, and the major currencies.
World Market Summary
Last month, everything was either brown or red with five exceptions: the volatility index (VXX), utilities, the Japanese Yen, the Yen/USD, and the U.S. Dollar. Let’s see how much difference a month can make.
This month the entire U.S. market has moved to yellow. Mexico, Brazil, Latin America and Australia are also yellow.
Even more interesting is that most of the U.S. sectors are now yellow or light green with only “Great Companies” and “Metals and Mining” being brown. There are four green sectors which, in order of their SQN 100 scores, are: Utilities, Consumer Staples, Pharmaceuticals, Homebuilders, and Health Care.
Most of Europe is still brown, with the exception of Sweden and the UK which are now yellow. Africa is also yellow. Most of Asia is brown, with India being red (i.e., the worst country right now).
Interestingly enough, most currencies are now red, with the Euro and the Rupee and the Swiss Franc being the worst. The U.S. dollar is the strongest currency (though only temporarily, I believe) with no others being green.
All of these are shown in the chart below.
Click here to view larger chart
Other Asset Classes, Strongest/Weakest ETFs
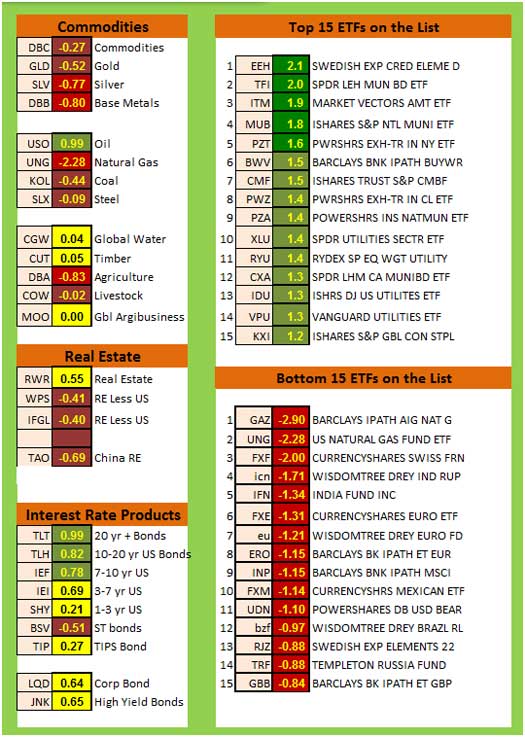
The next table shows the relative performance of commodities, real estate, and interest rates on the left hand side with the strongest and weakest areas of all of the ETFs shown on the right. We see some greens in these asset classes, but it is all in bonds as in previous months and in one new surprise for this month, Oil. In a nutshell, this table shows you where all the money in the markets has gone.
Many of the commodities are now brown (e.g., blended commodities, gold, steel, coal, and livestock). Silver, base metals, agriculture, and natural gas are all red. Natural gas seems to perpetually be in the red, which might be something to watch.
Interest rates are at extreme lows and the amount of debt is very high. Interest rates, therefore, will have to shoot up at some point in the future. When interest rates do finally explode, the price of these instruments will crash. Yet big money has fled to interest rate products for “safety.” Isn’t this a bit ironic?
Safety is not found in an asset class but in smart trading. I wrote that sentence last month and I really like it, so I’m leaving it in – there is no safety is any particular asset class.
What's Going On?
My world model SQN® scores give you a clear snapshot of what is going on in the markets. While we have record low interest rates, lots of money has fled to a very dangerous place: government bonds.
This month, possibly because of the strength of the dollar, money has started to move into the U.S. and our sectors and indices are all now yellow. While this might be an interesting trend to watch, I’m unexcited about a strengthening US dollar given the big picture I described in this month’s market update above. Long term, there are no exciting investments in sight.
On a short-term basis, what might be promising today will probably lose money tomorrow. But that is the climate we have in the world economy.
Until next month, this is Van Tharp. Take care and trade well.

Learn More About Van Tharp's Education Materials
Van Tharp Trading Education Products are the best training you can get.
Check out our selection of home study materials, e-learning, and books.
Click here to see the products and prices
Fun
Click here to see pictures from the VTI Staff Holiday Party
HO HO HO!

Ask Van...
Everything that we do here at the Van Tharp Institute is focused around helping you improve as a trader and investor. Therefore, we love to get your feedback, both positive and negative!
Click here to take our quick, 6-question survey.
Also send comments or ask Van a question by using the form below.
Click Here for Feedback Form »
Back to Top
Contact Us
Email us [email protected]
The Van Tharp Institute does not support spamming in any way, shape or form. This is a subscription based newsletter.
To change your e-mail Address, click here
To stop your subscription look at the very bottom, left corner of this email and click on that link.
How are we doing? Give us your feedback! Click here to take our quick survey.
800-385-4486 * 919-466-0043 * Fax 919-466-0408
SQN® and the System Quality Number® are registered trademarks of the Van Tharp Institute
Back to Top |


