Tharp's Thoughts Weekly Newsletter (View On-Line)
-
Article Seasonal Trends: The January Effect Invades December by D.R. Barton, Jr.
-
-
Trading Tip Recognizing and Trading Patterns: The Quantum Straddle by Russell Lawn
-
Mailbag Translating the Position Sizing™ Game into Real Trading
-

20% Off
All Van Tharp's Core Products
Use Coupon Code
Tharp2011
It's not often that we have deep discounts on all of Van Tharp's products. Take advantage of this sale and invest in your trading education now, so you can increase your profits and reduce your stress in the new year.
Click Here to See the Products and Sales Prices

Seasonal Trends: The January Effect Invades December
by D.R. Barton, Jr.
Heading into December, most peoples’ thoughts are probably turning toward the celebration of Christmas and other seasonal holidays. The end of the calendar year also reminds us naturally of the New Year, which then leads to the realities of tax planning and other associated fiscal matters.
Also during this time of year, institutions have to reposition their money. They take tax losses when necessary and trim other poor performers from portfolios so those don’t have to show up in reports to investors. All this activity leads to several seasonal tendencies that have proven quite robust over many years. Let’s look at a few of these trends that may prove helpful in guiding your trading and investing in the coming weeks.
We’ll look at typical returns for the month of December, throw in some 3rd year presidential cycle data, and end with a fairly broad look at a concept receiving a lot attention lately—the January Effect.
December: A Historically Good Month to Be Invested
Historically, December is one of the strongest performing months of the calendar year. Depending on the study length and market index one uses, December almost always shows up as the first or second best performing month. The driving force could be the hope and good feelings that come with the Christmas season and associated holidays or some other psychological underpinning, researchers don’t seem to know exactly. Regardless of the reasons behind it, consider these numbers:
- December has provided positive returns in 75% of the years since 1950 (46 out of 61) and has averaged a 1.5% return for the month using the S&P 500 Index.
- The last 31 years have provided almost identical performance.
- Of the last 15 pre-election-year Decembers (dating back to 1950), 11 have been positive (still around 75%) with returns almost 80% higher than the average year.
And speaking of the presidential election cycle, much has been made lately over the fact that the 3rd year or the pre-election year of the cycle has seen positive returns ever since the Great Depression. That’s 19 in a row. With one day left in November, the Dow Jones Industrial Average is less than 20 points from its 2010 close. If we have even a slightly positive December, chances look good that the streak will continue.
The January Effect: It Still Works, Just Sooner Rather than Later
Traditionally, the January Effect describes the persistent phenomenon of small cap stocks outperforming their larger cap counterparts in the month of January. This has actually been one of the best documented and researched seasonal tendencies around. Here’s a summary of some of the research that’s out there pulled from articles in the Wall Street Journal, Forbes and Agora’s Money Morning:
- The CBOE found that from 1980 to 2006, small caps in the Russell 2000 outperformed the S&P 500 and the Dow by posting average returns of 2.5% versus 1.7% and 1.6% for the large cap indexes, respectively.
- From 1927 through 2004, small stocks beat large stocks by an average of 2.5 percentage points during January, according to research by University of Kansas professors Mark Haug and Mark Hirschey. Cheap stocks beat more expensive ones by 2.4 points according the Wall Street Journal.
- Each December, Ned Davis Research sends out a list of its January Effect Stocks, which is generated by screening for the smallest 150 stocks in the Standard & Poor's 1500-stock index that are also among the 10% of stocks furthest from their calendar-year closing high. From 1996 through 2009, the portfolio returned an average of 8.6% from mid-December through the end of January, well above the 1.2% gain in the S&P 500. From January 1 to the end of the month, however, it returned just 3.5%.
- Hirsch and Hirsch report in the Stock Trader’s Almanac that small caps far outperformed big caps 40 out of 43 years between 1953 and 1995.
The January Effect had become quite well-known by the early 1990s, and as more players jumped on the bandwagon, the effect has weakened. The Wall Street Journal reports that in the 1970s, a portfolio of small caps outperformed one comprised of large caps by 5.1% during the month of January. That edge or outperformance dropped by more than 80% to only 1% during the 1990s.
Hirsch and Hirsch report similar findings. And further refining the change in performance, the Hirsch duo found that significant small cap outperformance still exists; however, now it has moved to the last two weeks of December!
Comparing the Russell 2000 small cap index with the Russell 1000 large cap index, the Hirschs found that the small cap index’s average return was 2.37 times more than the big caps for the last two weeks of December (annualized rate of 119.9% versus 50.5%).
The Hirschs are in good company noticing that small cap out performance is front-running January and moving into December. Ned Davis was already cited above. And Nigam Arora, a hedge Fund manager and researcher reports in Forbes that he also jumps in ahead of January and starts his small cap/depressed stock investment strategy in December.
Possible Trades
Fortunately, Exchange Traded Funds (ETFs) make it easy to play these late December tendencies that used to be the January Effect. For example, it’s very reasonable to expect the iShares Russell 2000 Index Trust (Symbol: IWM) to outperform its larger cap brethren in the second half of the month.
As we enter December, the market has shown positive results for the month in the past. And while a 75% winning percentage provides a good edge, it is not infallible. As always, apply sound risk management strategies to every trade!
Whatever your faith practice, my prayer is that this season of hope, joy, and love is a blessing for you and your family.
I’d love to hear your thoughts and feedback. Just send an email to drbarton “at” vantharp.com. Until next week…
Great Trading,
D. R.
About the Author: A passion for the systematic approach to the markets and lifelong love of teaching and learning have propelled D.R. Barton, Jr. to the top of the investment and trading arena. He is a regularly featured guest on both Report on Business TV, and WTOP News Radio in Washington, D.C., and has been a guest on Bloomberg Radio. His articles have appeared on SmartMoney.com and Financial Advisor magazine. You may contact D.R. at "drbarton" at "vantharp.com".
Trading Education

Trading Tip
Recognizing and Trading Patterns: The Quantum Straddle
by Russell Lawn
Have you ever tried to walk through an open glass door only to find that the door was, in fact, closed?
Immediately prior to the collision of your body and the glass, there were two futures:
- You walk unimpeded through an opening.
- The glass door blocks your path.
The point of realization between the perceived future and the actual future is the collapsing of the two possible future realities into the present. It requires a switch between one (ultimately) false perception (lacuna) and one (ultimately) true perception. If you were to have stepped back from the door into the light conditions that obscured the glass, your senses may have allowed you to perceive two parallel universes of “glass” and “no glass.” This visual metaphor offers the observer a potential quantum leap.
In his book Feeling into Matter: A New Alchemy of Science and Spirit, Fred Alan Wolf, Ph.D. gives one interpretation of a quantum leap:
“The ‘many worlds’ or ‘parallel universes’ version of quantum physics states that the observer, in observing, is actually becoming a part of the observed by noticing and remembering what he or she experiences. If a quantum system is capable of being observed in one of several possible states, then when an observation occurs, the system enters all of these states and the observer’s mind splits into a companion state associated with each possible physical state of the system.”
Trading Possible Futures in the Present
Likewise in trading analysis, there are two futures: the perceived and the actual. The same set of data in the price chart for Crude Light Oil (/CL) as of 7th September 2011 below can be read as two possible futures.
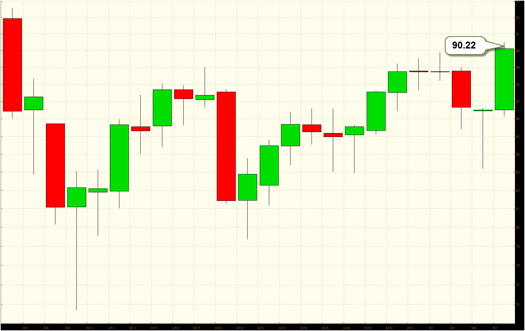
One future is bullish because there is a rising trend. The other future is bearish because 90.22 resistance to a further price rise. This level appears to be the finalization of an ascending triangle pattern that would produce a break down in price subsequent to reaching this level.
As we move through time and new bars appear on the graph, one future falls away and the other one is realized.
At each point in time, questions arise about the various possible futures:
- Do I favor one possible future over another? Why?
- What if I am wrong?
- Will I trade my preferred future or both futures as a single, alternative future?
Pattern Recognition
The above crude oil scenario relates two possible futures based on pattern recognition which denotes recognized patterns. But what if you don’t see a pattern?
The movie What the Bleep Do We Know! sets out the dilemma of Native Americans in the Caribbean who were first able to observe Christopher Columbus’s ships on the horizon sailing towards them—they could not see them.
They could not see the ships because they had no concept of ”sailing ship.” They could not recognize what it was, namely, the pattern of a sailing ship. It was only the repeated interaction and observation by the witch doctor that enabled him to observe the ships and then point them out to others.
In like manner, observing price charts over an extended period of time will allow you to ascertain patterns, subtleties, and distinctions previously invisible to you.
In the modern era of sophisticated computer graph analysis, however, the choice of patterns comes close to overload. Do you prefer order flow analysis? If so, do you use a pivot point defined by Fibonacci extension levels or Market/Volume Profile levels? Do you include the vertical level by Fibonacci time extensions? Do you prefer fractal crossovers in the horizontal and vertical dimension? Is all of that irrelevant if the anticipated movement from pivot point to pivot will be profitable if you trade both directions and the test of profit is sufficient deviation from the mean? What is an acceptable loss ratio with that particular pattern in mind?
The analogy between quantum physics and trading graphs is striking as is the endless detection or discounting of “new” patterns, all of which relies on a spontaneous burst from the ether (universe). The spontaneous appearance and disappearance of matter in the form of positive and negative particles appearing as an aura silhouetted against the event horizon of a black hole is equivalent to the spontaneous suggestion of pattern in price.
At its most micro level, however, price is granular and suggests no pattern. Patterns form as data points accumulate. The data points may move past a threshold of judgment [for the subjective trader] to confirm the existence of the pattern or collapse into a “non pattern.” Traders straddle this quantum threshold consciously or unconsciously. One trader's “non pattern” collapse potentially confirms another trader’s different pattern formation. The “confirmation” or “non confirmation” is dependent on the anticipated conscious projection of data points into the future. This can be source of constant fascination and challenge to market participants. The value of understanding patterns is in constructing a frame work within which a trader can understand and analyze many other frame works.
There’s at least one simple strategy that provides some psychological affirmation in such an uncertain environment. When you scale into a position and reach the first price target, the second and possible third scale-ins can fail, but you still will have a winning trade.
Your Psyche’s Future
Your psychological future is the alternative possible future pattern you weight as most likely to occur. Once you are sure, it is in the past. You cannot have a psychological future whose pattern you do not recognize and are willing to believe in.
The psyche is dependent on a conscious construction of the present and future altered (present) states. Where the conscious future is realized, it transitions into a physiological present state. Your beating heart is not dependent on you consciously imagining the beating of your heart at a future point in time. That said, you can never win a lotto prize without consciously imagining the possibility of doing so and going out to buy a ticket. Physiology is always the manifestation of the collapse of the future quantum alternative (conscious) possible futures into the (singular) present. (Mark 11:24 “…believe that you have received that and it will be granted to you.”)
Your work is in learning to recognize the pattern and then believing in the pattern. Only then will you act on it.
About the Author: Russell lives and practices law in New Zealand. His fascination with pattern recognition in the context of quantum physics and the markets led to extensive personal research on his part in this area and the eventually to the creation of this article.
Disclaimer » This article reflects the beliefs of Russell and not necessarily the Van Tharp Institute.
Mailbag
Translating the Position Sizing™ Game into Real Trading
Q: When playing the Position Sizing Game, I have found that I do well if I risk no more than 1.5-2% per trade of closed profits. When I get a run later in the game, I've found that I can risk up to 7%, but go back to 1.5-2% after the first loss. How do I use this in real time? If I have a short-term system and make a profit, upon close of the trade I could use all of my profits from that single trade, plus the 1.5-2% I risked before the trade. Another winner would allow me to put that profit into the next trade until I had 7% of all my equity in the trade. After the first loss, I just go back to 1.5-2% of closed equity.
I'm not sure how I could use it in a long-term trending system. Could I move my stops up and pyramid at the same time, up to 7%?
A: The different levels of the game can help you understand various position sizing aspects. You have the same exact probabilities for a winning trade after a losing trade throughout the level. Why would you not pick a risk amount and stick with that by level? In other words, what difference does a losing trade have on the probabilities of the next trade’s results? Given the probabilities for any given level, what should be your average number of winning trades and losing trades in that level? How often would you expect your trade to win versus lose. Do you understand probabilities enough to think in terms of the likely length of winning trade streaks and losing trade streaks? Think that through.
Prior to Level 7, the earlier levels are more similar to shorter term trading systems. The winning streaks more closely resemble the decision processes you need to make once you have a high R-multiple winning trade as you might find in a trend following system. In this case, how much of your gain would you risk versus how much would you protect? Your trading system rules define your stops, but you control your risk amount through position size. In the game, you can view the “let it ride” option as keeping your whole position in and the reduction in risk as the streak continues as scaling out. From a practical standpoint, however, you are most likely going to succeed with a trend system that scales into a position or scales out—but not both.
—R.J.
Ask Van...
Everything that we do here at the Van Tharp Institute is focused around helping you improve as a trader and investor. Therefore, we love to get your feedback, both positive and negative!
Click here to take our quick, 6-question survey.
Also send comments or ask Van a question by using the form below.
Click Here for Feedback Form »
Back to Top
Fun
Click here to see fun photos from our Peak 202 workshop!

Contact Us
Email us [email protected]
The Van Tharp Institute does not support spamming in any way, shape or form. This is a subscription based newsletter.
To change your e-mail Address, click here
To stop your subscription look at the very bottom, left corner of this email and click on that link.
How are we doing? Give us your feedback! Click here to take our quick survey.
800-385-4486 * 919-466-0043 * Fax 919-466-0408
SQN® and the System Quality Number® are registered trademarks of the Van Tharp Institute
Back to Top |


