Tharp's Thoughts Weekly Newsletter (View On-Line)
-
Article Market Update: Bear Volatile by RJ Hixson
-
-
-
Mailbag How Do High VIX Readings Signal Upward Moves?
-
$700 Early Enrollment Discounts for November Workshops
Expire TODAY (November 3rd)!
If you want to improve your money’s returns, but you don’t necessarily have a desire to become a day trader or swing trader, Dr. Ken Long’s newest workshop, Core Trading Systems: Market Outperformance and Absolute Returns, is just the workshop for you. Learn about this workshop.
Then attend the How to Develop a Winning Trading System Workshop. Our job in this workshop is to teach you what you need to know to develop your own system. The material you will learn is not market or time-frame specific. So whether you trade stocks, futures, currencies or gold, etc., or whether you place 50 trades per day or 50 trades per year, you will learn all of the components that work in any system.
Learn about this workshop.
Learn more about pricing, schedules, location...

Market Update for the Period Ending October 31st, 2011
Market Condition: Bear Volatile
by RJ Hixson for Van Tharp
I always say that people do not trade the markets; they trade their beliefs about the markets. In that same way, I'd like to point out that these updates reflect my beliefs. If my beliefs and your beliefs are not the same, you may not find them useful. I find the market update information useful for my trading, so I do the work each month and am happy to share that information with my readers.
If your beliefs are not similar to mine, then this information may not be useful to you. Thus, if you are inclined to perform some sort of intellectual exercise to prove one of my beliefs wrong, simply remember that everyone can usually find lots of evidence to support their beliefs and refute others. Know that I acknowledge that these are my beliefs and that your beliefs may be different.
These monthly updates are in the first issue of Tharp's Thoughts each month. This allows us to get the closing month's data. These updates cover 1) the market type (first mentioned in the April 30, 2008 edition of Tharp's Thoughts and readable on our web site), 2) the five week status on each of the major US stock market indices, 3) our four star inflation-deflation model plus John Williams' statistics, and 4) tracking the dollar. Beginning this month, I will now report on the strongest and weakest areas of the overall market as a separate SQN® Report. And that may come out twice a month if there are significant market charges. —Van K. Tharp
Part I: Commentary—The Big Picture
October saw an impressive move up in the stock markets, but even that strong bullish performance failed to push the market out of bear territory as measured by Van’s SQN 100 score methodology. Vacillating headlines about the European debt crisis continue to affect the market daily as the situation lingers. The strain on the global financial system showed up dramatically last month as two “mid-size” banking entities, Dexia and MF Global, collapsed in large part as a result of their exposure to European debt.
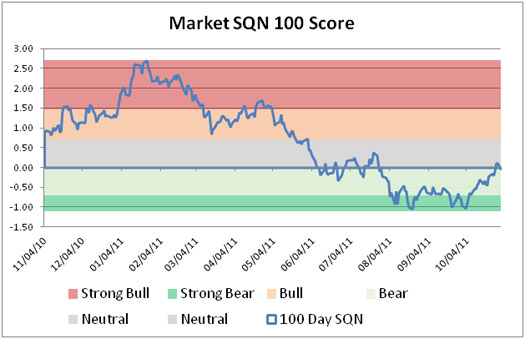
Part II: The Current Stock Market Type Is Bear Volatile
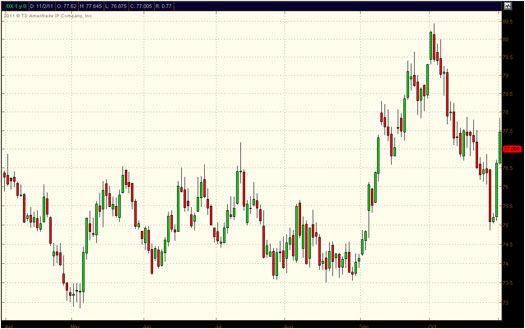
Each month Van looks at the market SQN score for the daily percent changes over 100, 50 and 25 days. For our purposes, the S&P 500 Index defines the market. Given the market performance in the last month, it’s easy to understand that the SQN 25-day and SQN 50-day scores had moved back into bull range. While the SQN 100 score nudged into neutral briefly, it did not continue its rise, and it closed the month in bear mode. Van generally tracks the 100-day SQN score, which is shown in the graph below.
The next graph shows the market volatility over the last year.
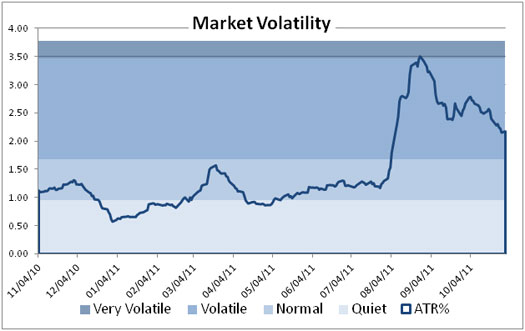
Volatility has decreased a bit since its peak in mid-August. Very volatile conditions, however, could still develop quite quickly. Look how fast volatility rose in that early August period.
Here are the performance figures for the three major US indices on a weekly basis over the last month. You might remember from September’s table in the last market update that the NASDAQ was at basically breakeven for the year while the Dow and S&P were negative for 2011. However, all three indices closed up strongly in October with the Dow and NASDAQ in positive territory for the year. The S&P closed October within several points of breaking even with its 2010 closing price.
| Weekly Changes for the Three Major Stock Indices |
| |
Dow 30 |
S&P 500 |
NASDAQ 100 |
| Date |
Close |
%Change |
Close |
%Change |
Close |
%Change |
| Close 04 |
10,783.01 |
|
1,211.12 |
|
1,621.12 |
|
| Close 05 |
10,717.50 |
-0.60% |
1,248.29 |
3.07% |
1,645.20 |
1.50% |
| Close 06 |
12,463.15 |
16.29% |
1,418.30 |
13.62% |
1,756.90 |
6.79% |
| Close 07 |
13,264.82 |
6.43% |
1,468.36 |
3.53% |
2,084.93 |
18.67% |
| Close 08 |
8776.39 |
-33.84% |
903.25 |
-38.49% |
1,211.65 |
-41.89% |
| Close 09 |
10428.05 |
18.82% |
1,115.1 |
23.45% |
1,860.31 |
53.54% |
| Close 10 |
11,577.51 |
11.02% |
1,257.64 |
12.78% |
2,217.86 |
19.22% |
| 7-Oct-11 |
11,103.12 |
-4.10% |
1,155.46 |
-8.12% |
2,202.76 |
-0.68% |
| 14-Oct-11 |
11,644.49 |
4.88% |
1,224.58 |
5.98% |
2,371.94 |
7.68% |
| 21-Oct-11 |
11,808.79 |
1.41% |
1,238.25 |
1.12% |
2,335.93 |
-1.52% |
| 28-Oct-11 |
12,231.11 |
3.58% |
1,285.09 |
3.78% |
2,401.29 |
2.80% |
| 31-Oct-11 |
11,955.01 |
-2.26% |
1,253.30 |
-2.47% |
2,360.08 |
-1.72% |
| Year to Date |
11,955.01 |
3.26% |
1,253.30 |
-0.35% |
2,360.08 |
6.41% |
Part III: Our Four Star Inflation-Deflation Model
In the simplest of terms, inflation means that stuff gets more expensive and deflation means stuff gets cheaper. There’s a correlation between the inflation rate and market levels, so it’s of use to traders’ big picture processes. Van developed a model to help him track inflation and deflation in the economy. Given these times, it’s not so easy to tell as there are crosscurrents of both inflationary and deflationary forces at work. October presented a mixed message in this area.
Below is the data from Van’s four star inflation-deflation model over the last few months and years.
| Date |
CRB/CCI |
XLB |
Gold |
XLF |
Total Score |
| Dec 05 |
347.89 |
30.28 |
513 |
31.67 |
|
| Dec 06 |
394.89 |
34.84 |
635.5 |
36.74 |
|
| Dec 07 |
476.08 |
41.7 |
833.3 |
28.9 |
|
| Dec 08 |
352.06 |
22.74 |
865 |
12.52 |
|
| Dec 09 |
484.42 |
32.99 |
1,104.00 |
14.1 |
|
| Dec 10 |
629.53 |
38.47 |
1,410.25 |
16 |
|
| Apr 11 |
687.66 |
40.87 |
1,535.50 |
16.38 |
2.5 |
| May 11 |
656.42 |
39.75 |
1,536.50 |
15.84 |
2.5 |
| Jun 11 |
632.23 |
39.37 |
1,500.30 |
15.35 |
0.5 |
| Jul 11 |
645.77 |
38.01 |
1,628.50 |
14.8 |
0.5 |
| Aug 11 |
661.93 |
35.34 |
1,813.50 |
13.38 |
0.5 |
| Sep 11 |
571.38 |
29.36 |
1,620.00 |
11.81 |
-0.5 |
| Oct 11 |
604.28 |
34.45 |
1,724.20 |
13.5 |
-0.5 |
Looking back over two-month and six-month time periods provides Van's model with the current month's score.
| Month |
CRB2 |
CRB6 |
XLB2 |
XLB6 |
Gold2 |
Gold6 |
XLF2 |
XLF6 |
Total Score |
| |
Lower |
Lower |
Lower |
Lower |
Lower |
Higher |
Lower |
Lower |
|
| October |
|
-1 |
|
-1 |
|
0.5 |
|
1 |
-0.5 |
The total score of -0.5 indicates deflation continued in force in October. As you look down the far right-hand column in the first table, the values go from very positive to slightly negative. This represents a shift from more powerful inflationary forces earlier in the year to mildly deflationary forces in the last few months.
Shadowstats Statistics
In the past few months, Van has discussed the probable effects from the ending of QE2. At this point, it appears that the net effect of QE2 was higher stock, fuel, and food prices. While some percentage of households benefited from the stock market boost, the broader set of households endured higher prices at the gas pump and at the grocery store. The first quantitative easing and QE2 seem to be correlated to the inflation rate as you can see below.
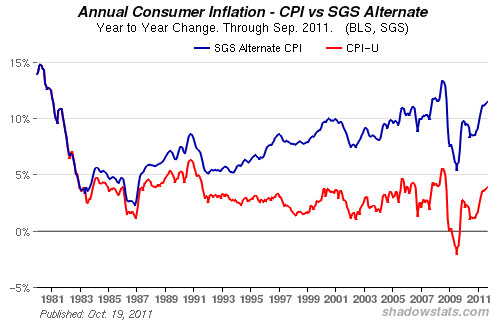
Shadowstats.com calculates the consumer price index the “old” 1980 way (blue line) as well as the current way (red line)—the rate you hear reported by the news media. Van regularly checks the shadowstats.com web site, which shows statistics as the government originally calculated them.
One of the other effects that Van foresaw from QE2 ending was a decrease in the money supply. Though the M3 chart shows a leveling and possible top in the recent month, you can see a distinct peak very recently in the M2 and M1 charts. Here’s the latest M2 chart from Shadowstats.
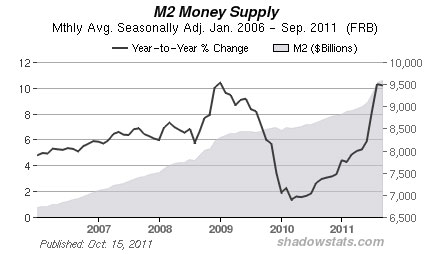
I’m no economist and haven’t read Van’s specific point about a post-QE2 money supply shrinkage elsewhere, but the peak on the chart seems pronounced and timed uncannily with QE2 ending. Such a post-QE2 shrinking of the money supply would act as a deflationary force in the economy. Additionally, the Fed’s Maturity Extension Program (MEP) or Operation Twist also looks to have potentially deflationary consequences. That was not the Fed’s intent, but such programs can have unintended consequences.
Part IV: Tracking the Dollar
Last month, the dollar fell nearly as much as it had risen in September. Why did the dollar fall though? Could confidence in a viable resolution to the European debt crisis have improved that much? What else in the last month might have caused traders to sell dollars? In any case, the dollar didn’t reach the base level it established back in the summer and the last two months have offered shorter term FX traders plenty of volatility for shorter term trading.
General Comments
October’s significant rise erased September’s drop and market volatility abated somewhat from its recent very high levels as well. None the less, Van’s SQN methodology shows the market to be in a bear volatile mode.
The European debt situation is weighing heavily on the markets right now. One analysis firm recently flow charted the possible scenarios for how the crisis could unfold. Regardless of the various paths that the Eurozone players took for the so-called PIIGS countries, every one of them ended sooner or later at the same outcome—a European banking crisis.
A European banking crisis has much broader implications, and Van has written previously on the trouble that has been brewing in the global financial sector. This sector never completely recovered after the 2007-2008 crisis and is now subject to additional strains brought on by the marketplace and governing authorities.
A sign of that strain was the failure of two notable banks last month that seemed to happen quite rapidly. Dexia went from passing its regulator’s stress test to failure in less than three months, and MF Global declared bankruptcy only weeks after earning satisfactory credit ratings.
While Europe and its current Greek drama sub-plot dominate the headlines, remember that similar debt situations exist around the globe. Many developed nations have total (public plus private) debt to GDP ratios in the hundreds of percent. This level of debt has more immediate implications on currency rates and bond prices, but the reality permeates both global and local economic affairs.
Here in the US, the economy is weakening—from an already relatively weak condition. One Harvard economist and another notable economist are calling this an ongoing recession or even a slight depression. A number of macroeconomic factors explain the circumstances:
- The employment situation has not appreciably improved with 9 million people (or substantially more if you ascribe to shadowstats.com figures) out of work.
- Real disposable income for those still working has fallen as a result of lower real wages, higher prices for living expenses and higher taxes.
- Inventory levels have been completely replenished in the last two years and are set to come down.
- Worker productivity is flat to declining.
All of the conditions mentioned above will take more than one month, one quarter, or even one year to right themselves. It will take a number of years for these issues to work themselves out. Coincidentally, Van sees the secular bear market continuing for another 5-9 years based on historical cycles; however, that does not mean the market will slowly decline for the next couple of years. Secular bear markets can be long periods of major drops and huge rallies. Look back to see how the market behaved in the 1930s.
In the meantime, long-term investors may want to think more defensively and more short term. In fact, a fund manager recently wrote something to the effect of “strategic means tactical for the foreseeable future.”
Tactical implies more of a trading approach rather than an investing approach. Even for traders, though, the sudden and substantial moves in this market environment can be challenging. If you don’t have the trading systems and the temperament to handle the volatility in the equities (and debt!) markets right now, sitting in cash (i.e., keeping your capital) may be a viable alternative to trying to grow your capital in a bear volatile market.
As Van has explained,
these monthly market updates are not for predictive purposes but rather to help traders decide which of their trading systems should work best in the current market conditions. In bear markets, which are almost always volatile by nature, shorter term strategies and those that allow going short tend to work better than long only or intermediate/longer term systems.
Which of your trading systems fit this current market type? That question implies that you have multiple trading systems and that you know how they perform under various market conditions. If you haven't heard that concept before or the other ideas mentioned above, read Van’s book Super Trader, which covers these areas and more so you can make money in any kind of market conditions.
Crisis always implies opportunity. Those with good trading skills can make money in this market—a lot of money. There were lots of good opportunities in 2011. Did you make money? If not, then do you understand why not? The refinement of good trading skills doesn't just happen by opening an account and adding money. You probably spent years learning how to perform your current job at a high skill level. Do you expect to perform at the same high level in your trading without similar preparation? Financial market trading is an arena filled with world class competition. Additionally and most importantly, trading requires massive self-work to produce consistent, large profits under multiple market conditions. Prepare yourself to succeed with a deep desire, strong commitment, and the right training.
About the Author: RJ Hixson is a devoted husband and active father. At the Van Tharp Institute, he researches and develops new products and services that will help traders trade better. His purpose in life is to create freedom and joy, and brighten the lights around him. He can be contacted at “rj” at “vantharp.com”.
Trading Education
Plan Now for Profitable Trading in the New Year
Jan
19-21 |
$2,295
$2,995
|
Peak Performance 101
Presented by Van K. Tharp
Get in alignment with top trading traits!
Learn why so many past attendees say they wished they'd taken this workshop years ago.
Hint: It would have saved them hours of stress and a number of losses. |
Cary, NC |
| Jan 23-25 |
$3,295
$3,995
|
Peak Performance 203
"The Happiness Workshop"
Presented by Van K. Tharp
Happy traders are more profitable and well-adjusted! Join Dr. Tharp after Peak 101 for this advanced workshop. |
Cary, NC |
In February 2012, Dr. Tharp is bringing
two of his foundation workshops to Australia. |
Feb
24-26 |
$2,295
$2,995
|
Blueprint for Trading Success
Presented by Van K. Tharp and RJ Hixson
You'll leave this workshop with top trading skills to incorporate into your trading plan. What you learn will last you a lifetime. |
Sydney, AU |
Feb 28-
Mar 1 |
$2,295
$2,995
|
How to Develop a Winning Trading System that Fits You
Presented by Van K. Tharp and RJ Hixson
Van and RJ will share how to create a winning trading system that fits your individual trading style.
|
Sydney, AU |
Click here to see our full workshop schedule with details
Click here to see locations, logistics, etc.
Read a recent interview with Ken Long
Trading Tip
by RJ Hixson for Van Tharp
Van uses the System Quality Number® (SQN ®) score to measure the market performance of countries, currencies, commodities, and various equity sectors in this world model. Van based his model off of one that Ken Long developed some years back using several weighted factors and a shorter time frame. For each of the ETFs in his database, Van calculates the SQN 100 score using the daily percent change for a 100-day period. Typically, a SQN score over +1.45 is strongly bullish; a score below -0.7 is very weak. We use the following color codes to help communicate the strength or weakness of the ETFs:
- Green: ETFs with very strong SQN scores (0.75 to 1.5).
- Yellow: ETFs with slightly positive SQN scores, which are not as strong as the green ones (0 to 0.75).
- Brown: ETFs with slightly negative SQN scores (0 to -0.7).
- Red: Very weak ETFs that earn negative SQN scores (< -0.7).
The World Market Model spreadsheet below includes most currently available ETFs including inverse funds but excluding any leveraged funds. In short, it covers the geographic world, the major asset classes, the equity market segments, the industrial sectors, and the major currencies.
World Market Summary
October’s picture improved over September, but it hasn’t gotten rosy. There’s a lot of brown this month, which says the SQNs are negative for those items—places where you would have lost money for the last 100 days.
In September, red dominated the model at about 70%; however, in October, there were only a few red areas. The model now shows mostly brown and a number of yellow areas. There was but one green ETF on the world model. Can you guess what it might be? See the lower right hand corner to find VXX, the equity volatility ETF (actually an ETN)—not so surprising for a bear market.
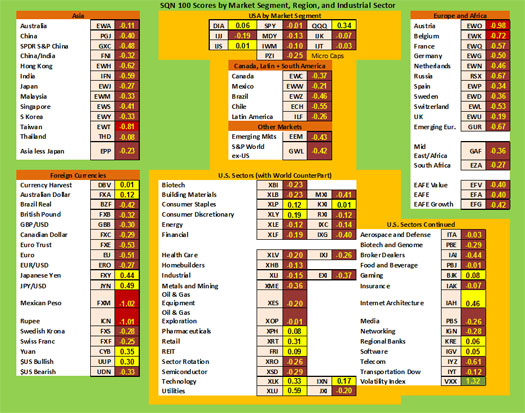
View Larger Chart
Not a single country ETF was yellow or green. In the US, the NASDAQ index represented by QQQ was the strongest (but still not very strong) market segment at an SQN score of only 0.34. Most of the other US market segments remain brown.
In currencies, the Japanese Yen was the relative strongest currency, but that may change shortly given the Bank of Japan’s willingness to intervene and weaken the Yen. China’s Yuan was the second strongest currency, and the US dollar was third. Though the Swiss Franc was the strongest currency for many months just two months back, the Swiss National Bank announced it would buy less valuable foreign currencies until the Swiss Franc weakened to an acceptable level. Mission accomplished: the Swiss Franc now sports the hue of brown like so many other currencies.
Broad weakness still abounds in the industrial sectors. Only utilities showed even moderate strength as investors view that as a “safer” sector over any others right now. Internet architecture, technology, and retail were the other yellow ETFs to note.
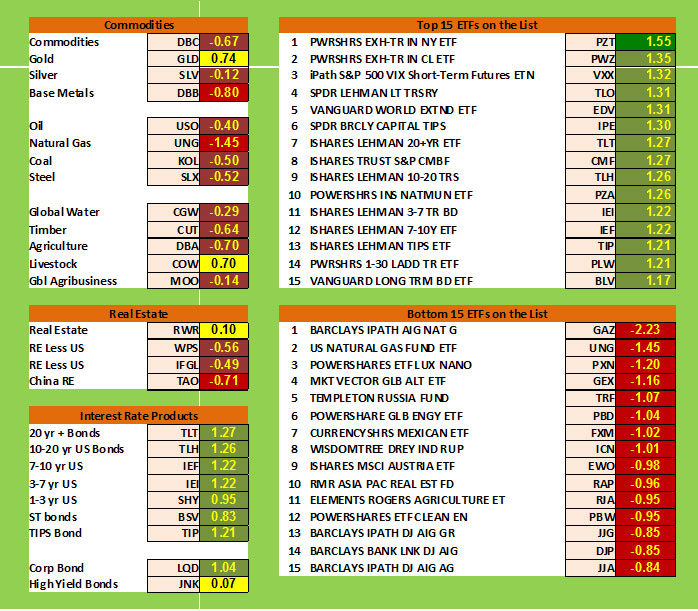
The next table shows the relative performance of commodities, real estate, and interest rates on the left hand side with the strongest and weakest areas of the all of the ETFs.
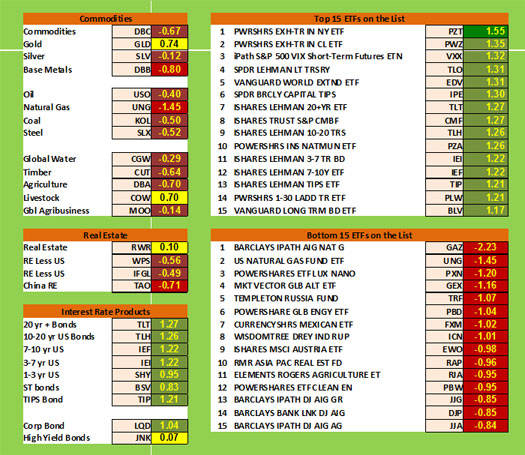
View Larger Chart
The strongest (relative) commodity is still gold with livestock a close second. Everything else is brown or red—negative SQN scores. Real estate is similarly weak. Debt is the only area of nearly all green with the only exception being junk. Money continues to support this supposedly safe asset class. It’s not an asset class without volatility though. Pull up a chart of TLT or LQD to see what bond traders have been living through.
Interestingly, there is only one ETF that is dark green (very strong) in the entire database and as like most on the top ETF list, it’s a debt-related issue. On the bottom ETF list, you can see some country funds, some currency funds, natural gas, and others—a list of sundries without an overriding message.
What's Going On?
October’s equity gains improved the appearance of the market picture somewhat, but it only went from an overall “bad” to a “not-so-bad” condition. Bonds were the best performing area over the last 100 days, and they remain the only strong area of all the asset classes and market segments. Everything else has been weak or negative.
To paraphrase Van last month, “Things remain serious.”
Crisis always offer opportunities, but to capture those opportunities you MUST know what you are doing. If you want to trade these markets, you need to approach them as a trader, not a long-term investor. We’d like to help you learn how to trade professionally. Trying to navigate these markets without such an education is hazardous to your wealth.
Van Tharp will return to write this column next month. Until then, take care and trade well.
About the Author: RJ Hixson is a devoted husband and active father. At the Van Tharp Institute, he researches and develops new products and services that will help traders trade better. His purpose in life is to create freedom and joy, and brighten the lights around him. He can be contacted at “rj” at “vantharp.com”.

Peak Performance Home Study Program for Traders and Investors
YOU are the most important factor in your trading success!
You create the results you want. Going through this home study course, you’ll gain a perspective on the "how" and "why" of your past trading results and learn techniques to increase profits and reduce stress.
Your success as a trader depends upon the amount of work you put into applying the principles of the course to your investing and trading. Get started now and take charge of your trading success!
Learn More
Buy Now
Mailbag
How Do High VIX Readings Signal Upward Moves?
Q: A question regarding D.R. Barton's most recent article.
At one point you say "a VIX over 30 is usually considered high... and an upward move in price is expected." However, two examples you cite are the market meltdown in 2008-2009, and the ongoing 2011 retracement, which approached 20% at its low. I have tended to associate high VIX values with bear markets, not upward moves.
Could you please explain further how high VIX readings may signal upward moves?
A: Traditionally, VIX has given a short-term view of the market (the activity of options writers). If you look at the charts, you'll see many instances of one day VIX spikes into higher levels. Under this scenario, VIX is a contrary sentiment indicator, hence the options trader saying "When VIX is high, it's time to buy..."—short term, oversold markets usually lead to price rebounds.
On the other hand, a persistently high VIX reading indicates persistently high volatility. Markets with that characteristic are almost always bear markets. Bull markets just don't seem to generate very high volatility
(variability). On the contrary, most prolonged bull market runs give very depressed VIX readings. I have written in the past that while high VIX spikes are good reversal signals, a low VIX reading is not a very good indication for a downward reversal.
—D.R. Barton, Jr.
Ask Van...
Everything that we do here at the Van Tharp Institute is focused around helping you improve as a trader and investor. Therefore, we love to get your feedback, both positive and negative!
Click here to take our quick, 6-question survey.
Also send comments or ask Van a question by using the form below.
Click Here for Feedback Form »
Back to Top
Fun
Click here to see fun photos from our Peak 202 workshop!

Contact Us
Email us [email protected]
The Van Tharp Institute does not support spamming in any way, shape or form. This is a subscription based newsletter.
To change your e-mail Address, click here
To stop your subscription look at the very bottom, left corner of this email and click on that link.
How are we doing? Give us your feedback! Click here to take our quick survey.
800-385-4486 * 919-466-0043 * Fax 919-466-0408
SQN® and the System Quality Number® are registered trademarks of the Van Tharp Institute
Back to Top |


