Tharp's Thoughts Weekly Newsletter (View On-Line)
-
Article Evidence of a Structural Change in the Markets by D.R. Barton, Jr.
-
-
Trading Tip Understanding Your Span of Control by Ken Long, D.M.
-
Mailbag How Do I Know If the Market Is Trending?
-
$700 Early Enrollment Discounts for November Workshops
Expire Next Week!
If you want to improve your money’s returns, but you don’t necessarily have a desire to become a day trader or swing trader, Dr. Ken Long’s newest workshop, Core Trading Systems: Market Outperformance and Absolute Returns, is just the workshop for you.
Then attend the How to Develop a Winning Trading System Workshop. Our job in this workshop is to teach you what you need to know to develop your own system. The material you will learn is not market or time-frame specific. So whether you trade stocks, futures, currencies or gold, etc., or whether you place 50 trades per day or 50 trades per year, you will learn all of the components that work in any system.
Learn more...

Evidence of a Structural Change in the Markets
by D.R. Barton, Jr.
“When VIX is high, it’s time to buy. When VIX is low, it’s time to go.”
—Adage among traders, unattributed
By the time I was 10, summer was for three things: mowing lawns for spending money, playing little league baseball because everyone else did, and shooting hoops because that’s what I loved.
Basketball games are played in the winter. Basketball players are made in the summer. Like all sports, improvement is made in the off-season—which I did summer after summer. By the time I got to high school, I was a good shooter. To this day, it’s safe to say that I’m a better free throw shooter than a majority of NBA players (who statistically make right around 75% of their free throws).
When I played high school ball, each basket was only worth two points. Without a 3-point shot, the big guys under the basket mattered most because they could rebound and score close to the basket.
By 1986, though, colleges and most high schools had adopted the 3-point rule, and that change made all the difference in the world for shooters like me. Shorter players who could shoot were suddenly as important as tall ones. After this structural change, the game of basketball changed, and for the better. The game became more balanced as teams had to spread out all over the court to create longer shots on offense and defend against them when the other team had the ball. Those who adapted to the change found the most success.
The same can be said for the financial markets. A structural change is occurring before our very eyes. Those who adapt will find success. Those who don’t will struggle.
When Markets Change
By and large, markets undergo structural changes because of outside influences. The general ebb and flow of financial markets has been similar since the beginning of organized trade because it is driven by the psychology of buyers and sellers. But modifications to that general ebb and flow are brought on by environmental changes.
Here are some examples:
- Regulatory Changes:
- January 1997—Order handling rules changed and opened up data access execution channels to retail traders and spurred the Day Trading revolution.
- 2001—Stock prices were stated in tens of cents rather than fractions of a dollar. The change was referred to as decimalization, and scalping of the bid/ask spreads ground to a halt for small volume traders.
- Monetary Policy Changes:
- 2002 – 2004—Greenspan expanded credit even with recovery underway, which then led to a real estate bubble and a four-year bull stock market without a single 10% correction.
- March 2009 – May 2011—The real estate bubble/debt crisis bailout fueled the rally.
- Technology Changes:
- 1920s—The telephone reduced trading cycle response time in Jessie Livermore’s era.
- 1995 – present—The Internet has reduced news cycles and, therefore, trading cycles.
These are just the first few environmental changes that came to mind. Clearly there are many other examples and probably even more significant ones out there!
What we are experiencing now in the markets is a combination of all of these outside influences: regulatory, monetary, and technology changes have combined to reduce cycle times and expand volatility. Today we’ll concentrate on the volatility issues and leave the cycle time reduction for future discussion.
The Volatility Explosion and a Tool to Measure It
There are many ways to measure volatility in the financial markets. My favorite day-to-day tool is Average True Range. But to understand the amount of “fear” that is priced into the market, many analysts look to the CBOE Volatility Index, popularly known as the VIX. I use the phrase “priced into the market” because VIX measures the relative dollar amount of premium that option writers are demanding in order to sell puts or calls.
Let’s take a moment to understand how VIX is calculated and then look at what it is telling us about the changing response of the market.
According to the CBOE, the stated goal of VIX is to represent expected volatility for the next 30 days, but it is then annualized. Trying to understand the exact number is a bit tedious, so let’s jump to the numbers that analysts have traditionally used: a VIX over 30 is usually considered high, meaning that fear is running high in the market and an upward move in price is expected.
We saw high volatility in the markets in the during the 2008 – 2009 real estate bubble melt down and again from August 2011 to now with the European debt crisis and US rating downgrade. Has this been normal, according to market history, or not?
Looking at VIX readings dating back to 1990, we can see that this is not normal at all! Let’s put together some numbers for some meaningful periods dating back to the beginning of the reported VIX. Here is a list of the number of weeks where the majority of the range of the VIX for the week was above 30:
- 1990 – 1999 (10 Years): 21
- 2000 – 2003 (4 Years): 36
- 2004 – 2007 (4 Years): 0!
- 2008 – 2011 (~4Years): 60
So we can get a feel for this, here’s a “mashed-up chart” that shows this whole period.
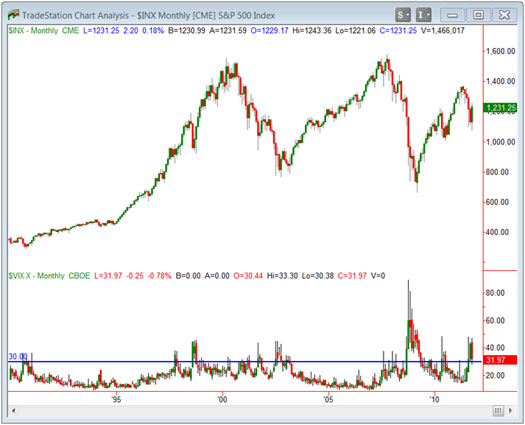
To see how well the VIX describes market history, look at the chart from last week’s article.
We’re seeing more periods of high volatility, and they are lasting longer. The exception was the monetary easing bull run from 2003 – 2007 when the market never even had a 10% pullback. The VIX reflects the comfort and complacency that existed during that run. Since the real estate/credit crisis, however, massive global cash infusions have scared market participants on both ends of the spectrum. They’re scared to miss out on the next big move up, so they jump in boldly when prices start moving up. But they’re also scared that the market could plunge, so money is extracted quickly at the first signs of downward price pressure. This leads to the rapid up and down movements that have characterized the markets over the past four years leading to twice as many high volatility weeks than we’ve seen for similar periods over the past 30+ years.
All the extra cash that has been injected into the system has combined with the contracting news cycle times to give us a market that is likely to retain its higher levels of volatility into the future.
Just as the basketball world adjusted to the 3-point shot, traders and investors have to adjust to a world of faster news cycles and considerably more money chasing the same number of assets.
I’d love to hear your thoughts and feedback—just send an email to drbarton “at” vantharp.com. Until next week…
Great Trading,
D. R.
About the Author: A passion for the systematic approach to the markets and lifelong love of teaching and learning have propelled D.R. Barton, Jr. to the top of the investment and trading arena. He is a regularly featured guest on both Report on Business TV, and WTOP News Radio in Washington, D.C., and has been a guest on Bloomberg Radio. His articles have appeared on SmartMoney.com and Financial Advisor magazine. You may contact D.R. at "drbarton" at "vantharp.com".
Trading Education
Do you want a thorough understanding of how systems work so you can trade with confidence and avoid costly mistakes?
Attend our Core Trading System Workshop and receive a comprehensive breakdown of Ken Long's longer term systems. Then attend the How to Develop a Winning Trading System Workshop, where you'll learn the parts every trading system needs to be profitable and how to implement those parts correctly.
| Nov 12-13 |
$2,295
$2,995
|
Core Trading Systems: Market Outperformance and Absolute Returns
Learn longer term systems that only require a short amount time each week to trade.
Presented by Ken Long |
Cary, NC |
| Nov 14-16 |
$2,295
$2,995
|
How to Develop a Winning Trading System That Fits You
Learn the key elements to outstanding trading systems so you can build your own systems or properly adapt other systems to fit you.
Presented by RJ Hixson and Ken Long |
Cary, NC |
$700 Discounts on both workshops expire next week.
Click here to see our full workshop schedule with details
Click here to see locations, logistics, etc.
Read a recent interview with Ken Long

Trading Tip
Understanding Your Span of Control
by Ken Long, D.M.
The military uses the term “command and control” to describe the management of current operations. One of the most important concepts in command and control is the idea of span of control.
Span of control describes how many simultaneous, subordinate operations you can successfully manage at the appropriate level of detail given the current situation of uncertainty, stress and pressure.
When you are inside your effective span of control, it is easy for you to be aware of all the important events occurring in your environment and for you to make decisions in time to positively affect the outcome.
When you are at the limit of your span of control, there is a very real sense that you are fully engaged in the current operation. You can sense the boundary condition and may even feel a sense of being about to lose control.
Too Many Balls in the Air
Think of a juggler who can successfully juggle five balls at once. Managing between one and four balls represents little to no challenge beyond the normal attention to detail required for any juggling. At five, the juggler feels a sense of total immersion and full engagement. The juggler may have difficulty looking at events or objects outside of the current field of vision. The juggler must maintain total commitment and concentration in the moment.
To add one more object into the mix would be a violation of the juggler’s span of control. While he may be able to maintain the flow for a few moments, the very real sense of being overwhelmed and slowly drifting out of control happens until the six balls overcome his skill and they all crash to the ground.
Span of Control for a Trader
Span of control for a trader relates to how many open positions he or she can effectively manage at the peak of uncertainty and still maintain effective decision-making. When we exceed our span of control, we are no longer capable of identifying required information, processing it, and acting upon it in a timely manner for best effect. It becomes very important for a trader to understand and appreciate the effect of their span of control on trading performance.
In certain situations, simply managing some number of open positions limits a trader’s span of control. In other cases, trading capital may be the limiting factor. Sometimes your maximum allowable portfolio heat limits your span of control. (As a rule of thumb, a trader should have less than 20% portfolio heat at any given time.)
A trader may have no problem following their trading system’s rule set when considering any single trade independently. When you start adding multiple trades into the mix, however, a trader may experience a performance breakdown and attribute the breakdown mistakenly to a psychological problem. Rather, it could be simply a cognitive load issue associated with span of control. It’s not that your discipline is breaking down; it’s that you’re trying to do too much.
Focus on your known capabilities under realistic constraints and behave accordingly.
10 Ways to Improve Your Span of Control
You have to know where you are before you can consider how to improve with your active trade management processes.
Here are some things you can do to improve your span of control:
- Simplify your rule sets.
- Rehearse contingency situations.
- Use automatic trailing stops to manage open positions.
- Trade symbols you are familiar with.
- Identify the main themes of the day, week or month and stay with them.
- Improve speed of execution.
- Automate information gathering.
- Increase the speed of your decision-making.
- Reduce the amount of information required to act.
- Stop believing that you are right and truly look at what’s happening now.
Improving your span of control can afford you more open positions with smaller relative risk per position. If you stay within your maximum portfolio heat, you will reduce the probability of ever experiencing maximum single moment drawdown.
About the Author: Ken Long is a retired Lieutenant Colonel in the U.S. Army with a D.M. in Organizational Behavior. He is a proud father of 3, a husband, teacher, student, martial artist, and an active trader. Ken is also a dynamic workshop instructor for the Van Tharp Institute. The above article was reprinted from Ken's blog. Read more of Ken's essays at http://kansasreflections.wordpress.com.
Disclaimer »

Peak Performance Home Study Program for Traders and Investors
YOU are the most important factor in your trading success!
You create the results you want. Going through this home study course, you’ll gain a perspective on the "how" and "why" of your past trading results and learn techniques to increase profits and reduce stress.
Your success as a trader depends upon the amount of work you put into applying the principles of the course to your investing and trading. Get started now and take charge of your trading success!
Learn More
Buy Now
Mailbag
How Do I Know If the Market Is Trending?
Q: I understand that any trading system will only work well in certain markets. What I don’t understand is how to go about defining those markets. How, for instance, do I know if a market is trending?
A: Here are a few ways to determine whether we are in a trending market:
- Van uses a 100-day market index based version of his SQN® score.
- Use three moving averages of different time spans and look for all three to be lined up “correctly” for a trend.
- Look at the ADX indicator for some market index and watch for a value greater than 20, 25, or your preferred figure.
- Ken Long defines a bull market as when the S&P 500 is more than 2% above the 200-day MA, bear as more than 2% below the 200-day MA, and sideways as the index being within 2% of the 200-day MA.
- You could define some point or percentage gain or loss within a specified amount of time as a trend.
- You could use point and figure chart patterns for a broad market index to find trends.
- Put Bollinger Bands on longer term bars for some index and define trend as x number of bars above or below the center line and moving in the direction of or pushing out the near side band.
Ask Van...
Everything that we do here at the Van Tharp Institute is focused around helping you improve as a trader and investor. Therefore, we love to get your feedback, both positive and negative!
Click here to take our quick, 6-question survey.
Also send comments or ask Van a question by using the form below.
Click Here for Feedback Form »
Back to Top
Fun
Click here to see fun photos from last month's client dinner!

Contact Us
Email us [email protected]
The Van Tharp Institute does not support spamming in any way, shape or form. This is a subscription based newsletter.
To change your e-mail Address, click here
To stop your subscription look at the very bottom, left corner of this email and click on that link.
How are we doing? Give us your feedback! Click here to take our quick survey.
800-385-4486 * 919-466-0043 * Fax 919-466-0408
SQN® and the System Quality Number® are registered trademarks of the Van Tharp Institute
Back to Top |


