|
More opportunities to achieve Peak Performance this January.
|
|
|
|
|
|
Tharp's Thoughts
Inbox Mentoring
|
|
|
|
|
|
|
|
-
Feature: September 2018 Market Update:
Strong Bull Quiet Market Type,
by Van K. Tharp, PhD
-
-
Tips: September 2018 System Quality Number ® Report,
by Van K. Tharp, Ph.D.
-
-
GDPR: Read Our GDPR Statement
|
|
THERE'S STILL TIME TO SAVE WITH OUR LONDON COMBO DEALS!
Not only are we offering 5 of our most popular workshops in London, we are also offering numerous ways for you to save money when you attend more than one workshop.
Peak Performance 101 starts October 12th. You still have time to both get your plans made and snag a seat at the $700 discount. (We have another Peak Performance 101 scheduled in the US, January 18-20, 2019)
No matter what combination of workshops you choose, there are hundreds of dollars in savings! This is in addition to the already lower price you get ($700 off) if you register early.
There is no guarantee we will be back in London in 2019, so if this location is a good fit for you, we urge you to participate in October!
|
|
|
|
September 2018 Market Update:
Strong Bull Quiet Market Type
by Van K. Tharp, PhD
|
|
|
|
|
I always say that people do not trade the markets; they trade their beliefs about the markets. In that same way, I'd like to point out that these updates reflect my beliefs. I find the market update information useful for my trading, so I do the work each month and am happy to share that information with my readers. If your beliefs are not similar to mine, however, then this information may not be useful to you. Thus, if you are inclined to go through some sort of intellectual exercise to prove one of my beliefs wrong, simply remember that everyone can usually find lots of evidence to support their beliefs and refute others. Simply know that I admit that these are my beliefs and that
your beliefs might be different.
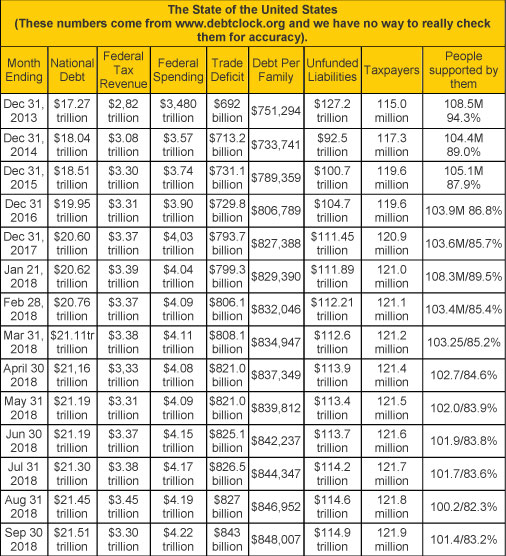
These monthly updates are in the first issue of Tharp's Thoughts each month which allows us to get the closing data from the previous month. These updates cover 1) the market type (first mentioned in the April 30, 2008 edition of Tharp's Thoughts), 2) the debt statistics for the US, 3) the five-week status on each of the major US stock market indices, 4) our four-star inflation-deflation model, and 5) tracking the US dollar. I also write a report on the strongest and weakest areas of the overall market as a separate SQN™ Report. Significant market changes may mean the SQN Report comes out more than once a month.
Part I: The Big Picture
The market remains in Strong Bull mode with very low volatility. This kind of market type makes even the average buy and hold investor look like a genius.
|
|
|
For the past three months the us debt clock website has listed US Assets. US assets include small business assets, corporate assets, and household assets which total $148.0 trillion. When you consider that our unfunded liabilities are $114.9 trillion, the total liability per taxpayer is $942,748 and the total assets per citizen is $452,421. The trend towards more and more debt has been going on for years and thus is likely to continue. But one day it will all collapse.
The people supported by the taxpayers include retirees (52.4M), disabled people (10.2 M), those getting food stamps (38.8M) or 101.4 million people who are supported by 121.9 million taxpayers. This is one trend that has been going down during the Trump years. In January 2018 it was 89.5%
Part II: The Current Stock Market Type Is Strong Bull Quiet
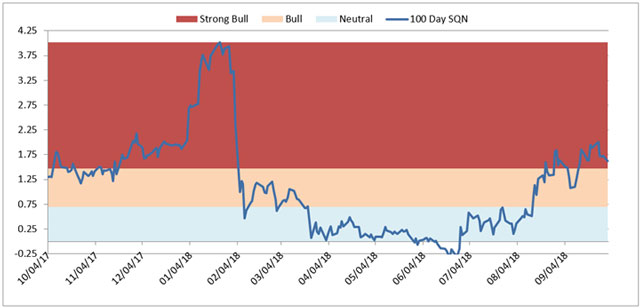
The directional component of our market type started the month in Strong Bull territory, dipped into Bull for a short period but finished the month in Strong Bull again.
|
|
|
It has been a steady month for the directional component. We monitor the Market SQN scores for the various periods which look like this —
- 200 days — Bull (last month), Bull now
- 100 days — Strong Bull (last month), Strong Bull now
- 50 days — Bull (last month), Bull now
- 25 days — Bull (last month), Bull now
All of the Market SQN scores for the last two months have been Bull or Strong Bull. This is a very strong market.
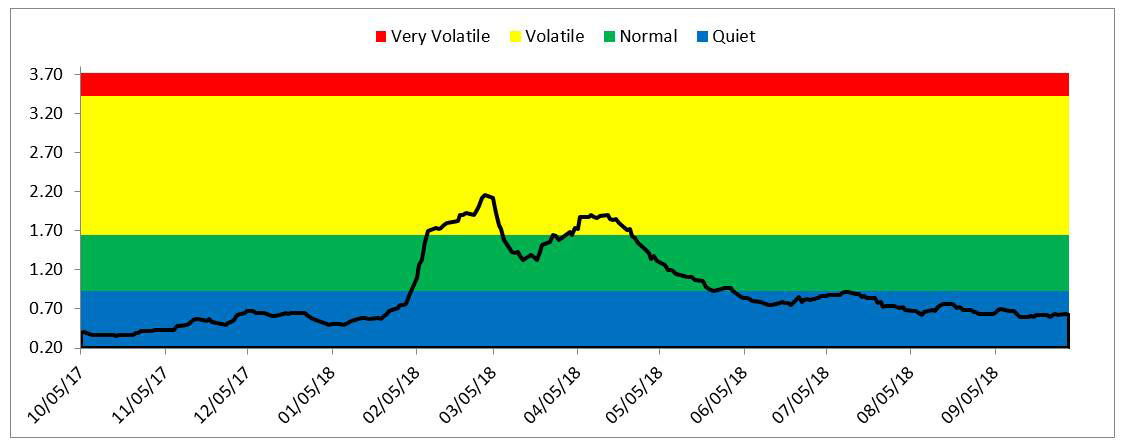
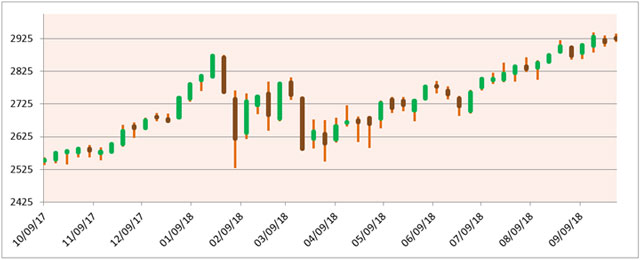
You can see from the S&P bar chart below that at the beginning of this year, we had a strong upward trend followed by a slight but volatile correction. Since April, we’ve had a strong upward trend. We began making new highs recently as well. The S&P 500 has had 15 new all-time highs in the last 58 days.
|
|
|
We are now in the longest bull market in history (if you consider that a bull ends with a correction of more than 20%). The Fed is raising short term rates and with the last rate hike, we are near (or at) a rate inversion (a sign of a recession within a year). The Fed has promised five more rate hikes which are likely to happen in December 2018, three in 2019, and then one in 2020. It takes a year from the rate inversion signal, however, for a recession to hit and right now we are strongly into the result of the Trump tax cut for corporations which will result in immense profits. So keep watching what the markets are doing not what you think might
happen.
Meanwhile, volatility remains low in the Quiet range — and this is a good sign that the bull market will probably continue.
|
|
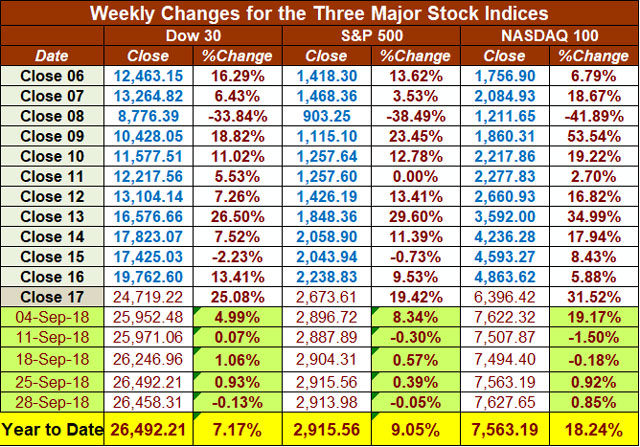
Here are the weekly changes in the three major stock indices over the last month.
|
|
The NASDAQ continues to lead the indices with the largest gain near 20% on the year but the other two indices are up nicely. Look at stocks like Apple, Alphabet, and Amazon and you will see why the NASDAQ leads.
Part III: Our Four-Star Inflation-Deflation Model
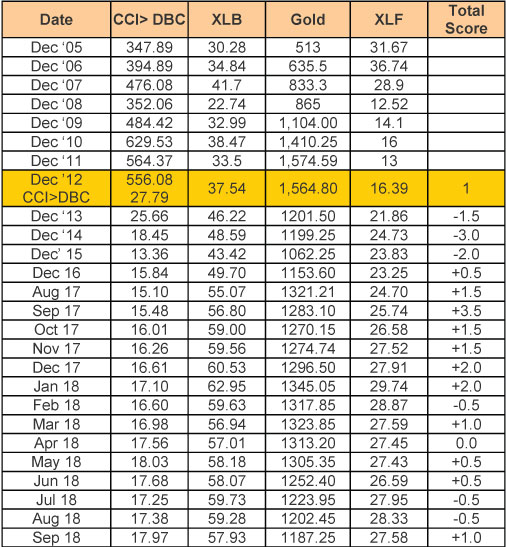
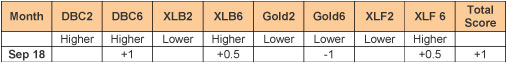
The components in our inflation/deflation model are all relatively steady which explains the neutral scores recently.
|
|
The Fed is raising interest rates because it sees inflation approaching. But our model’s results have been pretty neutral since January. In contrast, shadowstats.com measures inflation the way the government used to measure it in 1980 and still shows inflation at about 10%. On that basis, we have been in a recession since 2000 except for one quarter in 2003.
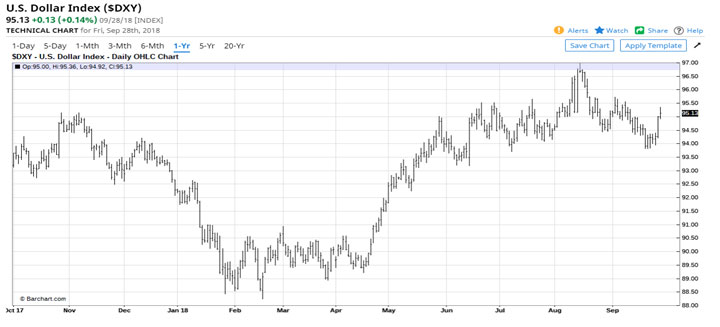
Part IV: Tracking the Dollar
The US has shifting tariff rates and rising interest rates. Both of those factors seem to support a strong dollar and the dollar is quite strong. It dropped a little in September but then rose again with the recent rate hike.
|
|
|
Conclusion
- Have you been making good money in this market?
- Were you up 20% or more last year?
- Are you up at least 10% this year?
If not, then you have not been even matching the three major market indices. Why not? Chance are you need to add a little Tharp Think into your trading.
Using a market type approach to trading, you don’t have to speculate about how high the market is going or worry if it’s about to head in a different direction. Instead, you simply 1) need to pay attention to the market right now and 2) consider alternative market types for the upcoming period.
What is the market doing now? It’s in a strong bull quiet market type. What market type will come next? We don’t know but it’s likely we are going to see more volatility or a sideways direction or possibly both.
For now, trade your systems that work well in bull quiet markets. If you don’t have anything more effective for a bull market, you could be long and just use a trailing stop. Be careful, however, about thinking you are a trading genius because once you do, then the markets are probably ready to turn.
Until next month’s Update, this is Van Tharp.
|
|
|
|
|
|
About the Author: Trading coach, and author, Dr. Van K. Tharp is widely recognized for his best-selling books and his outstanding Peak Performance Home Study program - a highly regarded classic that is suitable for all levels of traders and investors. You can learn more about Van Tharp www.vantharp.com.
|
|
|
|
|
|
|
|
|
September 2018 System Quality Number® Report
The SQN® Report
by Van K. Tharp, Ph.D.
|
|
|
|
|
There are numerous ETFs that track everything from countries, commodities, currencies and stock market indices to individual market sectors. ETFs provide a wonderfully easy way to discover what’s happening in the world markets. I apply a version of my System Quality Number® (SQN®) score to measure the relative performance of numerous markets in a world model.
The Market SQN score uses the daily percent change for input over a 100-day period. Typically, a Market SQN score over 1.47 is strongly bullish and a score below -0.7 is very weak. The following color codes help communicate the strengths and weaknesses of the ETFs in this report:
- Dark Green: ETFs with very strong Market SQN scores > 1.47
- Light Green: ETFs with strong Market SQN scores (0.70 to 1.47).
- Yellow: ETFs with slightly positive Market SQN scores (0 to 0.70). These are Neutral/Sideways
- Brown: ETFs with slightly negative Market SQN scores (0 to -0.7).
- Red: Very weak ETFs that earn negative Market SQN scores (< -0.7).
This is basically the same rating scale that we use for the Market SQN Score in the Market Update. The world market model spreadsheet report below contains a cross section of currently available ETFs; excluding inverse funds and leveraged funds. In short, it covers equity markets around the globe, major asset classes, equity market segments, industrial sectors, and major currencies.
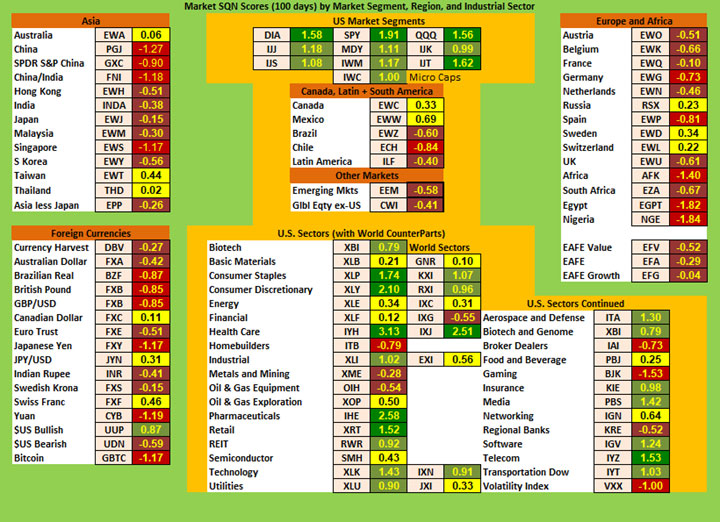
World Market Summary — Equities & Currencies
Each month we look at the equities markets across the globe by segment, region, and sector.
The US Dollar continued its strength in September and is the only green currency, although it’s now light green. Since everything in the database is priced in the US dollar, foreign assets seem weaker — and that’s the way the entire chart looks. The US is all green (segments) but Asia, Europe, and the rest of the Americas look pretty weak.
Two months ago, the US had only two green market segments. Last month everything was dark green with only two light green sectors. This month we have four dark green areas and five light green areas. This is one of those markets were people who are fully invested look like market geniuses. But it only works during a nice bull quiet (or perhaps bull volatile) market type.
Elsewhere in the Americas, it is not so good. Canada and Mexico are yellow. Brazil and Latin America are brown while Chile is red.
Asia has three yellow (slightly positive) sectors — Australia, Thailand, and Taiwan. China and Singapore are red. Everything else is brown.
Europe also has three yellow sectors — Sweden, and Switzerland and Russia. Germany and Spain are red while everything else is brown. The African sectors are all red with only South Africa being brown. Again, this is probably due to the strong US Dollar and everything being Dollar denominated in the chart.
|
|
|
In currencies, the ETF for the USD (UUP) is the only green symbol with most of the other currency symbols in the red. This is similar to the last two months. This month we have three yellows — the Canadian Dollar, the Swiss Franc and the Yen/Dollar pair. The Bitcoin trust symbol is red.
Two US Market Sectors are red — Homebuilders and Broker Dealers. We have several browns — Metals and Mining, Oil and Gas Exploration, and Regional Banks. On the positive side, Consumer Staples, Consumer Discretionary, Health Care, Pharmaceuticals, Retail, and Telecom are all very strong and dark green. Biotech, Industrials, REITs, Technology, Utilities, Aerospace, Biotech and Genome, Insurance, Media, Software, and Transportations are all light green
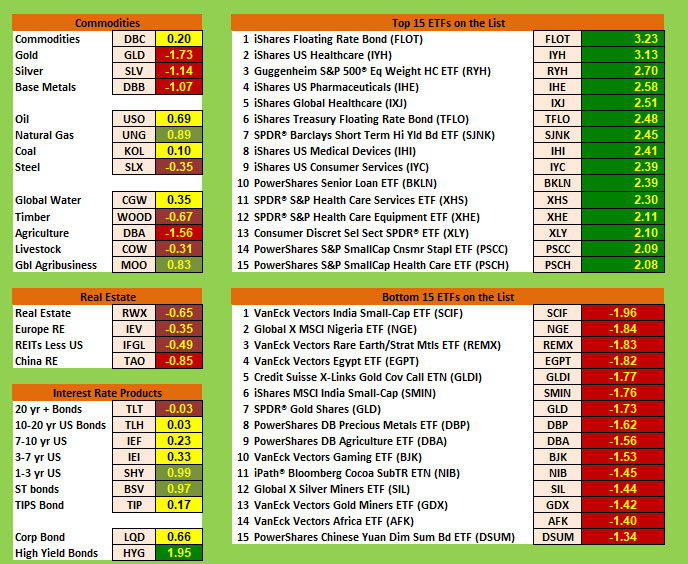
Commodities, Real Estate, Debt, and the Top and Bottom Lists
September commodities are weak with only natural gas being green. Blended commodities, oil, coal, and global agribusiness are all yellow. Steel, timber, and livestock are all brown while gold, silver, base metals, and agriculture are all red.
Real estate looks very weak (red and brown) — due to interest rates. Once again, like last month, interest rate sectors don’t look so bad with short term bonds being light green and junk bonds being dark green. Only the long term (20 year) bonds are negative.
|
|
|
On the top list for the month, two ETFs score above 3.0. One is the floating rate bond, continuing to be #1 from last month. The other is US Healthcare. Everything in the top 15 is above 2.0. Health care seems to predominate the list along with consumer sectors.
The weakest ETF list is all red again this month and while seven of them where below minus 2.0 last month, none are that low this month. In the bottom we have India, Nigeria, Egypt, Africa, gaming, and a lot of the commodity sectors.
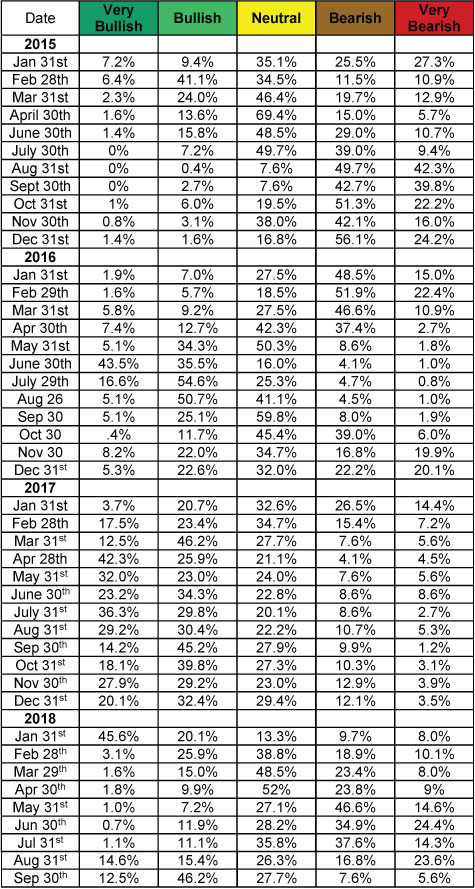
Summary
Let’s look at the summary table which measures the percentage of ETFs in each of the strength categories. You can see the distribution of the database by Market SQN score in bullish, neutral and bearish categories below —
|
|
|
The market has become much stronger in September with 59% bullish symbols vs 30% last month. Last month 30% were bearish and this month only 13% are bearish.
Be careful to base your actions upon what IS happening, not what you think might happen. The markets always offer opportunities, but to capture those opportunities, you MUST know what you are doing. If you want to trade these markets, you need to approach them as a trader, not a long-term investor. We’d like to help you learn how to trade professionally because trying to navigate the markets without an education is hazardous to your wealth. All the beliefs given in this update are my own. Though I find them useful, you may not. You can only trade your own beliefs about the markets.
Until next month this is Van Tharp.
|
|
|
|
October 2018 - LONDON, ENGLAND
$700 Early Enrollment Discount Ends Today!
|
|
|
|
Presented by Van Tharp,
with RJ Hixson
|
|
|
|
October 12-14
Friday-Sunday
|
|
|
|
|
|
|
|
Do any of the following sound like you?
- Are you always looking for a new trading system? Or, are you always trying to improve the one you have?
- Do you find your trade setups never quite fit all of your criteria so you have trouble entering trades?
- Do you get anxious about the market or get anxious about risking your money so that you have trouble pulling the trigger?
- Do you get excited and ignore your rules or do you get distracted and fail to follow your system's rules?
- Does a losing trade take your energy away from the next trade or conversely, does a winning trade make you confident about the next trade?
- Is your trading (or your life?) ruled by fear, anger, greed, or shame?
- Are you constantly losing money?
- Do you lack a strong plan to guide your trading or do you fail to follow the plan you created?
- Do you have a performance ceiling where you fall apart or stop doing well consistently? Does your account reach a certain size and then it plateaus or you start losing money at that point?
If you answered yes to any of these questions, then you are experiencing some form of self-sabotage. But don’t worry, these are some very common patterns for traders and you can overcome them in order to reach your potential. This workshop will help you identify and resolve the underlying conflicts causing these patterns — as well as leave you with the tools to address conflicts that come up in the future for you.
It's been Van Tharp's cornerstone workshop for over three decades. Read more to learn the benefits you will walk away with.
Peak 101 will also be taught in Cary, NC this January. See details under January's workshop schedule.
Peak Performance is also a very important workshop to put on your calendar if you want to qualify for and apply to the Super Trader Program.
|
|
$700 Early Enrollment Discount Ends Next Week!
|
|
|
|
October 16-18
Tuesday-Thursday
|
|
|
|
|
|
|
The How to Develop Winning Systems Workshop teaches you what you need to know to develop your own system. The material you will learn is not market or time-frame specific. So whether you trade stocks, futures, currencies, gold, etc., or
whether you place 50 trades per day or 50 trades per year, you will learn all of the components that work in any system. With this knowledge you can both modify existing systems to fit you or the market type better, or master your own system development.
|
|
$700 Early Enrollment Discount Ends Next Week!
|
|
Presented by Gabriel Grammatidis
|
|
|
|
October 20-22
Saturday-Monday
|
|
|
|
|
|
|
|
Presented by Gabriel Grammatidis
|
|
|
|
October 23-24
Tuesday-Wednesday
|
|
|
|
|
|
|
|
The Theory: All You Need to Know About Forex
Gabriel will spend most of the workshop teaching his trend-following systems. The first half day is spent to go over the specifics of trading the Forex market and cover such topics as:
- Why trade Forex?
- What are the advantages and drawbacks of trading Forex versus other instruments?
- What are the main market characteristics, and who are the Forex market participants?
- What methods work best in the Forex market?
- All you need to know about Forex trading sessions and the currency pairs.
- How are Forex chart characteristics different than stocks or futures?
- What do you look for in a Forex broker? What do you avoid?
- Why Forex may actually be the best market for new traders to learn trading.
- What are the trading edges that work in Forex?
- The Method
Gabriel teaches three specific trading systems. All three are trend-based; you can see the price action patterns in the price charts. His systems can be traded in various timeframes and can be traded across a wide range of currency pairs. Attendees of Gabriel’s workshops enjoy swing trading the systems using primarily 5-min ,15-min, 60-min and daily candle charts. The trades tend to evolve over a timeframe of anywhere from several hours to a couple of days (or even weeks, in the case of strong trends).
Two additional days of live forex trading side-by-side with Gabriel is available as well for hands on trading experience.
|
|
$700 Early Enrollment Discount Ends Next Week!
|
|
|
|
October 26-28
Friday-Sunday
|
|
|
|
|
|
|
|
In this workshop, you begin to build your plan that includes specific, actionable steps you can begin as soon as you get back home. Here are some of the benefits of attending the workshop:
- Assess your beliefs about trading and about yourself so you can leverage your useful beliefs and eliminate the ones that are holding you back.
- Learn how to steer your entire system development process through your objectives.
- Find the key ingredient that most traders and investors are missing in their objectives that will make you thrive financially.
- Create a business plan with 3 trading strategies compatible with the big picture so your trading results are consistently profitable.
- Learn the 8 critical areas of contingency planning that most traders find out about the hard way (i.e., the expensive way). Developing plans for contingencies minimizes the risks to your trading business that could otherwise wipe you out.
- Discover how to leverage the strengths of your personality type and minimize your personal challenges to improve your trading.
- Learn how to cultivate the most important attitude required for successful trading.
|
|
|
|
Presented by Ken Long
Monday includes instruction plus live trades
|
|
|
|
November 10-11-12
Saturday-Monday
Note schedule change.
|
|
|
|
|
|
|
|
|
|
Day Trading Case-Study Package Added to our November 2018 class
We have added a special bonus for the November Day Trading System Course which we have not offered before and will not offer again (for no charge).
Ken Long has developed a hefty package of 60 day trading case studies which Ken recorded in video. These 60 case studies demonstrate the direct application of all the learning materials from the 3 day workshop. Collectively, these help you practice: scanning the market and individual sectors to find low risk ideas, trade framing, estimating price targets, contingency planning for routine decisions, managing trades that are working, taking profits, and applying standard concepts like the frog box and 1R for making routine decisions.
Perhaps even more valuable than the technical concepts in action are demonstrations of managing your mental and emotional state during the trading day, so that you are making decisions from a position of professional competence and not impulsively reacting to the next price event.
Tortoise Capital (Ken’s company) normally sells this case study package for $1,500, but for only this November workshop, you will receive that package at no extra charge.
We ordinarily pair a live trading session of several days with the day trading instruction, but due to a scheduling conflict, we couldn't do that this year. Instead, we are providing these recently recorded trading videos, 60+ lessons in all, at the November 2018 class.
|
|
Exciting New Work from Van Tharp
|
|
|
|
November
15-17
Thursday-Saturday
|
|
|
|
|
|
|
|
What is Systems Thinking?
Systems thinking should not be considered one simple idea, but rather a combination of numerous subjects. For example, systems thinking is considered:
- An integrated body of knowledge or discipline—think the Scientific method and Sir Isaac Newton. Here, the focus is on the objective, or that which can be observed.
- An idea involving your mindset, or way of looking beyond the basic trading aspects of tactics. Here, we are starting to look at beliefs.
- A recurring and iterative process, requiring various inputs. These might include changes in oneself, the markets, your results in comparison to your objectives, and more. The outputs include informed decision making about what systems to use, what position sizing strategies to employ, if and when discretion is utilized, and more.
Advanced systems thinking also involves mental maps, and how they are useful to guide you while in the trading process. Here, the subjective becomes as important as the objective.
However, even this has limits, as most standard systems thinking is mostly linear thinking,
I believe I have found a new, more robust way of thinking about systems…
And it’s here where we can begin to reach new levels of awareness and increase the chances of achieving success through trading.
|
|
|
|
SAVE THE DATE!
NOVEMBER 18-19 NEW WORKSHOP
|
|
MACRO TRADING
A new 2-day workshop will teach a consistently profitable and longer term trading strategy known as the REEDS Trading Methodology and developed by Mark Boucher (author of The Hedge Fund Edge).
This workshop was originally scheduled for Chicago but the presenters would like to move the location to North Carolina. This is not a Van Tharp Institute workshop but you can still register through our site and the workshop will be held at our training facility in Cary, NC.
There are a few details to finalize before this is open for registration so save the date in case you are interested in learning more about Mark Boucher’s REEDS system.
Also, one of the details to work out is the possibility of live streaming for this event. Stay tuned!
|
|
|
|
Super Trader Summit
For Super Traders Only
|
|
|
|
|
|
|
|
|
|
|
Presented by Van Tharp,
with RJ Hixson
|
|
|
|
January 18-20
Friday-Sunday
|
|
|
|
|
|
|
|
Presented by Libby Adams
and RJ Hixson
|
|
|
|
January 22-25
Tuesday-Friday
|
|
|
|
VTI Facility, Cary, NC
Sold Out
|
|
|
|
|
|
|
Presented by Van Tharp
and RJ Hixson
|
|
|
|
January 27-29
Sunday-Tuesday
|
|
|
|
|
|
|
|
|
|
FREE Book!
We pay for the book, you just pay for shipping.
When you add the free book to an item already being shipped there is generally no extra shipping charge (of course, depending on your location).
Read Van’s Latest Book —
TRADING BEYOND THE MATRIX
The Red Pill for Traders and Investors
Eleven traders tell their stories about transforming
their trading results and lives, in this 400 plus page book.
Below is a brief video on how powerful this book is to traders.
|
|
|
|
GDPR COMPLIANCE:
The European Union General Data Protection Regulation (GDPR) went into effect on May 25, 2018 and is designed to allow individuals to more effectively control their personal data. At The Van Tharp Institute (IITM, INC) , client information is private and confidential; we do not share, trade, or sell to anyone. We never have. You may ask us at any time to unsubscribe. We keep your information safe. If you’d like access to your information just ask. You receive this information from us because you opted into the Van Tharp newsletter either through direct registration or registration through our Tharp Trader Test.
102A Commonwealth Court | Cary | NC | 27511
Cary, NC Workshop Information
For a list of nearby hotels for our Cary, North Carolina locations,
click here.
Book your flight arriving to the Raleigh-Durham International Airport (RDU).
When traveling to a three-day course, it's best to arrive the evening before.
To help determine your arrival and departure times, see:
Questions? Click Here to Ask Van...
CONTACT US
This is a supplement to our subscription based newsletter, Tharp's Thoughts.
800-385-4486 * 919-466-0043 * Fax 919-466-0408
|
|
|
|
|