|
How many shares or contracts should you take per trade?
|
|
|
|
|
|
Tharp's Thoughts
Inbox Mentoring
|
|
|
|
|
|
|
|
-
Feature: Is More Than Big Tech Keeping the Market Afloat?,
by D.R. Barton, Jr.
-
-
Tips: Why Size Really Does Matter!
by Van K. Tharp, Ph.D.
-
-
GDPR: Read Our GDPR Statement
|
|
Discounts Abound On 5 Of Our
Most Powerful Workshops In The UK This October!
|
|
SAVE WITH OUR COMBO DEALS!
Not only are we offering 5 of our most popular workshops in London, we are also offering numerous ways for you to save money when you attend more than one workshop. No matter what combination of workshops you choose, there are hundreds of dollars in savings! This is in addition to the already low price you get ($700 off) if you register early. Find your savings by clicking here. Find out more about each of these workshops below.
|
|
|
|
Is More Than Big Tech Keeping the Market Afloat?
by D.R. Barton, Jr.
|
|
|
|
|
I’ve just returned from an amazing trip to Scotland where I was accompanied by my lovely and talented wife and two great friends.
While we were there, we were fortunate to stay in a lovely little town that held the regional Highland Games. These games, which date back over 1,000 years, include bagpipe and drum corps competitions (majestic) and multiple dancing events (graceful). And yes, there are footraces and long jumps where men and woman run and jump to the screaming encouragement of the local spectators.
The greatest allure of the games, however, lies in the strength events where huge men in kilts throw heavy stones, hammers, and even massive logs. The Aberlour Strathspey Highland Games had a “ringer” this year — a man from outside the region who easily won the shot put, hammer throw and heavy weight throw for both distance and height. This mammoth man was at least 75 pounds heavier than any of the other competitors and he was twice as thick.
Because of this, we easily and logically assumed that he would also win the most famous of Highland Game events — the caber toss. The caber is a 19 foot, 6 inch tall log that weighs 175 pounds. Contestants start by balancing the caber vertically in their clasped hands with the narrower end down and then they start running. They finish by tossing the log end over end hoping to get the smaller end to flip over the thicker end and land in a 12 o’clock position in front of them.
This he-man of a human being was first up. He easily balanced the caber but as he started running, he lumbered and laboriously made his toss. While he easily “turned the caber” (getting the smaller end to rotate over the top of the larger end in the air), his log landed at about a 10 o’clock position which cost him points.
The next contestant was younger and leaner. He had more trouble holding the monstrous log but as he started his run, you could see he was so much lighter on his feet — almost elegant — and had more control over his caber. He made his toss and landed a nearly perfect 12 o’clock position.
The logical choice, the one who looked best “on paper,” didn’t end up being the one that performed best in reality. So it is sometimes when you watch men toss telephone poles in a Scottish field . . . as it is sometimes in other endeavors as well.
Advance-Decline Line Versions
Two weeks ago I debunked the myth that only the tech mega caps have been driving the market upward. I used one of my favorite market health indicators — the cumulative advance-decline (A-D) line. Interesting enough, a couple of research firms out there are jousting about
the usefulness of various versions of this very same indicator. So as not to take sides, I won’t mention any by name.
Here’s the controversy: there is an ongoing dialog (just how long it’s been going on, I’ll reveal below) where some advocate that the most commonly used A-D line (NYSE) — is not a valid indicator of market health nor is it an early warning tool as a divergence meter. These proponents claim the NYSE A-D line is unsound for these uses because many non-operating entity issues (symbols) contaminate it. According to this reasoning, it has so many interest rate sensitive components that the traditional NYSE A-D line gives a very blurred picture of “stock” market breadth.
To be honest, that’s a very compelling argument on its face. It makes sense . . . just like believing a bigger, stronger guy should be able to throw logs better than a smaller guy. Let’s dig in and see what we find.
Comparing The A-Ds
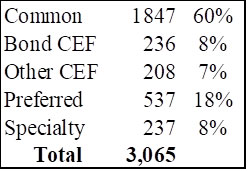
As of about three weeks ago, here’s the breakdown of the listed issue categories on the NYSE:
|
|
|
Here’s a little more detail about each category –
- Common = traditional operating companies like GE.
- Bond CEF = Closed End Funds (CEF) that are based on fixed income instruments.
- Other CEF = Many of these CEFs are Real Estate Investment Trusts and are also interest rate sensitive.
- Preferred stocks = These stocks are mostly issued by “common” stock companies and have hybrid characteristics of both an operating company and a fixed income investment due to their typically high dividends.
- Specialty = This category is a catch-all for the unusual listings like rights, warrants, structured products, “when issued”, and anything else that does not fit into the other categories.
Why dig into the arcane makeup of the NY stock exchange? So we can see that two-thirds of the market’s symbols represent operating companies (consider that at least some of the preferred stocks act like their underlying stocks).
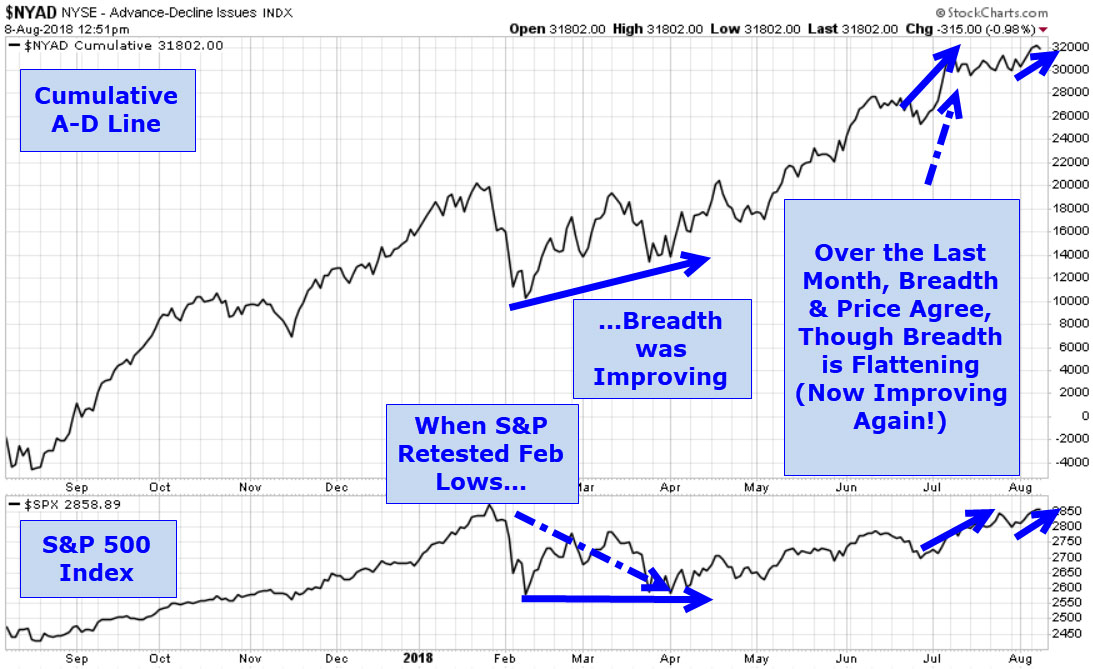
For a fully informed view, let’s look first at the A-D line for all symbols and then at the A-D line for operating companies only. Here’s the traditional “all-issues” version:
|
|
|
Just a quick note — in the two weeks since I wrote the previous article on this topic, the S&P 500 has had tiny pullbacks on tariff troubles or concerns over Facebook’s earnings report, but has resumed its upward climb showing that broad market participation continues.
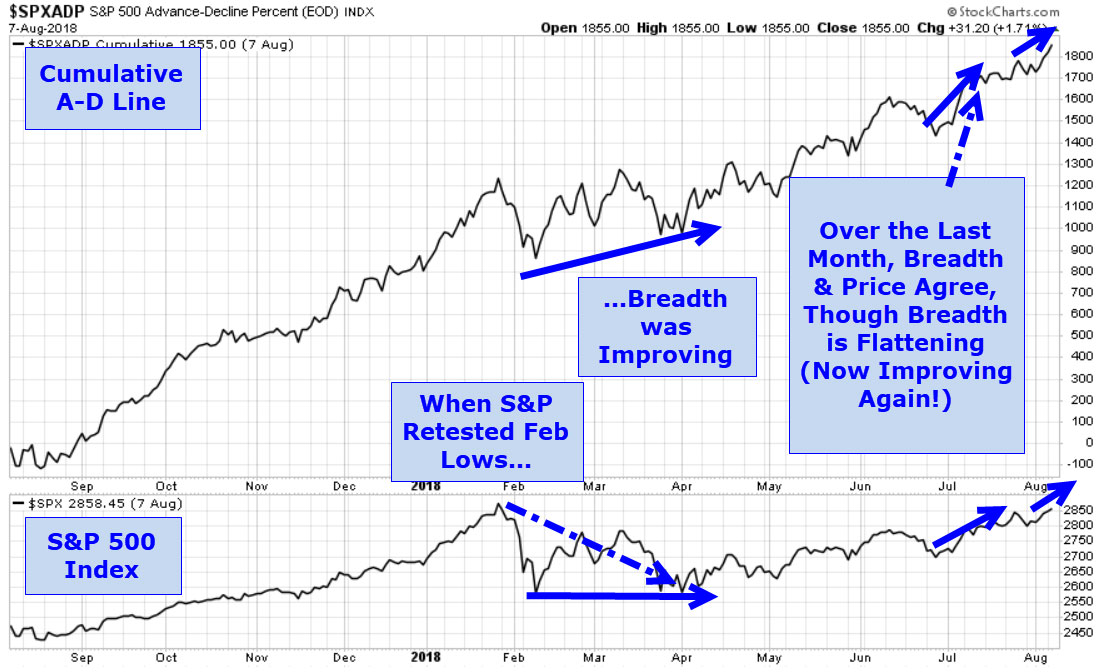
Now, let’s look at the A-D line for operating companies only. Fortunately, the good folks at stockcharts.com have an A-D line for the S&P 500 — operating companies one and all. This chart shows the S&P 500 Advance-Decline line percentage which is a mathematical analog (essentially equivalent) for the straight numbers of the NYSE A-D line. Here is that chart for the same time frame:
|
|
|
Honestly, I can’t see much of a difference. Can you? They look almost identical.
To be fair, you can find some differences in the “all-issues” and “operating-only” lines, but to find the differences, you typically have to look at a far too short of a time frame. That kind of granularity is not useful for such a broad-brush (albeit useful) tool.
The Long Running Debate and Today
How far back does the dialog about the usefulness of the two competing versions go? Quite a long while back. Five years ago, I did a 90 minute webinar centered around this controversy and we saw very similar results. Long before that, however, two of the founding fathers of the stock analysis newsletter business made great calls independently for a market top in the early nineteen sixties. Both cited the NYSE A-D line as one of the tools they used to make their calls. Both were roundly criticized at the time of their calls for using an indicator that was “contaminated” but still, both got the call spectacularly right. I’ll dig more into these two legends and their
great call in a future article.
Most importantly, while it’s a blunt instrument, the NYSE A-D has been very useful for almost six decades in warning about market tops. For now, let’s realize that the argument about the problem with the “contaminated” A-D line is fine fodder for academics — and actually makes intuitive sense — just like picking the biggest caber thrower. Here in the real world, the good ‘ol fashioned NYSE A-D just keeps working — and keeps us on the right side of the market.
I always love to hear your thoughts and feedback — just send an email to drbarton “at” vantharp.com.
Great Trading,
D. R.
|
|
|
|
|
|
About the Author: A passion for the systematic approach to the markets and lifelong love of teaching and learning have propelled D.R. Barton, Jr. to the top of the investment and trading arena. He is a regularly featured analyst on Fox Business Networks’ Varney & Co. TV show (catch him Tuesdays at 9:30 a.m. EST), on Bloomberg Radio Taking Stock and MarketWatch's Money Life Show. He is also a regular guest analyst on CNBC World, CNBC's Closing Bell, Fox Business Network’s Cavuto Coast to Coast and Making Money with Charles Payne and the China Global Television Network. His articles have appeared on SmartMoney.com, MarketWatch.com and Financial Advisor magazine. You may contact D.R. at "drbarton" at
"vantharp.com."
|
|
|
|
|
|
|
|
|
Learn Van's motivation behind his workshops in the video below. Then come see him in person this October in London.
|
|
|
|
Why Size Really Does Matter!
by Van K. Tharp, Ph.D.
|
|
|
|
|
How many shares or contracts should you take per trade? It's a critical question, one that most traders don't really know how to answer properly.
Position sizing™ strategies are the parts of your trading system that answers this question. They tell you “how much” for each and every trade. Whatever your objectives happen to be, your position sizing™ strategy achieves them. Poor position sizing strategies are the reason behind almost every instance of account blowouts.
Position sizing is the part of your trading system that tells you “how much.”
Once a trader has established the discipline to keep their stop loss on every trade, without question the most important area of trading is position sizing. Most people in mainstream Wall Street totally ignore this concept, but I believe that position sizing and psychology count for more than 90% of total performance (or 100% if every aspect of trading is deemed to be psychological).
Position sizing is the part of your trading system that tells you how many shares or contracts to take per trade. Poor position sizing is the reason behind almost every instance of account blowouts. Preservation of capital is the most important concept for those who want to stay in the trading game for the long haul.
Why is Position Sizing So Important?
Imagine that you had $100,000 to trade. Many traders (or investors, or gamblers) would just jump right in and decide to invest a substantial amount of this equity ($25,000 maybe?) on one particular stock because they were told about it by a friend, or because it sounded like a great buy. Perhaps they decide to buy 10,000 shares of a single stock because the price is only $4.00 a share (or $40,000).
They have no pre-planned exit or idea about when they are going to get out of the trade if it happens to go against them and they are subsequently risking a LOT of their initial $100,000 unnecessarily.
To prove this point, we’ve done many simulated games in which everyone gets the same trades. At the end of the simulation, 100 different people will have 100 different final equities, with the exception of those who go bankrupt. And after 50 trades, we’ve seen final equities that range from bankrupt to $13 million—yet everyone started with $100,000, and they all got the same trades.
Position sizing and individual psychology were the only two factors involved—which shows just how important position sizing really is.
How Does it Work?
Suppose you have a portfolio of $100,000 and you decide to only risk 1% on a trading idea that you have. You are risking $1,000.
This is the amount RISKED on the trading idea (trade) and should not be confused with the amount that you actually INVESTED in the trading idea (trade).
So that’s your limit. You decide to RISK only $1,000 on any given idea (trade). You can risk more as your portfolio gets bigger, but you only risk 1% of your total portfolio on any one idea.
Now suppose you decide to buy a stock that was priced at $23.00 per share and you place a protective stop at 25% away, which means that if the price drops to $17.25, you are out of the trade. Your risk per share in dollar terms is $5.75. Since your risk is $5.75, you divide this value into your 1% allocation ($1,000) and find that you are able to purchase 173 shares, rounded down to the nearest share.
Work it out for yourself so you understand that if you get stopped out of this stock (i.e., the stock drops 25%), you will only lose $1,000, or 1% of your portfolio. No one likes to lose, but if you didn't have the stop and the stock dropped to $10.00 per share, your capital would begin to vanish quickly.
Another thing to notice is that you will be purchasing about $4,000 worth of stock. Again, work it out for yourself. Multiply 173 shares by the purchase price of $23.00 per share and you’ll get $3,979. Add commissions and that number ends up being about $4,000.
Thus, you are purchasing $4,000 worth of stock, but you are only risking $1,000, or 1% of your portfolio.
And since you are using 4% of your portfolio to buy the stock ($4,000), you can buy a total of 25 stocks without using any borrowing power or margin, as the stockbrokers call it.
This may not sound as “sexy” as putting a substantial amount of money in one stock that “takes off,” but that strategy is a recipe for disaster and rarely happens. You should leave it on the gambling tables in Las Vegas where it belongs.
Protecting your initial capital by employing effective position sizing strategies is vital if you want to trade and stay in the markets over the long term.
People who understand position sizing and have a reasonably good system can usually meet their objectives through developing the right position sizing strategy.
Position Sizing—How Much is Enough?
Start small. So many traders who trade a new strategy start by immediately risking the full amount. The most frequent reason given is that they don’t want to “miss out” on that big trade or long winning streak that could be just around the corner. The problem is that most traders have a much greater chance of losing than they do of winning while they learn the intricacies of trading the new strategy. It's best to start small (very small) and minimize the “tuition paid” to learn the new strategy. Don’t worry about transactions costs (such as commissions), just worry about learning to trade the strategy and follow the process. Once you’ve proven that you
can consistently and profitably trade the strategy over a meaningful period of time (months, not days), you can begin to ramp up your position sizing strategies.
Here's what our friend and colleague D.R. Barton said about it: "I've talked to many folks who have blown up their accounts. I don’t think I've heard one person say that he or she took small loss after small loss until the account went down to zero. Without fail, the story of the blown-up account involved inappropriately large position sizes or huge price moves, and sometimes a combination of the two."
Manage losing streaks. Make sure that your position sizing algorithm helps you reduce the position size when your account equity is dropping. You need to have objective and systematic ways of avoiding the “gambler’s fallacy.” The gambler’s fallacy can be paraphrased like this: after a losing streak, the next bet has a better chance of being a winner. If that's your belief, you'll be tempted to increase your position size when you shouldn’t.
Don’t meet time-based profit goals by increasing your position size. All too often, traders approach the end of the month or the end of the quarter and say, “I promised myself that I would make “X” dollars by the end of this period. The only way I can make my goal is to double (or triple, or worse) my position size. This thought process has led to many huge losses. Stick to your position sizing plan!
This information will help guide you toward a mindset that values capital preservation. This article comes from my Tharp's Concepts material and though many have read it before, it is information that bears repeating.
|
|
|
|
|
|
About the Author: Trading coach, and author, Dr. Van K. Tharp is widely recognized for his best-selling books and his outstanding Peak Performance Home Study program - a highly regarded classic that is suitable for all levels of traders and investors. You can learn more about Van Tharp www.vantharp.com.
|
|
|
|
|
|
|
|
|
Presented by Gabriel Grammatidis
|
|
|
|
August 11-13
Saturday-Monday
|
|
|
|
|
|
|
|
Presented by Gabriel Grammatidis
|
|
|
|
August 14-15
Tuesday-Wednesday
|
|
|
|
|
|
|
|
Presented by Kim Andersson
Profit When Price Goes Nowhere: How to Successfully Trade Sideways Markets In Every Time Frame
|
|
|
|
August 17-19
Friday-Sunday
|
|
|
|
|
|
|
|
Sideways markets are the most common market type. Having a strategy on hand to take advantage of this market type is one of the best edges you can have. Very few traders seem to know how to make this kind of market type profitable.
This workshop is only held once this year, there's still time to secure your spot!
|
|
|
|
Presented by R. J. Hixson
|
|
|
|
September 14-16
Friday-Sunday
|
|
|
|
|
|
|
The How to Develop Winning Systems Workshop teaches you what you need to know to develop your own system. The material you will learn is not market or time-frame specific. So whether you trade stocks, futures, currencies, gold, etc., or
whether you place 50 trades per day or 50 trades per year, you will learn all of the components that work in any system. With this knowledge you can both modify existing systems to fit you or the market type better, or master your own system development. Two locations to choose from, Cary, NC in September and London, England in October!
|
|
Peak Performance 202 is SOLD OUT! Look for the next event first or second quarter 2019.
|
Presented by Libby Adams and RJ Hixson
|
|
|
|
September 18-21
Tuesday-Friday
|
|
|
|
|
|
|
|
|
|
October 2018 - LONDON, ENGLAND
|
|
|
|
Presented by Van Tharp,
with RJ Hixson
|
|
|
|
October 12-14
Friday-Sunday
|
|
|
|
|
|
|
|
Do any of the following sound like you?
- Are you always looking for a new trading system? Or, are you always trying to improve the one you have?
- Do you find your trade setups never quite fit all of your criteria so you have trouble entering trades?
- Do you get anxious about the market or get anxious about risking your money so that you have trouble pulling the trigger?
- Do you get excited and ignore your rules or do you get distracted and fail to follow your system's rules?
- Does a losing trade take your energy away from the next trade or conversely, does a winning trade make you confident about the next trade?
- Is your trading (or your life?) ruled by fear, anger, greed, or shame?
- Are you constantly losing money?
- Do you lack a strong plan to guide your trading or do you fail to follow the plan you created?
- Do you have a performance ceiling where you fall apart or stop doing well consistently? Does your account reach a certain size and then it plateaus or you start losing money at that point?
If you answered yes to any of these questions, then you are experiencing some form of self-sabotage. But don’t worry, these are some very common patterns for traders and you can overcome them in order to reach your potential. This workshop will help you identify and resolve the underlying conflicts causing these patterns — as well as leave you with the tools to address conflicts that come up in the future for you.
It's been Van Tharp's cornerstone workshop for over three decades. Read more to learn the benefits you will walk away with.
Peak Performance is also a very important workshop to put on your calendar if you want to qualify for and apply to the Super Trader Program.
|
|
|
|
October 16-18
Tuesday-Thursday
|
|
|
|
|
|
|
The How to Develop Winning Systems Workshop teaches you what you need to know to develop your own system. The material you will learn is not market or time-frame specific. So whether you trade stocks, futures, currencies, gold, etc., or
whether you place 50 trades per day or 50 trades per year, you will learn all of the components that work in any system. With this knowledge you can both modify existing systems to fit you or the market type better, or master your own system development.
|
|
Presented by Gabriel Grammatidis
|
|
|
|
October 20-22
Saturday-Monday
|
|
|
|
|
|
|
|
Presented by Gabriel Grammatidis
|
|
|
|
October 23-24
Tuesday-Wednesday
|
|
|
|
|
|
|
|
The Theory: All You Need to Know About Forex
Gabriel will spend most of the workshop teaching his trend-following systems. The first half day is spent to go over the specifics of trading the Forex market and cover such topics as:
- Why trade Forex?
- What are the advantages and drawbacks of trading Forex versus other instruments?
- What are the main market characteristics, and who are the Forex market participants?
- What methods work best in the Forex market?
- All you need to know about Forex trading sessions and the currency pairs.
- How are Forex chart characteristics different than stocks or futures?
- What do you look for in a Forex broker? What do you avoid?
- Why Forex may actually be the best market for new traders to learn trading.
- What are the trading edges that work in Forex?
- The Method
Gabriel will discuss a number of Forex trading ideas at his workshop and teach three specific trading systems. All three are trend-based; you can see the price action patterns in the price charts. His systems can be traded in various timeframes and can be traded across a wide range of currency pairs. Attendees of Gabriel’s workshops enjoy swing trading the systems using primarily 5-min ,15-min, 60-min and daily candle charts. The trades tend to evolve over a timeframe of anywhere from several hours to a couple of days (or even weeks, in the case of strong trends).
|
|
|
|
October 26-28
Friday-Sunday
|
|
|
|
|
|
|
|
In this workshop, you begin to build your plan that includes specific, actionable steps you can begin as soon as you get back home. Here are some of the benefits of attending the workshop:
- Assess your beliefs about trading about yourself so you can leverage your useful beliefs and eliminate the ones that are holding you back.
- Learn how to steer your entire system development process through your objectives.
- Find the key ingredient that most traders and investors are missing in their objectives that will make you thrive financially.
- Create a business plan with 3 trading strategies compatible with the big picture so your trading results are consistently profitable.
- Learn the 8 critical areas of contingency planning that most traders find out about the hard way (i.e., the expensive way). Developing plans for contingencies minimizes the risks to your trading business that could otherwise wipe you out.
- Discover how to leverage the strengths of your personality type and minimize your personal challenges to improve your trading.
- Learn how to cultivate the most important attitude required for successful trading.
|
|
|
|
|
|
November 9-11
Friday-Sunday
|
|
|
|
|
|
|
|
|
|
November 12-13
Monday-Tuesday
|
|
|
|
|
|
|
|
Exciting New Work from Van Tharp
|
|
|
|
November
15-17
Thursday-Saturday
|
|
|
|
|
|
|
|
|
|
FREE Book!
We pay for the book, you just pay for shipping.
When you add the free book to an item already being shipped there is generally no extra shipping charge (of course, depending on your location).
Read Van’s Latest Book —
TRADING BEYOND THE MATRIX
The Red Pill for Traders and Investors
Eleven traders tell their stories about transforming
their trading results and lives, in this 400 plus page book.
Below is a brief video on how powerful this book is to traders.
|
|
|
|
GDPR COMPLIANCE:
The European Union General Data Protection Regulation (GDPR) went into effect on May 25, 2018 and is designed to allow individuals to more effectively control their personal data. At The Van Tharp Institute (IITM, INC) , client information is private and confidential; we do not share, trade, or sell to anyone. We never have. You may ask us at any time to unsubscribe. We keep your information safe. If you’d like access to your information just ask. You receive this information from us because you opted into the Van Tharp newsletter either through direct registration or registration through our Tharp Trader Test.
You may opt out below.
102A Commonwealth Court | Cary | NC | 27511
Unsubscribe
Cary, NC Workshop Information
For a list of nearby hotels for our Cary, North Carolina locations,
click here.
Book your flight arriving to the Raleigh-Durham International Airport (RDU).
When traveling to a three-day course, it's best to arrive the evening before.
To help determine your arrival and departure times, see:
Questions? Click Here to Ask Van...
CONTACT US
This is a supplement to our subscription based newsletter, Tharp's Thoughts.
800-385-4486 * 919-466-0043 * Fax 919-466-0408
|
|
|
|
|


