|
Peak 101 qualifies you to become a Super Trader.
|
|
|
|
|
|
Tharp's Thoughts
Inbox Mentoring
|
|
|
|
|
|
|
|
-
Feature: May 2018 Market Update:
Bear Normal Market Type, by Van K. Tharp, Ph.D.
-
Workshops: Forex Is Back! August and October Events
-
Tips: May 2018 System Quality Number ® Report
The SQN ® Report, by Van K. Tharp, Ph.D.
-
-
GDPR: Read Our GDPR Statement
|

|
|
Future Super Traders: Important Notice
Peak Performance 101 in July is a very important workshop to put on your calendar if you want to qualify for and apply to the Super Trader program. Why? The price for the program goes up on August 1, 2018.
- Currently, the cost is $22,500 per year and you pay for three years up front in two installments.
- After August 1st, the cost will be $25,000 per year and you’ll pay for three years up front in two installments.
July is your last month to get the current pricing of $22,500 per year. In addition, we are running two specials in July only:
- We'll offer the rate that was available in June 2017 of $20,000 per year if you make one payment of $60,000.
- We will also give you the option to make three payments: $23,000 payable up front and two more payments of $23,000 in semi-annual installments.
One Payment Offer — If you apply to become a Super Trader before August 1st, Dr. Tharp has a special price offer for you! The payment for the program is generally set up for 2 payments 6 months apart, but by paying upfront you can save $7,500 off the total current cost of $67,500 for 3 years when you qualify for the program! If you are accepted in July, you get this discounted rate by making one lump sum payment. This offer is only good through July 31st.
Your first step is registering for the Peak Performance 101, July 13 - 15, 2018
Learn more about the "Super Trader experience" in the video below.
|

|
|
|
|
May 2018 Market Update:
Neutral Normal Market Type
by Van K. Tharp, Ph.D.
|
|
|
|
|
I always say that people do not trade the markets; they trade their beliefs about the markets. In that same way, I'd like to point out that these updates reflect my beliefs. I find the market update information useful for my trading, so I do the work each month and am happy to share that information with my readers. If your beliefs are not similar to mine, however, then this information may not be useful to you. Thus, if you are inclined to go through some sort of intellectual exercise to prove one of my beliefs wrong, simply remember that everyone can usually find lots of evidence to support their beliefs and refute others. Simply know that I admit that
these are my beliefs and that your beliefs might be different.
These monthly updates are in the first issue of Tharp's Thoughts each month which allows us to get the closing data from the previous month. These updates cover 1) the market type (first mentioned in the April 30, 2008 edition of Tharp's Thoughts), 2) the debt statistics for the US, 3) the five-week status on each of the major US stock market indices, 4) our four-star inflation-deflation model, and 5) tracking the US dollar. I also write a report on the strongest and weakest areas of the overall market as a separate SQN™ Report. Significant market changes may mean the SQN Report comes out more than once a month.
Part I: The Big Picture
The equity markets have been Neutral Normal for the last 38 days. On May 31st, the direction crossed the line into Bear but on June 1st, it crossed back to Neutral and volatility moved to Quiet. One or two days, however, is not indicative of what is happening and overall, it’s a sideways market. This is not an easy market to make money in (although we’ll show you how in our upcoming Sideways Market Strategies Workshop). Our market type classification system is descriptive of today’s conditions, not predictive of tomorrows. It’s like a trend. You know the direction, but you don’t know whether it will continue tomorrow.
|
|
|
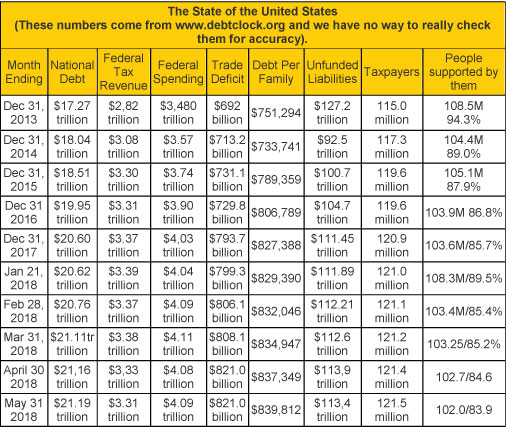
The US National Debt surpassed $21 trillion recently but I remember when I thought a trillion was awful. It’s now going up at about $40 billion monthly. Federal spending is now listed at over $4 trillion for the last nine months. Right now there are 23.7 million government employees which is actually up a little bit from the time Trump took office.
Currently there are 121.45 million taxpayers supporting 102.0 million other people. Here I’m counting retirees, disabled, and Food stamp recipients, however, the site lists 166.3 million people receiving some sort of benefit. I had to take social security last year, so I guess I’m one of them.
Part II: The Current Stock Market Type Is Neutral (Sideways) Normal
Although the Market SQN (100 days) was in Bear mode for a day on May 31st, I’m not calling it that. You’ll understand when I tell you Market SQN scores for the four market periods we watch in the S&P 500. The 200 day Market SQN is Bull. The 100 day score had been sideways for the previous 38 days. The Market SQN scores for 50 days and 25 days are both Neutral. In addition, volatility moved to Quiet on June 1 - which is not a sign of a bear market type so I’m calling the overall market direction Sideways or Neutral.
|
|
|
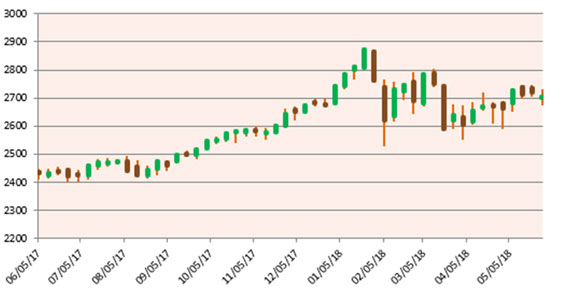
The first graph shows the S&P 500 in weekly bars over the last year so it is easy to see bull market in 2017. There’s the February drop and then it has been basically a sideways markets since then. Technical analysts might want to make something else out of this pattern but I’d just prefer to say it’s sideways. Notice that the bars were very volatile when the drop occurred but now they are smaller and pretty similar in size to the bull market last year.
In January, the S&P 500 hit 14 new all-time highs. February was the first time for a long time we had no new highs and now, the last all-time high was 87 market days ago. Next month, unless we make new highs, there will be no new all-time highs in the last 100 days.
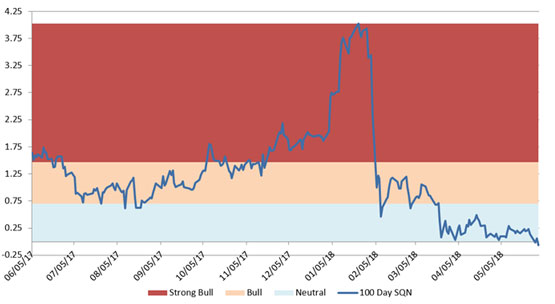
Here is the market type graph. It changed from a definite strong bull and in just a few weeks actually reached neutral territory. It has been in the neutral zone since mid-March.
|
|
|
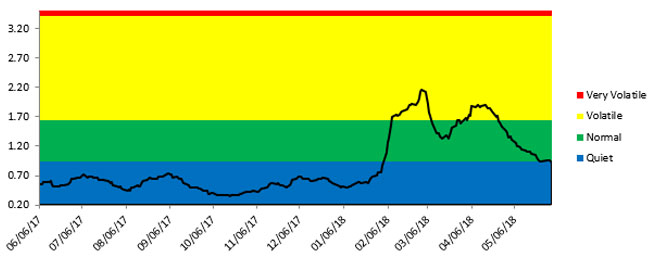
Four months ago I commented: “this volatility is so quiet that I had to change the axis to go below 0.5 in order to show the line (now at 0.41) This is not the climate out of which bear markets arrive.” The graph below, however, shows the new volatility in the market. In February, it zoomed through normal volatility and went into volatile market territory. It moved back into normal territory, became volatile again, and is now normal again but on the edge of quiet. If it stayed normal or entered volatile, then we could worry about this market, however, it could move into quiet again.
|
|
|
Right now the future direction of this market is anybody’s guess. I was stopped out of about 20% of my long term portfolio during the volatility, but most of it is still intact and with the market becoming quiet again, I see no reason to get out. (Going to Bear Volatile would be a reason to go to all cash in an account with no margin where you cannot short).
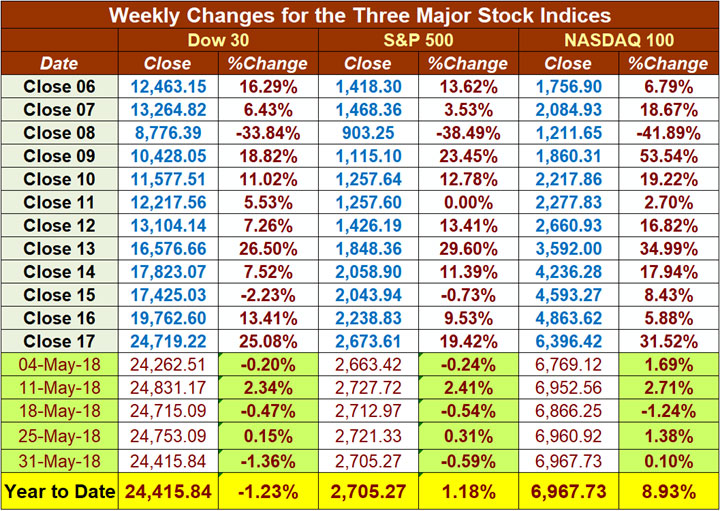
The spreadheet below shows the weekly changes in the three major stock indices over the last month.
|
|
After huge gains in 2017, and losses for most of 2018, the Dow 30 and the S&P 500 and the NASDAQ are actually up over 2018. The NASDAQ 100 is up almost 9% on the year.
Part III: Our Four-Star Inflation-Deflation Model
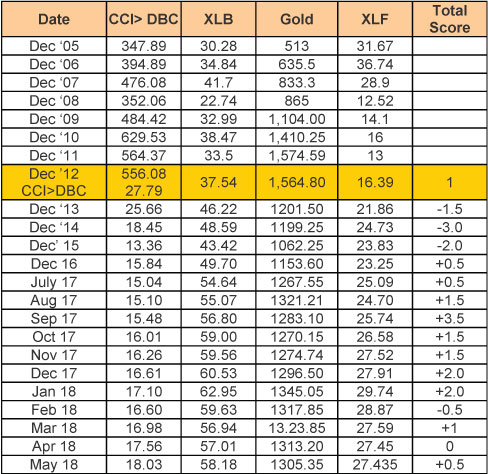
Gold, basic materials, and commodities are up over the last six month which produces an inflationary model score. See the historical numbers for previous years and the monthly figures for the last year below.
|
|

|
|
Our model seems to be resuming the inflation cycle that we had for most of 2017. Once again, I took a look at the shadowstat.com data and notice that the inflation rate, based upon how the CPI was calculated in 1980, still shows close to a 10% inflation rate. And according to shadowstats.com (real inflation adjusted GDP data), we’ve been in a recession since 2000 — 17.5 years.
Part IV: Tracking the Dollar
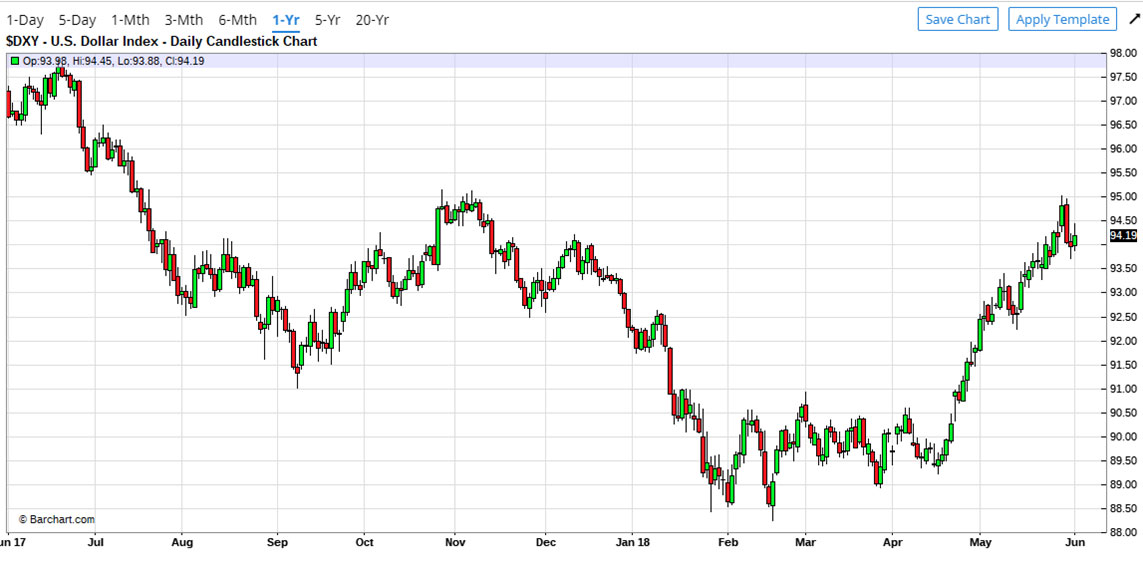
The Dollar went down through most of 2017. It had been pretty flat from mid-January for three months but then in the last month and a half, USD went up to hit resistance. If interest rates keep going up, then it could test the old highs when Trump first became president. Interest rates, however, cannot get too high because of our huge debt. The US cannot afford to pay 3-4% interest on a $21 trillion dollar debt.
|
|
|
Conclusion
In three months, we’ve gone from a Strong Bull Quiet market type to bearish to flat to the possibility of becoming bullish again. I’m calling it a Neutral Normal market type right now.
I’m not predicting anything here. The market is neutral. Neutral markets are very difficult to trade and many people lose money in such markets. You need to pay attention is what is the market doing. Three months ago a buy and hold strategy worked well (i.e., have a 25% trailing stop). But now the market type is clearly different and if you have not been stopped out, then you should make sure that your trading/investment strategies can tolerate a sideways market (and we have a workshop of how to profit in sideways markets coming up in August).
I monitor market type because it helps traders understand which kind of trading systems they should be using right now. You would not have done too well in the last month trading bull quiet systems. But systems that take advantage of some volatility and sideways direction would have done fine.
Rather than trying to predict what the market will do and how to be proactive with your positions ahead of the market, simply know the market type and trade the appropriate systems.
This approach makes a few assumptions —
- You have a market type classification system and you use it. My market type classification system works well for me but it may not fit you. If that’s the case, how would you go about describing and classifying market conditions? And you should really understand it and the implications of the meaning it is giving you.
- You understand trading systems. You know the parts, the purpose of each, and how they work together well. You understand the system’s edge and the beliefs behind it that enable the system to profit.
- You have a trading system development process and can develop one or more systems for each market type. Most people try to create a trading system that performs well all the time. If that’s what you have been trying to do, save your time and effort — focus on one particular set of market conditions per system.
- You trade one or more systems created for the current market type. (Some trading systems may perform best in one market type but will perform acceptably well in one or two other market types also.)
Look at the market type. What’s the market doing right now? It’s Sideways Normal. The bull could resume but a quick transition to a bear market type is equally possible.
Until next month, this is Van Tharp.
|
|
|
|
|
|
About the Author: Trading coach, and author, Dr. Van K. Tharp is widely recognized for his best-selling books and his outstanding Peak Performance Home Study program - a highly regarded classic that is suitable for all levels of traders and investors. You can learn more about Van Tharp www.vantharp.com.
|
|
|
|
|
|
|
|
|
Get even more details on our Peak Performance 101 workshop.
|
|
|
|
May 2018 System Quality Number® Report
The SQN® Report
by Van K. Tharp, Ph.D.
|
|
|
|
|
There are numerous ETFs that track everything from countries, commodities, currencies and stock market indices to individual market sectors. ETFs provide a wonderfully easy way to discover what’s happening in the world markets. I apply a version of my System Quality Number® (SQN®) score to measure the relative performance of numerous markets in a world model.
The Market SQN score uses the daily percent change for input over a 100-day period. Typically, a Market SQN score over 1.47 is strongly bullish and a score below -0.7 is very weak. The following color codes help communicate the strengths and weaknesses of the ETFs in this report:
- Dark Green: ETFs with very strong Market SQN scores > 1.47
- Light Green: ETFs with strong Market SQN scores (0.70 to 1.47).
- Yellow: ETFs with slightly positive Market SQN scores (0 to 0.70). These are Neutral/Sideways
- Brown: ETFs with slightly negative Market SQN scores (0 to -0.7).
- Red: Very weak ETFs that earn negative Market SQN scores (< -0.7).
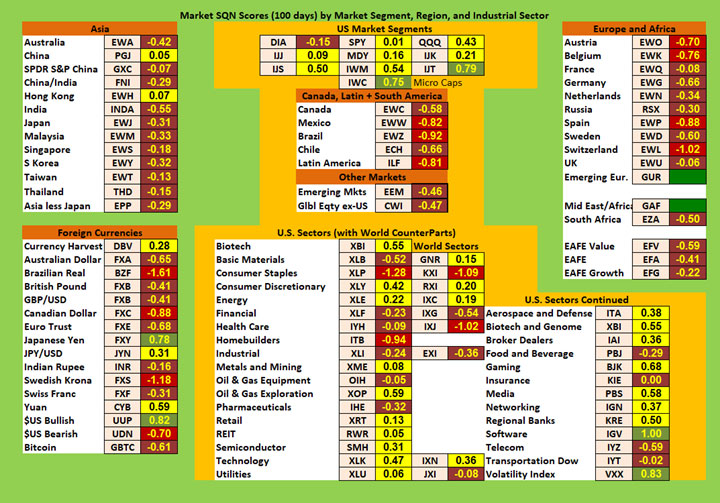
This is basically the same rating scale that we use for the Market SQN Score in the Market Update. The world market model spreadsheet report below contains a cross section of currently available ETFs; excluding inverse funds and leveraged funds. In short, it covers equity markets around the globe, major asset classes, equity market segments, industrial sectors, and major currencies.
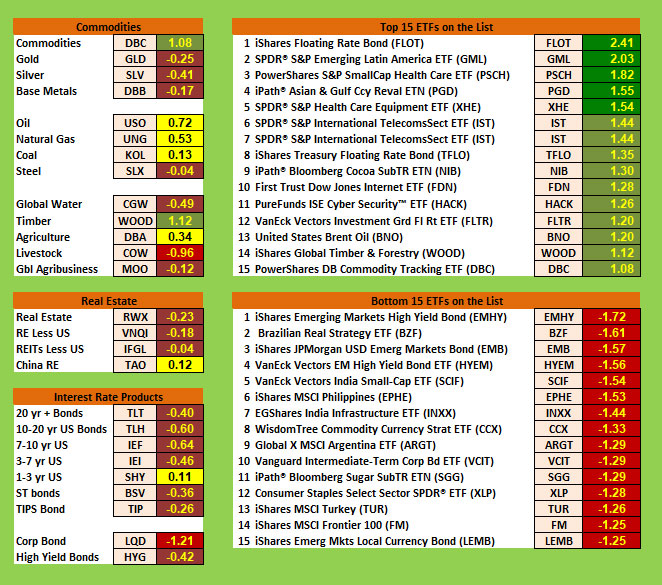
World Market Summary — Equities & Currencies
Each month we look at the equities markets across the globe by segment, region, and sector.
The US Dollar is a strong currency now having gone up for most of the month of May. The world model is totally valued in the US dollar so that might explain why everything is decreasing relative to the dollar.
Overall, the US market segments looked amazing four months ago but they are pretty neutral this month with one brown area (The Dow) and one green area (Microcaps). The Dow had a Market SQN score of 4.5 and the S&P 500 score was 3.62 — again extremely high — four months ago. And now the Dow is brown and the S&P 500 just positive at 0.11.
The other country markets in the Americas are brown (Canada and Chile) or red (Mexico, Brazil, and Latin America). Emerging markets are also brown.
Asia was mostly yellow last month and now it’s brown with just two yellow ETFs — China and Hong Kong (essentially China). Everything else, as I said, is brown.
Europe also grew weaker. Last month, Europe was mostly yellow with three brown countries — Germany (-.09); Sweden (-0.19); and Switzerland (-0.28). This month, Austria, Belgium, Spain, and Switzerland are all red while everything else is brown.
On the currencies side we have only two greens (the US Dollar and the Japanese Yen). The Yuan is yellow, seven currencies are brown areas and four are red. The reds include the Brazilian Real, the Canadian Dollar, the Swedish Krona, and the inverse US Dollar. Bitcoin in now brown as well. It had a 69% drop followed by a 50% recovery, then another smaller drop and another recovery and another drop. On June 1st it was down about 63% from its high of about $20,000.
The US stock market sectors for May show no dark green and only one sector is light green (Software at 1.00). — the same one as last month. The rest are all neutral or bearish. Consumer Staples and Homebuilders are both still red. Brown sectors include Basic Materials, Financial, Health Care, Industrial, Oil and Gas Equipment, Pharmaceuticals, Food and Beverage, Insurance, Telecom, and the Dow Transports. Volatility is still light green (over 200 days). The US stock market is now neutral with a slight bearish tilt.
|
|
|
Commodities, Real Estate, Debt, and the Top and Bottom Lists
Commodities continue to be mixed. Timber and Commodities are light green. Oil, Natural Gas, Coal and Agriculture are neutral. Gold, Silver, Base Metals, Global Water, and Global Agribusiness are brown. Steel is also brown despite Trump’s just announced tariffs against imported steel. Livestock is now red.
Interest rate products still look terrible. Only the 1-3 year US bonds are neutral. Everything else is brown except for corporate bonds which are red. High yield bonds are doing better than corporate bonds, being only brown. This is not the time to try and hide in bonds.
In real estate, China is neutral and everything else is brown.
|
|
|
The strongest ETF list has only two that are above 2.0 which is the same as the last three months. The top two this month are also the same two as last month — Floating Rate Bonds, and Latin America. The rest of the top 15 are light green with scores less than 2.0.
The weakest ETFs are all red. The worst is Emerging Markets High Yield Bonds but nothing is lower than -1.72.
Summary
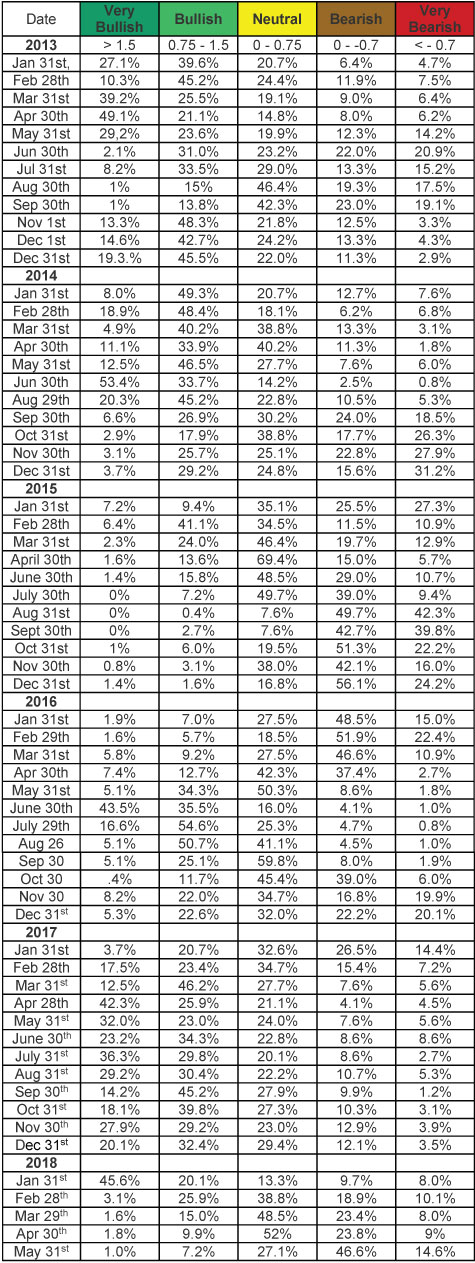
Let’s look at the summary table which measures the percentage of ETFs in each of the strength categories. You can see the distribution of the database by Market SQN score in bullish, neutral and bearish categories just below —
|
|
|
65.7% of our ETFs were in the bull or strong bull categories four months ago but that has moved to 8.2% this month. And we’ve moved from 31.8% of our ETFs being bear to strong bear two months ago to 61.2% this month. We’re in a correction which could be temporary or we could move next into a bear market.
Be careful to base your actions upon what IS happening, not what you think might happen. The markets always offer opportunities, but to capture those opportunities, you MUST know what you are doing. If you want to trade these markets, you need to approach them as a trader, not a long-term investor. We’d like to help you learn how to trade professionally because trying to navigate the markets without an education is hazardous to your wealth. All the beliefs given in this update are my own. Though I find them useful, you may not. You can only trade your own beliefs about the markets.
Until next month this is Van Tharp.
|
|
|
|
Two Dates - Two Continents
Peak Performance 101 Will Change How You THINK about Trading
♦ JULY 13-15, CARY, NC
♦ OCTOBER 12-14, LONDON, ENGLAND
|
|
Workshop Objectives
Students will learn and begin to understand each of these objectives after attending Peak Performance 101:
- How great traders approach their craft and learn a daily procedure that resembles what they do.
- How you create your own experience in the market and how you are responsible for the results that you get.
- Become more aware of some of your own psychological issues that affect your performance as a trader/investor.
- Learn about expectancy, position sizing strategies and the power of big R-multiples through a simulation game. This game is also designed to help you observe your emotions in a setting in which only a small amount is at stake compared with what you will face in the market.
- Learn some of the variables that affect your emotions and how you can gain control over them.
- Learn to overcome self-sabotage through exercises done in the class.
- Students will get guidance on how to develop an ongoing program to work on themselves using the Super Trader Program as a model.
- Students will leave with a plan to make the maximum use of the workshop.
- Participants in this course will get to meet and network with some really great people who have a lot in common with each other.
Attendees were asked to list the top five benefits of attending this workshop. Here are some examples:
- Being part of a group that has similar objectives in life.
- Learning exercises to control emotions.
- Identifying issues that hurt trading.
- Learning the ten tasks of trading and their mental states and strategies.
- Discovering beliefs attendees never knew they had.
- Experiential learning through the exercises and game.
|
|
|
|
Cryptoasset Trading & Blockchain Technology
Only available to those enrolled in our Super Trader Program.
Presented by Van Tharp
|
|
|
|
June 19-21
Tuesday-Thursday
|
|
|
|
|
|
|
|
The Basic and Advanced Options workshops have now been opened to the public (this workshop is traditionally a Super Trader Only workshop). However, to attend there are certain qualifications you must meet. Please call us at 919-466-0043 so we may speak with you regarding your level of experience trading.
|
|
Options Trading
Presented by Chuck Whitman
|
|
|
|
June 23-25
Saturday-Monday
|
|
|
|
|
|
|
|
Options Trading Advanced
Presented by Chuck Whitman
|
|
|
|
June 27-28
Wednesday-Thursday
|
|
|
|
|
|
|
|
|
|
Presented by Van Tharp,
with RJ Hixson
|
|
|
|
|
|
|
|
|
|
|
July 17-19
Tuesday-Thursday
|
|
|
|
|
|
|
|
Learn the Mental Secrets for Getting What You Really Want!
The material covered in this course will be information you can use to improve your life and your effectiveness.
The material will also be cutting-edge. It's not the sort of thing you can learn anywhere else. This workshop will probably be the only place that you could possibly pick up all of this unique information together.
Most importantly, the material will be presented in a practical way with plenty of exercises so you can incorporate the strategies you learn right into your daily life. When you leave the workshop, the most important strategies will become part of you.
Remember, this is a very exclusive workshop. It requires that you’ve attended Peak 101. We will be doing a lot of work with sub-modalities so you should at least have a little experience working with submodalities.
In addition, you can expect highly motivated, like-minded, success-oriented traders like you to join you in this incredible experiential workshop.
|
|
|
|
Presented by Gabriel Grammatidis
|
|
|
|
August 11-13
Saturday-Monday
|
|
|
|
|
|
|
|
Presented by Gabriel Grammatidis
|
|
|
|
August 14-15
Tuesday-Wednesday
|
|
|
|
|
|
|
|
Presented by Kim Andersson
Profit When Price Goes Nowhere: How to Successfully Trade Sideways Markets In Every Time Frame
|
|
|
|
August 17-19
Friday-Sunday
|
|
|
|
|
|
|
The Forex Trading Systems Workshop teaches three robust Forex Systems. All three systems are based on the concept of trend-following. Each system is based on similar “ingredients,” but each has a different recipe to capture a different part of the trend. Consequently, the systems
are complementary to each other and together offer several trading setups nearly every day of the year. Two locations to choose from, Cary NC in August and London, England in October.
No matter what time frame you trade or what method you use to measure them, Sideways markets happen between 59% and 65% of the time! And even though they appear a majority of the time, Sideways markets are rarely discussed, even in professional trading circles. Until now....
|
|
|
|
Presented by R. J. Hixson
|
|
|
|
September 14-16
Friday-Sunday
|
|
|
|
|
|
|
|
Presented by Libby Adams and RJ HIxson
|
|
|
|
September 18-21
Tuesday-Friday
|
|
|
|
|
|
|
The How to Develop Winning Systems Workshop teaches you what you need to know to develop your own system. The material you will learn is not market or time-frame specific. So whether you trade stocks, futures, currencies, gold, etc., or
whether you place 50 trades per day or 50 trades per year, you will learn all of the components that work in any system. With this knowledge you can both modify existing systems to fit you or the market type better, or master your own system development.
Two locations to choose from, Cary, NC in September and London, England in October!
The Peak Performance 202 Workshop is divided into three sections covering 4 days:
- How you are programmed to follow the path that others want you to follow.
- The various games that you play.
- Personal reinvention.
Past participants say this was one of the most significant workshops they had ever attended. You will leave with a new sense of purpose and a new direction and a support team behind them.
|
|
|
|
Presented by Van Tharp,
with RJ Hixson
|
|
|
|
October 12-14
Friday-Sunday
|
|
|
|
|
|
|
|
|
|
October 16-18
Tuesday-Thursday
|
|
|
|
|
|
|
|
Presented by Gabriel Grammatidis
|
|
|
|
October 20-22
Saturday-Monday
|
|
|
|
|
|
|
|
Presented by Gabriel Grammatidis
|
|
|
|
October 23-24
Tuesday-Wednesday
|
|
|
|
|
|
|
|
|
|
October 26-28
Friday-Sunday
|
|
|
|
|
|
|
|
|
|
|
|
November 9-11
Friday-Sunday
|
|
|
|
|
|
|
|
|
|
November 12-13
Monday-Tuesday
|
|
|
|
|
|
|
|
Exciting New Work from Van Tharp
|
|
|
|
November
15-17
Thursday-Saturday
|
|
|
|
|
|
|
|
|
|
FREE Book!
We pay for the book, you just pay for shipping.
When you add the free book to an item already being shipped there is generally no extra shipping charge (of course, depending on your location).
Read Van’s Latest Book —
TRADING BEYOND THE MATRIX
The Red Pill for Traders and Investors
Eleven traders tell their stories about transforming
their trading results and lives, in this 400 plus page book.
Below is a brief video on how powerful this book is to traders.
|
|
|
|
GDPR COMPLIANCE:
The European Union General Data Protection Regulation (GDPR) went into effect on May 25, 2018 and is designed to allow individuals to more effectively control their personal data. At The Van Tharp Institute (IITM, INC) , client information is private and confidential; we do not share, trade, or sell to anyone. We never have. You may ask us at any time to unsubscribe. We keep your information safe. If you’d like access to your information just ask. You receive this information from us because you opted into the Van Tharp newsletter either through direct registration or registration through our Tharp Trader Test.
You may opt out below.
102A Commonwealth Court | Cary | NC | 27511
Unsubscribe
Cary, NC Workshop Information
For a list of nearby hotels for our Cary, North Carolina locations,
click here.
Book your flight arriving to the Raleigh-Durham International Airport (RDU).
When traveling to a three-day course, it's best to arrive the evening before.
To help determine your arrival and departure times, see:
Questions? Click Here to Ask Van...
CONTACT US
This is a supplement to our subscription based newsletter, Tharp's Thoughts.
800-385-4486 * 919-466-0043 * Fax 919-466-0408
|
|
|
|
|