|
Adaptive Swing Returns This April, Plus a New Futures Course!
|
|
|
|
|
|
Tharp's Thoughts
Inbox Mentoring
|
|
|
|
|
|
|
|
-
Feature: Understanding the Blockchain,
March Cryptocurrency Update,
by Van K. Tharp, Ph.D.
-
Workshops: Ken Long Returns with Advanced Adaptive Swing Trading in April, Cary NC
-
Tips: Back to a More Normal “Normal,”
by D. R. Barton, Jr.
-
|
|
This April Sharpen Your Trading Edge
With Our Advanced Adaptive Swing
Trading Systems Workshop
|
|
Ken Long returns to the Van Tharp Institute this April with his popular Advanced Adaptive Swing Trading workshop. Students of this workshop rave about the enormous, and invaluable amount of information and personal support they receive from this instructor. If you're a swing trader you won't want to miss this opportunity to learn the systems Ken teaches in this class.
Scroll down for a quick video lesson that highlights some of the most important concepts Ken covers in this workshop.
|
|
|
|
Understanding the Blockchain
March Cryptocurrency Update
by Van K. Tharp, Ph.D.
|
|
|
|
|
I personally think that the blockchain, and some cryptocurrencies, represent the opportunity of a lifetime. Consequently, I plan to do monthly updates on the cryptocurrency world. These will include some education so you can begin to take advantage of this opportunity as well as an overview of what is happening in the cryptocurrency world for the last month. We are also developing special programs for those in the Super Trader program to take advantage of this unique opportunity and we are encouraging each Super Trader to have one of their three systems operate in the world of cryptocurrencies. Why? Because the opportunities are staggering and cryptocurrencies are not highly correlated with other types of
investments. These updates will come out the 2nd Wednesday of each month and will cover developments over the prior month. And the format, of course, will evolve over time.
In the 1990s, the Internet was the game changer. During the stock market boom of the late 1990s, everyone was investing in dot com stocks. And, if a stock changed its name in some way to add a dot com, it soared regardless of whether or not it was making money or even whether or not it had the potential to do so. The Internet was about transferring information over the Internet – and it changed everything. Newspapers either died or adapted to the Internet. Google became a source for finding anything. You could obtain whole encyclopedias just by a click of a button. It changed the nature of everything.
During the 2007-2009 crashed, we saw the dangers of lots of power held by big banks and in central governments. Big banks could invent products that were insane and sell them to unwary people. And the result was a collapse of the world’s wealth. Big government and big banks had to work together to salvage everything. Those institutions that didn’t play the game well were allowed to fail. In this case, think Lehman Brothers and Bear Stearns. The crash really pointed out the dangers of everything being centralized. Furthermore, the Internet with its great promise, just furthered centralizations. A small number of companies started to dominate the Internet. Here I’m referring to names like Apple, Amazon, Google — all of which now have artificial
intelligence devices (i.e., Siri, Alexa, and Hey Google, respectively).
As the dangers of centralized money and power became more obvious, someone named Satoshi Nakamoto (not a real name and possibly a number of people) introduced the concept of decentralized money, namely Bitcoin in a white paper. The idea was open sourced and soon the first Bitcoin (BTC) appeared. Rather than concentrate money in one power such as a central bank, why not make it everywhere by anonymous individuals?
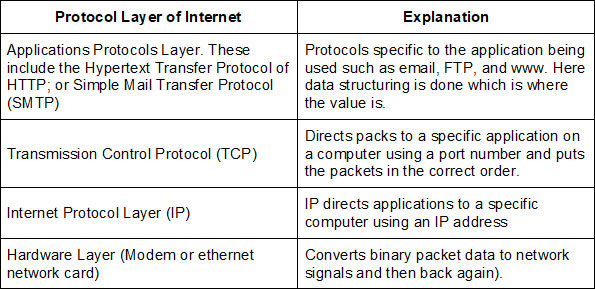
The Internet was based upon only a few protocols. The Internet Protocol (IP) is how data is sent from one computer to another on the Internet. Each computer on the Internet has at least one IP address, and that address uniquely identifies it from all other computers on the Internet. When you send or receive data (for example an email), the message gets divided into little packets. Each packet contains both the sender and the recipients address. Your packet is first sent to a gateway computer that understands a small part of the Internet. It reads the final address and then forwards the packet to another computer that also reads that address. This continues until it reaches a computer that recognizes that address as being within its domain (neighborhood).
That final computer forwards the email to the desired address. The first internet protocol is designed to deliver data to the correct place. There are various versions of the IP. Today Internet Protocol Version 4 (IPv4) is most widely used and it uses 232 addresses. But the sixth version, IPv6, provides for longer addresses and thus many more Internet users and it can read both IPv4 and IPv6 packets.
Note that each packet can go to the destination via a different Internet route. Each packet is independent of the other packets. It is the job of the second Internet Protocol, the Transmission Control Protocol or (TCP) to put the packets back together in the right order. At the TCP level a specific port on the computer is addressed. Many programs may be using the TCP/IP stack and sending messages, but a specific program will be listening to a specific port.
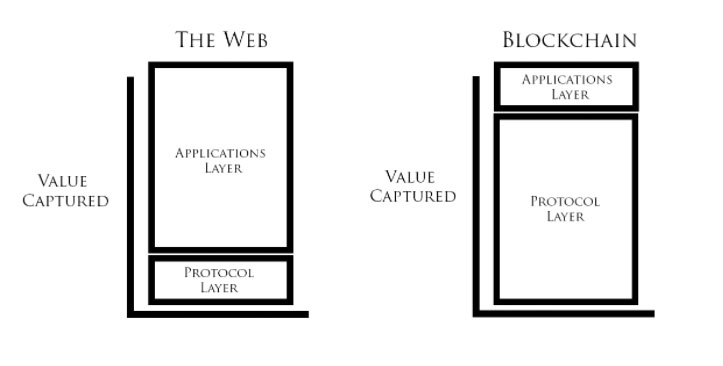
There are also protocols specific to particular applications such as email or the world wide web or FTP. It’s the application protocols that create value but without any way to capture that value because they are shared. The whole thing can be diagrammed simply as follows:
|
|
|
The reason I bring up this initial discussion of the Internet is because the Internet has very few protocols and those protocols belong to everyone. Mostly the Internet is about data and the massive organization and transfer of data between computers. It’s mostly centralized (there are data hubs) and places that store data (i.e., think Apple or Dropbox). Right now about half the world uses the Internet, but only about 5% of the world uses the blockchain. And the value of the web is in the data. Think about it. What is Amazon’s data worth? What is Google’s data worth? What is Facebook’s data worth? Why would you want to use any social media network other than Facebook? Facebook has the entire world while a new
one might have nothing.
|
|
|
The blockchain, however, is completely different. It is protocol intensive and it’s the protocols that are the key to it all. Success is obtained on the blockchain where there are “fat” protocols meaning it is protocol intensive. With Fat Protocols, the network is totally aware of all the important details (not some centralized data collection center). And because of this awareness, cryptocurrency protocols are better able to charge for the value being created. Fat protocols also allow entrepreneurs to build and create such protocols because they can create tokens which increase in value as the protocol usage increases. For example, imagine the value that would be accrued if you could charge for the ability to
send email.
But I’m getting ahead of myself. First, let me explain the blockchain.
In accounting, a ledger is a computer file or a book where you can find a complete record of all transactions related to a company or a piece of property, etc. for the life of that company or property. It records financial information on liabilities, assets, expenses, revenues, and owners’ equity. These are usually kept by some central entity such as the company.
The blockchain is a distributed (rather than centralized) ledger that is open to the public. Anyone can verify the records autonomously without the need to have a central entity. And the beauty of it is that it is very easy to determine (without anyone else being involved), whether anyone has tampered with that ledger. Thus, the blockchain is a public ledger than everyone can verify. But the blockchain is not only public but operates on real time. Now a block is a set of records (defined by the limits of the block size). It is called a block “chain” because each change in the record is chained to the other blocks.
Each transaction in the blockchain is first encrypted. The encrypted transaction is added to other transactions until a “block” of a specific size is formed. The block is the broadcast to the entire network of computers within the blockchain. The beauty of the blockchain is that it eliminates the middle man. Thus, there is no need for financial institutes like credit card companies or banks. The blockchain itself creates trust. It does this through ownership control and by preventing double spending. Let’s look at each of these.
Ownership control is provided by digital signatures. The user creates two different cryptography keys, one public and one private. He uses the private key to sign a transaction and everyone uses the public key to verify the transaction.
Double spending is prevented by making each transaction in the blockchain irreversible. Each transaction is linked or chained to those that came before it as in a ledger. And this is done with complex math calculations. So setting up the blockchain is difficult to do, but the results are easy to verify. The overall goal is to make it too expensive to cheat, but easy to verify. There are many, many computers in the blockchain and you would have to control a majority of them to be able to cheat or alter the transactions.
While I said blockchain transactions were irreversible, there has been one exception to this, the Ethereum fork. On June 3, 2016 approximately $50 million ETH was taken from the venture capital fund DAO. The hard fork was taken so that the ETH could be restored and to prevent the guilty parties from using the stolen money. But this involved overcoming the irreversibility of transactions. Those who agreed with the fork created a new token which was named Ethereum. And the old token, which was still popular, was named Ethereum Classic.
More on the Blockchain Next Month...
March Update on Cryptocurrencies
By January 1st, 2018 the crypto market had skyrocketed in the previous few months. My account was up tenfold by the end of December what I invested in June / July and my November / December investment amount was up by five-fold.
I didn’t record the exact amount, but around January 1st, the market capitalization of cryptocurrencies was about $700 billion. BTC had climbed to nearly $20,000 from $14K on December 1st.
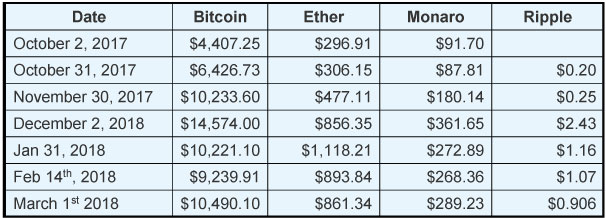
Okay, so fast forward two months and see the figures below —
|
|
|
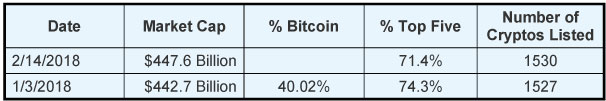
I’m adding a second table that includes the number of cryptocurrencies and the total market cap and the percentage of that that includes BTC and the top five cryptos by market cap.
|
|
|
Let’s talk about the last 45 days that have been a market crash. First, BTC went from a December 17th high of $20.089 to a Feb 6th low of $6048 and then back to its current price of $9239.91. The drop was 69.9%. And the recovery so far in one week is 52.8%. When I did my cryptocurrency webinar, and everyone was predicting BTC $40,000, I mentioned 1) that BTC could fall 75% before it hit $40,000 and 2) that $40,000 was only a 100% gain. That’s only a 1:1 Reward to Risk, which is not that good.
When you ask for reasons for the crash, you get the following:
- South Korea was a major player in the crypto market and the government started cracking down on crypto trading.
- Another big crypto exchange was hacked and went bankrupt.
- Regulators have not been saying kind things about crypto in Europe so there is fear of a crackdown.
- Trading volumes dipped significantly in Japan, even thought there was little fear of any sort of regulatory crackdown.
- But probably the main reason was the huge increase in the market in November and December. Notice that Bitcoin even at its Feb 6th low was still way above its price on October 2nd of $4407.25.
Furthermore, I think the crash has a way of weeding out the pretenders from the real thing.
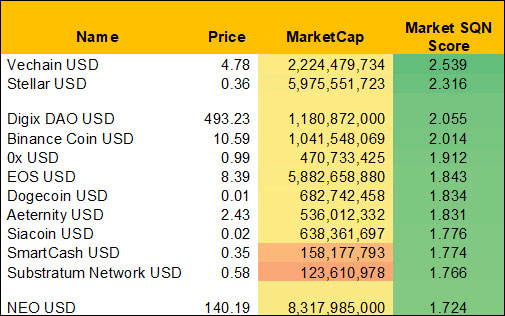
Yahoo finance now has about 100 cryptocurrency prices, so I can run some of my normal studies, however, I’m only looking at those coins (even in the top 100) for which there is at least 100 days of data.
These are the top 10 coins by Market SQN Score at the end of February 2018.
|
|
|
On Feb 14th we have six of them above 2.0 and all of the top ten were above 1.9. At the end of Feb, only five of them are above 1.9. In December the top 10 were probably all above 4.0, but that’s just a guess and I wasn’t keeping track of this data at that time. Please note that just because a crypto currency shows up in the top 10 doesn’t make it a good buy.
Two interesting observations are that of the 95 coins in the list, 91 have Market SQN® scores that are positive.
The other interesting data that came out of this month’s data is that BTC ranks 84th out of 95 possible cryptos. If you’d like any sort of prediction from me, it’s probably that BTC will not be the primary crypto currency of use in the blockchain network within two years, perhaps even within a year. The reason is that it is slow, expensive to send, an energy hog, and there are much, much better alternatives. Even one of the forks, Bitcoin Cash, BCH, is much better than BTC. I recent sent $400 worth of BTC from my hard wallet to an exchange. It was scheduled to arrive in 40 min (very slow), however, it took 10 hours to confirm it and arrive, (and that had nothing to do with the exchange being slow).
Incidentally, the New Infinite Wealth workshop in Sydney in late March will cover ways to make passive income from cryptocurrencies. Look forward to some very valuable information if you can attend that workshop in Sydney.
Until the 2nd week of April, this is Van Tharp.
|
|
|
|
|
|
About the Author: Trading coach, and author, Dr. Van K. Tharp is widely recognized for his best-selling books and his outstanding Peak Performance Home Study program - a highly regarded classic that is suitable for all levels of traders and investors. You can learn more about Van Tharp www.vantharp.com.
|
|
|
|
|
|
|
|
|
A Quick Peek at What You Can Expect in Our
Advanced Adaptive Swing Trading Class This April 27-29
|
|
We strive to make our 3-day residential workshop as productive as possible by conducting extensive prep work and Q&A sessions through the web. This helps us master the baseline material in order to focus on specific and more advanced techniques in our workshop.
This link goes to a quick video lesson that highlights some of the most important concepts we cover in the workshop, namely the important relationship between longer-term and shorter-term swing trading, and in some cases targeted intraday trading on hourly charts. It is typical of the many video lessons we use to prepare for a productive workshop! — Instructor Ken Long
|
|
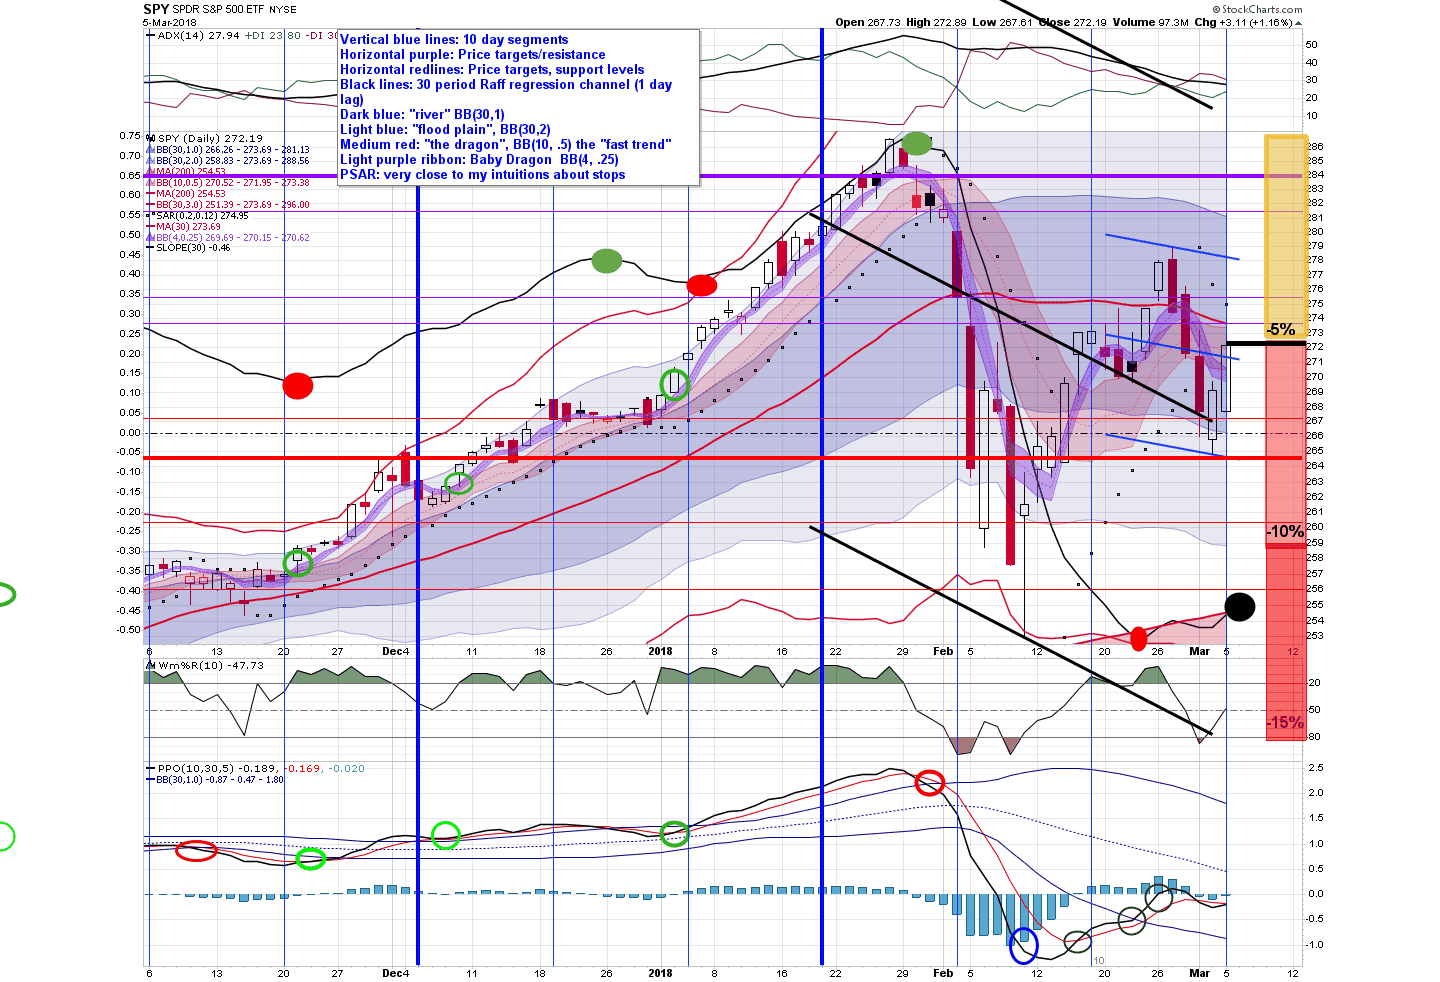
Daily Chart accompanying lesson
|
|
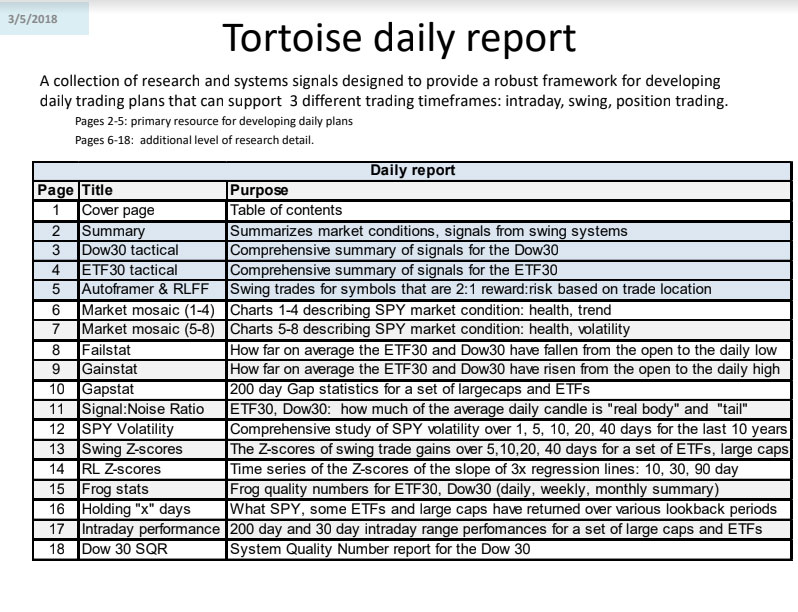
Download the PDF below for a collection of research and systems signals designed to provide a robust framework for developing daily trading plans that can support 3 different trading timeframes: intraday, swing, position trading.
Pages 2‐5: Primary resource for developing daily plans.
Pages 6‐18: Additional level of research detail.
|
|
|
|
Back to a More Normal “Normal”
by D. R. Barton, Jr.
|
|
|
|
|
Always beware “The New Normal.”
While some internet outlets would have us believe the term, “New Normal” harkens backs to the end of the 2007-2009 financial crisis, it’s a term that’s been around much longer. Dot.com stocks were the “New Normal” in the late 1990’s — companies with no revenue and outlandish valuations were the norm. Cries of, “It’s different this time…” were heard far and wide — until the dot.com bubble burst.
Buying a million-dollar home on a “no documents” mortgage was the “New Normal” in 2006.
And historically low volatility for years on end was the “New Normal” in 2017 — until that bubble also burst when those betting that the trend would continue lost their shirts (and maybe more), in the first full week of trading in February 2018.
Thankfully, the neck-snapping intraday market reversals that characterized the first half of February have slowed for the past week and a half.
And while volatility hasn’t returned to all-time low levels (it won’t even have that chance for many months), it has returned to a more normal, “normal.”
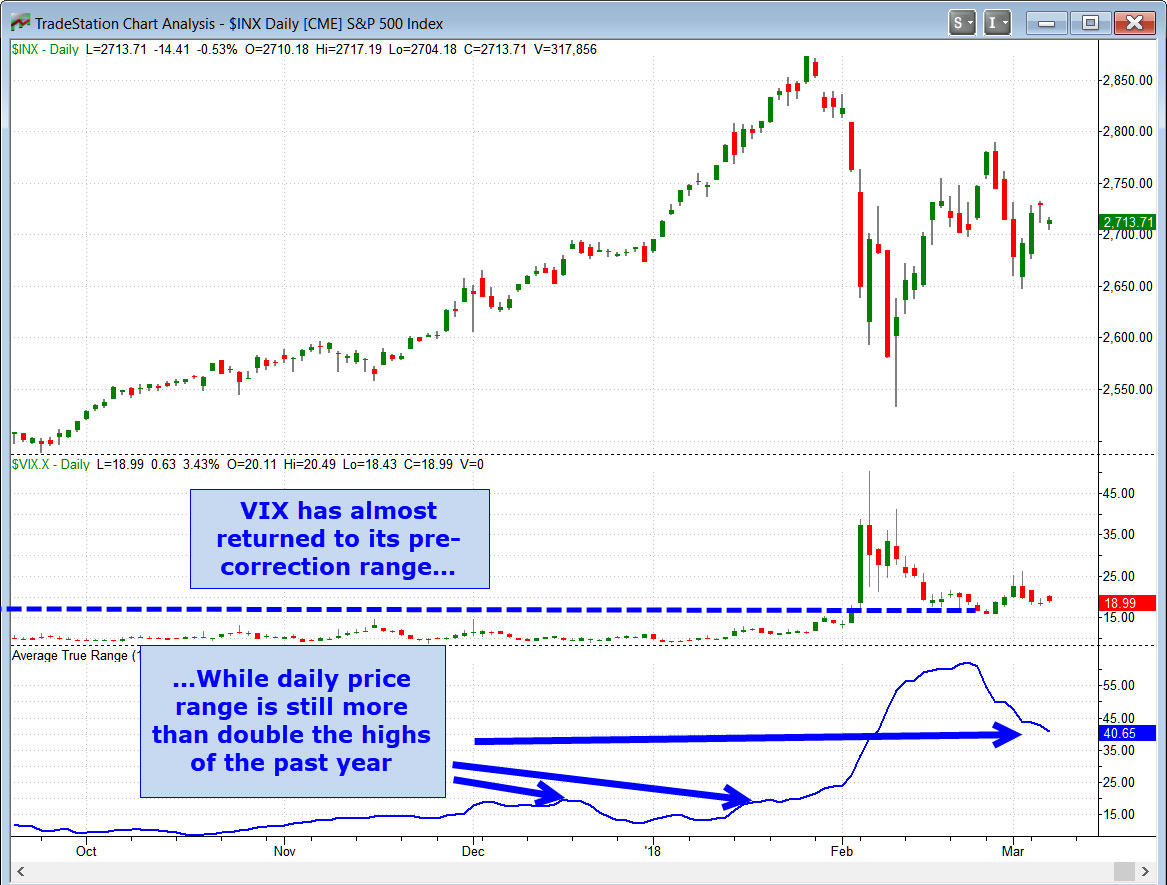
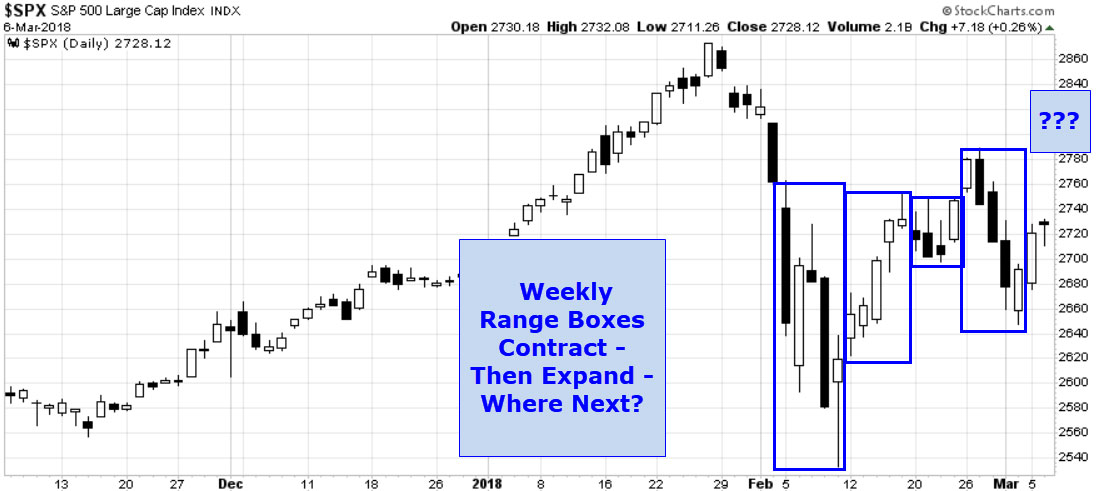
This chart is a good visual representation of the changing volatility over the past four plus weeks:
|
|
|
Last week’s “trade war” talk brought new volatility into the market. Yet the bulls seemed to regain short-term control — again.
So our volatility is lower, but not as low as it was — far from it. And this higher level of volatility will likely be with us for months to come.
And while some pundits are pointing to the fact that the VIX volatility index has reduced significantly, the true price volatility remains at an elevated state:
|
|
In general, a modestly elevated level of volatility is good for shorter-term trading. It means bigger moves. This more normal “normal” — a volatility level that’s not at all-time lows — will give us some great extremes to trade — even in intraday time frames.
But for intermediate term and long term traders, it’s too soon to tighten up your stops just yet…
Your thoughts and comments are always welcome — please send them to drbarton “at” vantharp.com
Great Trading,
D. R.
|
|
|
|
|
|
About the Author: A passion for the systematic approach to the markets and lifelong love of teaching and learning have propelled D.R. Barton, Jr. to the top of the investment and trading arena. He is a regularly featured analyst on Fox Business' Varney & Co. TV show (catch him most Thursdays between 12:30 and 12:45), on Bloomberg Radio Taking Stock and MarketWatch's Money Life Show. He is also a frequent guest analyst on CNBC's Closing Bell, WTOP News Radio in Washington, D.C., and has been a guest on China Central Television - America and Canada's Business News Network. His articles have appeared on SmartMoney.com MarketWatch.com and Financial Advisor magazine. You may contact D.R. at "drbarton" at
"vantharp.com".
|
|
|
|
|
|
|
|
|
|
|
April 14-15
Saturday-Sunday
|
|
|
|
|
|
|
|
Participating in the Oneness Awakening Course is an extraordinary opportunity to benefit from some of the important journeys Dr. Tharp has taken to transform his life.
The course has become a fundamental tool in Dr. Tharp's mission to help his clients succeed. Don't miss a chance to learn more about how you can become more aware, positive, calm, centered, and successful. Plus, this is one of the few courses in which you can apply for Super Trader Program after completion.
Following this weekend training, traders can expect to naturally become more aware, positive, calm, and centered. By extension, they will also experience a shift in how they perceive the market. When a trader sees the market as it really is, rather than what they want to see, the act of trading becomes more relaxed and they become more confident and successful. Does this sound like the type of experience you want trading to be?
While this two-day course is not a technical course about trading, we have seen amazing results in the traders who experience the benefits of being more 'awake' and aware, calmer and more centered. Why? Because the person themselves are always the primary instrument, even before the technical skills of trading are engaged. Just like the athlete with impressive skills, traders can also utilize the phenomenon of tapping into their awareness to achieve premium results. Keen awareness, in turn, opens up new possibilities. Another great thing about the concepts and experiences in this course is that they have benefits that apply throughout students' lives, not just in their trading endeavors. Time and time
again, traders tell us that their trading improved after taking this course, but also their personal lives as well!
|

|
|
Attend the NEW Futures Trading Systems with 3 all new systems,
plus several advanced swing systems in Ken Long's
Adaptive Swing Systems workshop!
|
|
|
|
Presented by Gabriel Grammatidis
|
|
|
|
April 21-23
Saturday-Monday
Brief description available now. More info coming soon.
|
|
|
|
|
|
|
|
Presented by Gabriel Grammatidis
|
|
|
|
April 24-25
Tuesday- Wednesday
Registration open now. More info coming soon.
|
|
|
|
|
|
|
|
Do you remember the big swings up and down lasting over several months in metals and energies (such as precious metals and oil)? Why don’t you trade moves like these in your preferred timeframe at a time during the day that fits you? I have a strong belief that in these trending markets following the trend is key. Why? The stronger the trend the more counter-trend traders are attracted into the “Market Traps” that are set-up by the specific patterns of my three systems.
Getting stuck in any of the traps can be a very painful experience – benefiting from it is a lot more fun. Do not miss the big number of opportunities presenting themselves to you now and in the years to come. Take your trading to the next level! Join us for this three-day workshop and leave prepared to trade the system right away.
Plus, we will offer Two days of live Futures trading so you can trade the systems live!
|
|
|
|
April 27-29
Friday-Sunday
|
|
|
|
|
|
|
Check out Ken's 4-minute video referenced in our feature article today where he touches upon a variety of trading edges to consider.
In this new three-day workshop, Dr. Ken Long presents a series of advanced, adaptive trading systems that work well in the swing period holding timeframe — from two days to two weeks.
In addition to the robust seven patterns found in the RL Framework, Ken will also teach at least three other swing trading systems:
MaxPain Range Compression System
In any given two-week period, some stocks and ETFs will be down. If you compare all of the issues that are down, some of them are down more than others. These are the issues with “max pain”. Of that max pain group, some of them are very near their 10 day lows — they have not yet started to recover. These are the ones who have range compression. MPRC symbols have a higher probability of popping than other groups and Ken has effective and simple ways to take advantage of these situations.
Autoframer System
For this system, Ken starts with the assumption that every symbol has a reward to risk relationship with its 10 day high and 10 day low. The potential long reward is the distance from its current price to its 10 day high and the risk is the distance from its current price to its 10 day low. Ken will stalk very closely those symbols with the greatest reward to risk ratio within those parameters. That idea is so simple that you might not think this system would work well but if you thought that, you would miss out on nearly daily opportunities.
Daily Squeeze Play System
While prices do not move reliably in a cyclical pattern, volatility tends to move much more cyclically. Periods of low volatility are typically followed by periods of high volatility. With an effective way to find symbols that have had low volatility recently, Ken has developed an effective system that captures those volatile moves out of the narrow price ranges.
|
|
|
|
Presented by Van Tharp
with co-presenter RJ Hixson
|
|
|
|
|
|
|
|
|
Presented by Van Tharp
and RJ Hixson
|
|
|
|
May 22-24
Tuesday-Thursday
|
|
|
|
|
|
|
|
|
|
CryptoCurrency Trading - Super Trader Exclusive
Presented by Van Tharp
|
|
|
|
June 19-21
Tuesday-Thursday
|
|
|
|
|
|
|
|
Options Trading
Presented by Chuck Whitman
|
|
|
|
June 23-25
Saturday-Monday
|
|
|
|
|
|
|
|
Options Trading Advanced
Presented by Chuck Whitman
|
|
|
|
June 27-28
Wednesday-Thursday
|
|
|
|
|
|
|
|
|
|
Presented by Van Tharp
with co-presenter RJ Hixson
|
|
|
|
|
|
|
|
|
|
|
July 17-19
Tuesday-Thursday
|
|
|
|
|
|
|
|
|
|
Presented by Kim Andersson
Profit When Price Goes Nowhere: How to Successfully Trade Sideways Markets In Every Time Frame
|
|
|
|
August 17-19
Friday-Sunday
|
|
|
|
|
|
|
|
|
|
Presented by R. J. Hixson
|
|
|
|
September 14-16
Friday-Sunday
|
|
|
|
|
|
|
|
Presented by Libby Adams and RJ HIxson
|
|
|
|
September 18-21
Tuesday-Friday
|
|
|
|
|
|
|
|
|
|
Presented by Van Tharp
with co-presenter RJ Hixson
|
|
|
|
October 12-14
Friday-Sunday
|
|
|
|
|
|
|
|
|
|
October 16-18
Tuesday-Thursday
|
|
|
|
|
|
|
|
Presented by Gabriel Grammatidis
|
|
|
|
October 20-22
Saturday-Monday
|
|
|
|
|
|
|
|
Presented by Gabriel Grammatidis
|
|
|
|
October 23-24
Tuesday-Wednesday
|
|
|
|
|
|
|
|
Presented by Van Tharp
and RJ Hixson
|
|
|
|
October 26-28
Friday-Sunday
|
|
|
|
|
|
|
|
|
|
|
|
November 9-11
Friday-Sunday
|
|
|
|
|
|
|
|
|
|
November 12-13
Monday-Tuesday
|
|
|
|
|
|
|
|
Exciting New Work from Van Tharp
|
|
|
|
November
15-17
Thursday-Saturday
|
|
|
|
|
|
|
|
|
|
FREE Book!
We pay for the book, you just pay for shipping.
When you add the free book to an item already being shipped there is generally no extra shipping charge (of course, depending on your location).
Read Van’s Latest Book —
TRADING BEYOND THE MATRIX
The Red Pill for Traders and Investors
Eleven traders tell their stories about transforming
their trading results and lives, in this 400 plus page book.
Below is a brief video on how powerful this book is to traders.
|
|
|
|
Cary, NC Workshop Information
For a list of nearby hotels for our Cary, North Carolina locations,
click here.
Book your flight arriving to the Raleigh-Durham International Airport (RDU).
When traveling to a three-day course, it's best to arrive the evening before.
To help determine your arrival and departure times, see:
Questions? Click Here to Ask Van...
CONTACT US
This is a supplement to our subscription based newsletter, Tharp's Thoughts.
800-385-4486 * 919-466-0043 * Fax 919-466-0408
|
|
|
|
|