|
You have an extra week to get your $700 discount for Infinite Wealth in Australia!
|
|
|
|
|
|
Tharp's Thoughts
Inbox Mentoring
|
|
|
|
|
|
|
|
-
Feature: February 2018 Market Update:
Bull Volatile Market Type,
by Van K. Tharp, Ph.D.
-
Workshops: Ken Long Returns with Advanced Adaptive Trade Systems in April, Cary NC
-
Tips: February 2018 System Quality Number ® Report,
by Van K. Tharp, Ph.D.
-
|
|
REGISTER NOW FOR AUSTRALIA WORKSHOPS!
|
|
You only have TODAY to get $700 off on Peak Performance 101 and How to Develop a Winning Trading System! However, you have an EXTRA WEEK to register for Infinite Wealth at the early bird discount price! Don't miss your chance to meet Van in person and learn in 3 of his most popular workshops this March in Australia. Don't delay, seats tend to fill up quickly before the discount expires.
|
|
|
|
February 2018 Market Update:
Bull Volatile Market Type
by Van K. Tharp, Ph.D.
|
|
|
|
|
I always say that people do not trade the markets; they trade their beliefs about the markets. In that same way, I'd like to point out that these updates reflect my beliefs. I find the market update information useful for my trading, so I do the work each month and am happy to share that information with my readers. If your beliefs are not similar to mine, however, then this information may not be useful to you. Thus, if you are inclined to go through some sort of intellectual exercise to prove one of my beliefs wrong, simply remember that everyone can usually find lots of evidence to support their beliefs and refute others. Simply know that I admit that these are my beliefs and that your beliefs might be
different.
These monthly updates are in the first issue of Tharp's Thoughts each month which allows us to get the closing data from the previous month. These updates cover 1) the market type (first mentioned in the April 30, 2008 edition of Tharp's Thoughts), 2) the debt statistics for the US, 3) the five-week status on each of the major US stock market indices, 4) our four-star inflation-deflation model, and 5) tracking the US dollar. I also write a report on the strongest and weakest areas of the overall market as a separate SQN™ Report. Significant market changes may mean the SQN Report comes out more than once a month.
Part I: The Big Picture
We've had a bull market type for a long time now. The equity markets finished last year in Strong Bull Quiet mode — and continued in that market type into January. Did that mean it would continue? No, it’s pretty much like a trend in that you never know when it will stop. But it has continued for a long time and had you invested appropriately you would have reaped large rewards.
The market update at the beginning of February was one of the longest, strongest pictures I’ve seen so it’s now time for at least a pause. At the end of January, the market started a two week correction and it partly recovered in the last two weeks of February. We are in a Bull market type but volatility has come back into the picture.
|
|
|
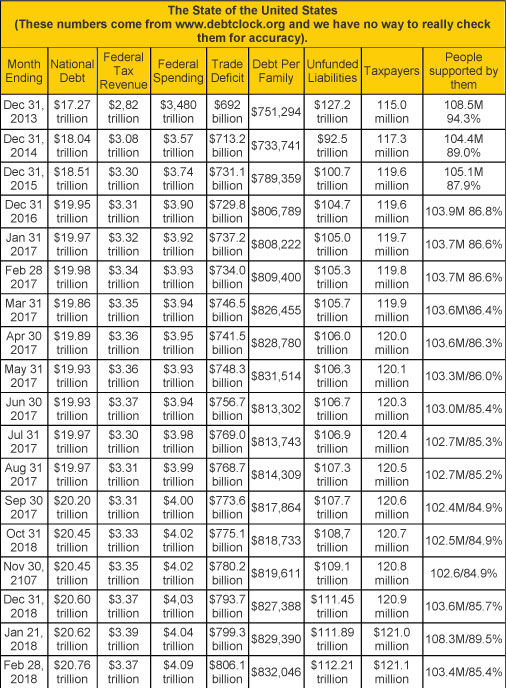
The US National Debt finally surpassed $20 trillion last September and has zoomed to $20.76 trillion. Federal spending is now listed at $4 trillion for the last six months. Right now there are 23.7 million government employees in the US which is actually up a little bit from the time Trump took office. Trump just fires his own people in the white house, not government employees.
Currently there are 121.1 million taxpayers supporting themselves and another 103.4 million people. Here I’m counting retirees, disabled, and Food stamp recipients, however, the US debt clock lists 165.7 million people receiving some sort of benefit. I had to take social security last year, so I guess I’m one of them.
Part II: The Current Stock Market Type Is Bull Volatile
The market was Bull Quiet or Strong Bull Quiet for most of 2017. And at the end of the year, the four Market SQN scores from 200 days to 25 days were all in the Strong Bull range. In late January, the Market SQN for the S&P 500 reached 4.02 — as high as I’ve seen it. Perhaps that was a sign that it was bound to come down. At the end of February, the Market SQN score is now only 0.78 — in the Bull range but almost Neutral.
At the end of February, the Market SQN scores for the 200 day period and 100 day period are both Bull — but barely. The 50 day Market SQN score is Neutral and the 25 day score is Bear. That’s actually a good picture of what happened in February. Also in January, the S&P 500 had 14 new all-time highs. In February, there were none.
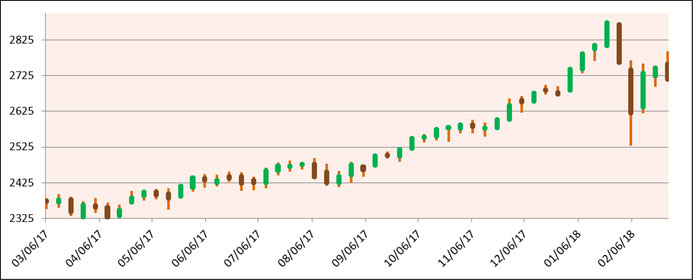
The first graph shows the S&P 500 in weekly bars over the last year so it is easy to see bull market and the February pullback.
|
|
|
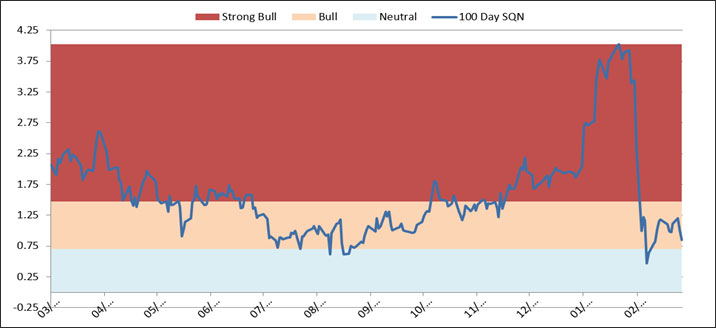
Here is the market type directional graph. It changed from a definite Strong Bull and in just a few weeks actually reached Neutral territory. Right now, it’s just in Bull territory.
|
|
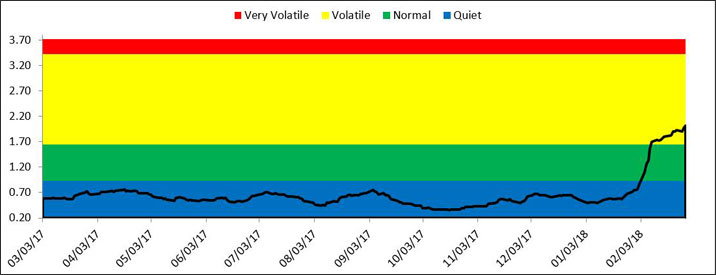
Last month I commented: “this volatility is so quiet that I had to change the axis to go below 0.5 in order to show the line (now at 0.41) This is not the climate out of which bear markets arrive.” The graph below, however, shows the new volatility in the market that zoomed through Normal range and into Volatile range in February. If volatility stays in Volatile (yellow range), then there could be reason to worry about this bull market continuing.
|
|
|
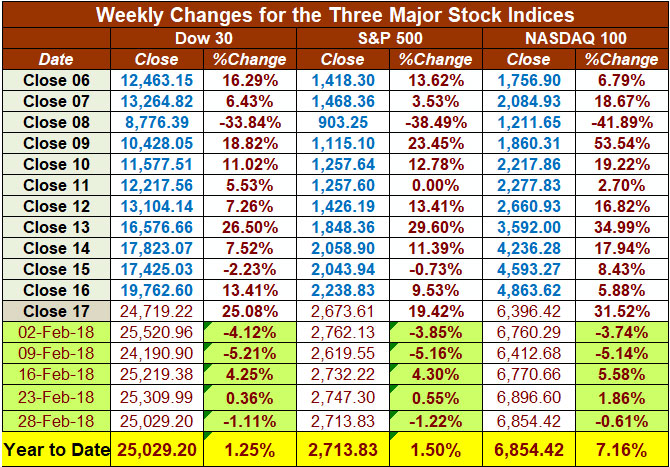
The table below reports the three major US Equity Indices levels. All three indices are still up for the year but February was a down month. So we are starting to see some negativity creeping into the market. Hopefully, you have caught all of that and please don’t say, “This market scares me.” We’ve had major tax changes which are good for the economy and whether or not you think those changes are fair, the market is how you can capitalize. Contrast 5%+ gains with what people are earning in their savings accounts or what those who are predicting a bear market and sitting on the sidelines are making.
|
|
Part III: Our Four-Star Inflation-Deflation Model
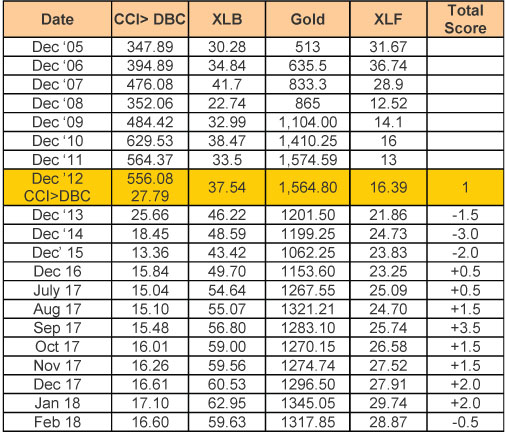
Over the last six months, commodities and basic materials are up (inflationary) while gold is flat and financials are also up (both deflationary). See the historical numbers for previous years and the monthly figures for the last year below.
|
|

|
|
Our model showed inflation for the past 8 months but suddenly, it has dipped down with a deflation score.
I took a look at the shadowstat.com data and noticed that the inflation rate — based upon how the CPI was calculated in 1980s — still shows an inflation rate close to 10%. Also according to shadowstats.com, we’ve been in a recession since 2000 — for 17.5 years.
Part IV: Tracking the Dollar
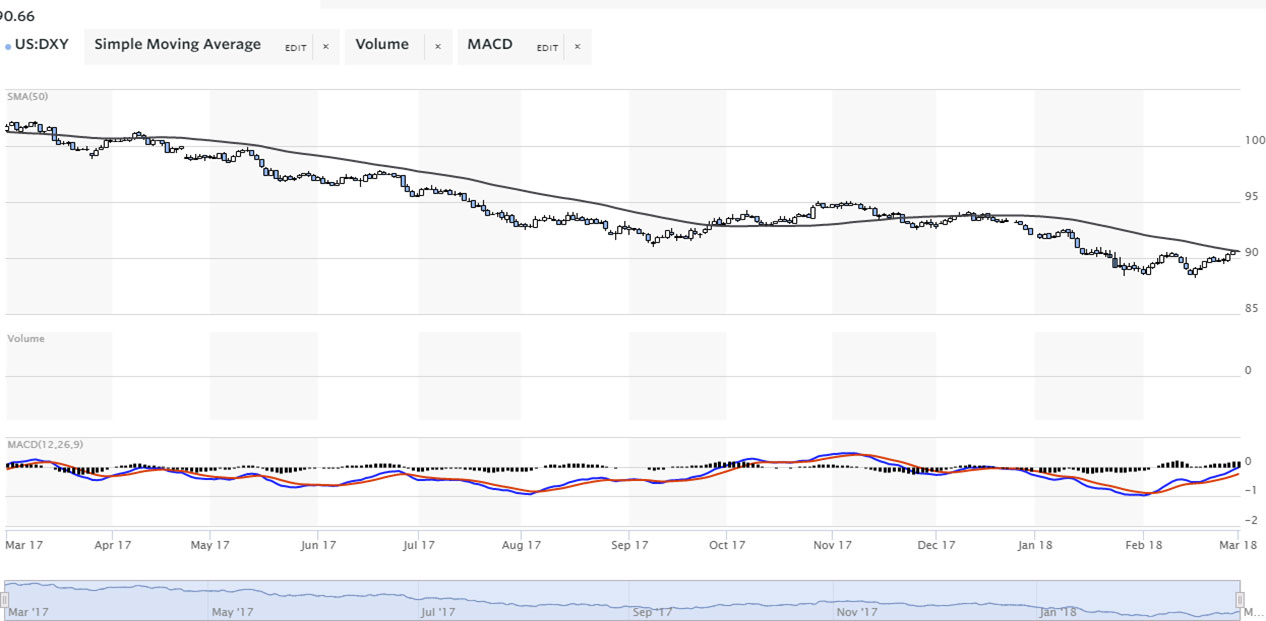
The dollar more or less went down throughout all of 2017 and it also went down for the first two months of 2018. Perhaps this is a Trump phenomenon. If you are a US citizen, notice that the dollar is down about 10% in the last year. If all of your wealth is in US Dollar based assets, then your net worth went down 10%. This makes the big gains in the stock market about half as impressive as they seem. In addition, the dollar went down enough in January to wipe out most of the stock market gains you thought you made. If you were “safely” in cash in January, well, your net worth dropped 5% just last month. I’m going to Australia on Monday so look for the Tharp effect to happen — when the US Dollar goes down and the local currency goes up while I
travel. The Aussie dollar is at 0.77 US Dollars right now so look for a rally there. (This is a joke not a prediction — but watch it happen).
|
|
|
Conclusion
Last month I said that equities were in a Strong Bull Quiet market type. The market type was as strong as I’ve ever seen it. It was better than the late 1990s because there was much less volatility.
One month later, the market type has moved to Bull Volatile and has taken a major step toward possibly turning around. We are very close to Neutral (sideways) direction so we could easily see Bear Volatile next month.
Does the market type have to change any time soon? No. Will it change soon? Maybe. It will change sooner or later. When will we know? When it changes. Then why bother trying to figure out the market type if it doesn’t help you know what’s coming . . .
I monitor market type because it helps traders understand which kind of trading systems they should be using right now. In February, your bull quiet market type systems would not have done very well. But if you had shifted to systems that take advantage of volatility, you would have done fine. Rather than trying to predict what the market will do and trying to be proactive entering or exiting positions ahead of market moves, just know the market type and trade the appropriate systems.
What is the market doing right now? It’s Bull Volatile. Bull Quiet could resume but a transition to a sideways or bear market type is now equally possible — and with continued volatility, that could happen quickly.
Until next month, this is Van Tharp.
|
|
|
|
|
|
About the Author: Trading coach, and author, Dr. Van K. Tharp is widely recognized for his best-selling books and his outstanding Peak Performance Home Study program - a highly regarded classic that is suitable for all levels of traders and investors. You can learn more about Van Tharp www.vantharp.com.
|
|
|
|
|
|
|
|
|
Did You Miss The Offers Following Van's Cryptocurrencies Webinar?
Click on the image below to get coupon codes for additional discounts on upcoming workshops (including Sydney events which you can use in addition to the early bird discount).
|
|
|
|
February 2018 System Quality Number® Report
The SQN® Report
by Van K. Tharp, Ph.D.
|
|
|
|
|
There are numerous ETFs that track everything from countries, commodities, currencies and stock market indices to individual market sectors. ETFs provide a wonderfully easy way to discover what’s happening in the world markets. I apply a version of my System Quality Number® (SQN®) score to measure the relative performance of numerous markets in a world model.
The Market SQN score uses the daily percent change for input over a 100-day period. Typically, a Market SQN score over 1.47 is strongly bullish and a score below -0.7 is very weak. The following color codes help communicate the strengths and weaknesses of the ETFs in this report:
- Dark Green: ETFs with very strong Market SQN scores > 1.47
- Light Green: ETFs with strong Market SQN scores (0.70 to 1.47).
- Yellow: ETFs with slightly positive Market SQN scores (0 to 0.70). These are Neutral/Sideways
- Brown: ETFs with slightly negative Market SQN scores (0 to -0.7).
- Red: Very weak ETFs that earn negative Market SQN scores (< -0.7).
This is basically the same rating scale that we use for the Market SQN Score in the Market Update. The world market model spreadsheet report below contains a cross section of currently available ETFs; excluding inverse funds and leveraged funds. In short, it covers equity markets around the globe, major asset classes, equity market segments, industrial sectors, and major currencies.
World Market Summary — Equities & Currencies
Each month we look at the equities markets across the globe by segment, region, and sector.
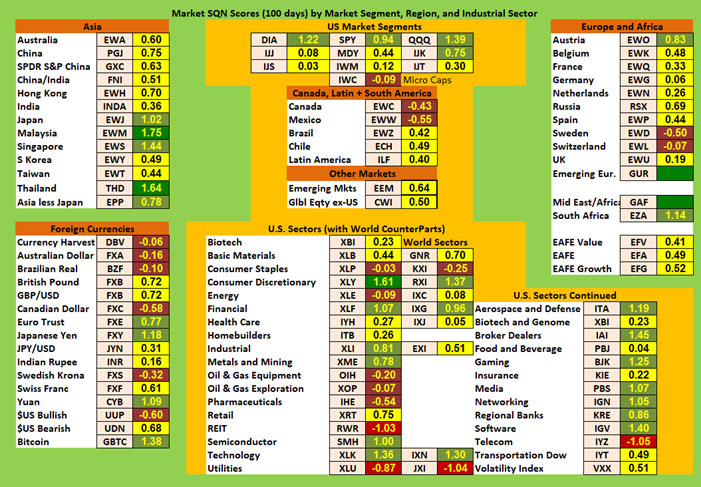
At the end of January, the US market segments looked amazing overall. The Dow had a Market SQN score of 4.5 and the S&P 500 had a score of 3.62 – both extremely high scores. But when scores reach that high, it’s crash time. At the end of February, the DOW Market SQN score is 1.22 and the S&P 500 is 0.94. Those are big changes but both are still light green. It’s important to note with the correction, the market was down for February but the market type is still in bull territory. Large caps are light green and the rest of the segments are yellow except for the microcaps which moved to brown.
The US Dollar continues to be weak. And since the entire world model is valued in the US Dollar, everything should be increasing relative to the dollar.
The other countries in the Americas are brown (Canada and Mexico) while Brazil, Chile, and Latin America are all yellow. Emerging markets are also yellow.
Asia is a mix of green and yellow but weaker overall than last month. Malaysia is dark green (1.75) as is Thailand (1.64). Japan and Singapore are light green while everything else in Asia is yellow.
Europe also became weaker. There are no dark green countries this month – against 5 of them last month. There is one light green – Austria. Sweden and Switzerland are both brown while everything else is yellow.
On the currencies side we have four light green currencies – the Euro, the Yen, the Yuan and Bitcoin (based on the closed end fund GBTC). Bitcoin is green despite being down 70% from its high because that drop was then followed by a 50% recovery. Still, it’s nowhere near its highs. The weakest currencies are the Brazilian Real, the US Dollar, the Canadian Dollar, the Swedish Krona, and Australian Dollar (but you can expect the Tharp effect and me going to Australia to change that this month). All of them are brown.
In the market sectors at the end of January, we had numerous areas with Market SQN scores over 3.0. Not this month. There is only one dark green (Consumer Discretionary) but there are still a number of light green sectors including Financials, Industrial, Metals and Mining, Semiconductors, Technology, Aerospace and Defense, Broker Dealers, Gaming, Media, Networking, Regional Banks, and Software.
On the weak side, Utilities, Telecom, and REITs are red. Consumer Staples, Energy, Oil and Gas Equipment, Oil and Gas Exploration, and Pharmaceuticals are all brown. Last month’s fantasy world has disappeared. But perhaps really high SQN scores indicate some sort of potential reversal. Volatility was about the worst sector (red) last month and it has now gone to yellow.
|
|
|
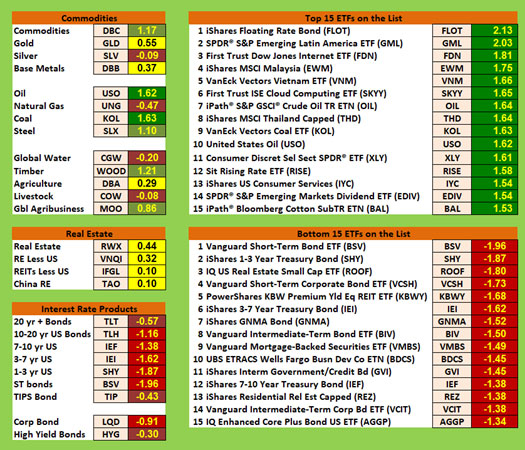
Commodities, Real Estate, Debt, and the Top and Bottom Lists
Commodities are a mixed bunch again. Oil and Coal are still dark green. Commodities, Steel, Timber, and Global Agribusiness are all light green. Steel is light green. Silver, Natural Gas, Global Water, and Livestock are all brown. There are no red commodities.
Interest rates still look terrible. All of them are brown or red.
|
|
|
Real estate in mostly neutral with the US again being stronger than China. As I mentioned last month, in my area of the country inexpensive houses have increased in price a lot while expensive house prices have hardly moved. Our old house will probably be on the market in the late spring or early summer and we hope it sells quickly and acts as an exception to expensive houses taking a long time to sell.
Looking at the strongest ETF list, we only have 2 that are above 2.0 (whereas last month most were above 3.0), however, the strongest are all dark green. In the weakest sectors, nothing is below minus 2.0, but the 15 weakest are all red.
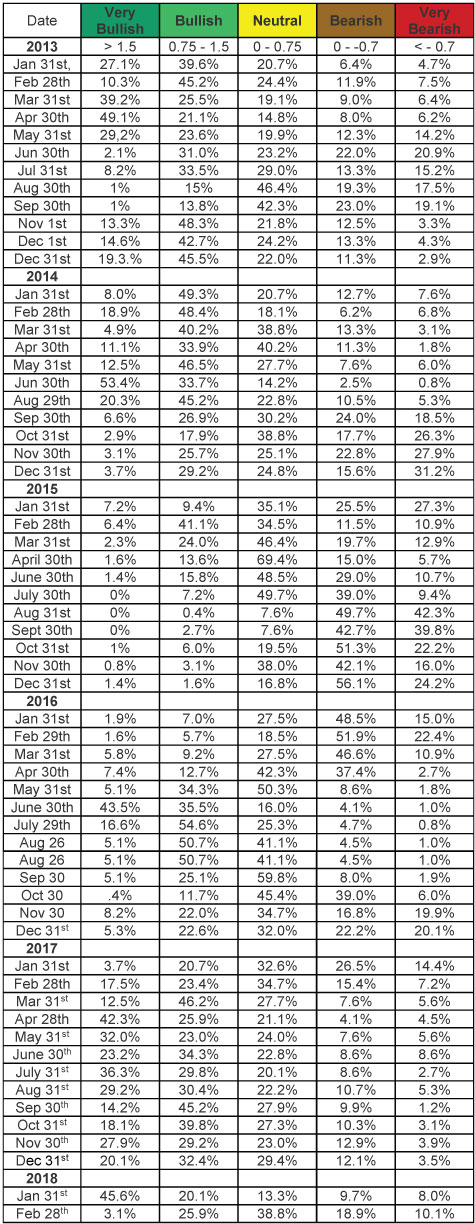
Summary
Let’s look at the summary table which measures the percentage of ETFs in each of the strength categories. You can see the distribution of the database by Market SQN score in bullish, neutral and bearish categories just below with the Feb 28th figures at the bottom of the table —
|
|
|
Last month 45.6% of our ETFs were in the strong bull category and 65.7% of the ETFs had bullish scores. In one month, those figures fell to 3.1% strong bull and 29% bullish scores. That was quite a change. We’re either in a correction or a transition.
Be careful to base your actions upon what IS happening, not what you think might happen. The markets always offer opportunities, but to capture those opportunities, you MUST know what you are doing. If you want to trade these markets, you need to approach them as a trader, not a long-term investor. We’d like to help you learn how to trade professionally because trying to navigate the markets without an education is hazardous to your wealth. All the beliefs given in this update are my own. Though I find them useful, you may not. You can only trade your own beliefs about the markets.
Until next month this is Van Tharp.
|
|
|
|
March 2018 - Sydney, Australia
$700 Early Bird Discounts Expire Today! (except for Infinite Wealth)
|
|
|
|
Presented by Van Tharp
with co-presenter RJ Hixson
|
|
|
|
|
|
|
|
|
Do You Answer Yes To Any Of These Peak Performance Questions?
Peak Performance 101 not only helps you implement Dr. Tharp’s model for peak performance trading, it also helps you overcome self-sabotage. You’ll be able to free yourself from internal conflicts that keep you from performing at a peak level. For example:
- Are you always looking for a new trading system? Or, are you always trying to improve the one you have?
- Do you find your trade setups never quite fit all of the personal criteria you need, so you have trouble entering trades?
- Do you get anxious about the market or about risking your money, so that you have trouble pulling the trigger?
- Do you get excited about the market, or do you get distracted and fail to follow your system's rules?
- Does a losing trade take your energy away for the next trade, or conversely, does a winning trade make you confident about the next trade?
- Is your trading (or your life) ruled by the "negative" emotions of fear, anger, or greed?
- Are you constantly losing money because you don’t have a strong plan to guide your trading, or because you simply don't follow the plan you created?
- Do you have a performance ceiling where you fall apart or stop doing well? Do you earn $100,000 and then just seem to stop trading? Or, do you reach the million-dollar plateau and then start losing heavily?
If you answer "Yes" to any of these, then this is the workshop for you.
|
|
Presented by RJ Hixson
and Van Tharp
|
|
|
|
March 13-15
Tuesday-Thursday
|
|
|
|
|
|
|
|
Do you want bigger and more consistent profits from the market?
If you want consistency and would like to make profits from the market, you'll want to attend this three-day workshop. We'll show you little-known, closely guarded secrets that you're not likely to find unless you accidentally stumble upon them yourself.
Are you a low-risk investor who just wants to make small, consistent profits each month with only an occasional loss? We can show you how to develop a system that will allow you to develop a unique methodology that will give you that kind of consistency!
Are you a gutsy trader who'd like to make yearly profits of 100%, 200% or even 1,000% per year? Although risky, it is possible, and we can show you how to do it! The interesting thing is that you can do it in such a way that the only money you're risking is the money you've already made from the market. That's real leverage!
|
|
|
|
March 23-25
Friday-Sunday
|
|
|
|
|
|
|
|
|
|
You still have until next week, March 7th, to get your $700 Early Bird Discount!
What You Will Get In This Course
Beginning on Day 1, you’ll learn what the real Wealth Game is and, more importantly, what it isn’t. You will discover:
- Who decides the rules in the wealth game
- What money really is and why it doesn’t even matter
- What is holding you back from creating infinite wealth in your own life
- How different people think about money and why it matters
- The single greatest method for infusing positive beliefs about wealth into your being
- How to achieve infinite wealth in 7 simple steps
We’ll finish the day by playing a game that’s designed to get you thinking about the game of wealth in a much different way and to look at your patterns of behavior when it comes to money. You’ll learn more about yourself…your beliefs about money, and what’s possible (or not) just by playing this game.
On Day 2, we’ll start with a quick review before I share with you the exact same steps I took to create infinite wealth for my family and myself. You will learn how to model my success and achieve real freedom for yourself. We begin by discovering how to:
- Become debt-free in less than 7 years, including your home, cars, credit card debt, student loan debt and more, all on your current income
- “See yourself” infinitely wealthy with the same visualization techniques my Super Traders use
- Invest in yourself to increase your income by 1000%
- Use tax expectancy to your advantage as a trader and investor
- Create inner wealth to achieve the freedom you seek
At the end of the day, we’ll again play the game to reinforce new wealth-building concepts while continuing to think of infinite wealth as a game to be played.
Day 3 begins with a review of the previous day’s notes and discoveries before we cover more in- depth inner work. Before you leave the workshop, you will know how to:
- Overcome your weaknesses while fostering your strengths with SWOT analysis
- Come back from a set-back, all with a unique mental resilience tool
- Begin each day with a clear intention, simply by removing your limiting money beliefs
- Use the matrix model to achieve infinite wealth
- Get your life purpose in alignment with your financial goals
|
|
|
|
|
|
April 14-15
Saturday-Sunday
|
|
|
|
|
|
|
|
Participating in the Oneness Awakening Course is an extraordinary opportunity to benefit from some of the important journeys Dr. Tharp has taken to transform his life.
The course has become a fundamental tool in Dr. Tharp's mission to help his clients succeed. Don't miss a chance to learn more about how you can become more aware, positive, calm, centered, and successful. Plus, this is one of the few courses in which you can apply for Super Trader Program after completion.
|
|
Attend the NEW Futures Trading Systems with 3 all new systems,
plus several advanced swing systems in Ken Long's
Adaptive Swing Systems workshop!
|
|
|
|
Presented by Gabriel Grammatidis
|
|
|
|
April 21-23
Saturday-Monday
Brief description available now. More info coming soon.
|
|
|
|
|
|
|
|
Presented by Gabriel Grammatidis
|
|
|
|
April 24-25
Tuesday- Wednesday
Registration open now. More info coming soon.
|
|
|
|
|
|
|
|
Do you remember the big swings up and down lasting over several months in metals and energies (such as precious metals and oil)? Why don’t you trade moves like these in your preferred timeframe at a time during the day that fits you? I have a strong belief that in these trending markets following the trend is key. Why? The stronger the trend the more counter-trend traders are attracted into the “Market Traps” that are set-up by the specific patterns of my three systems.
Getting stuck in any of the traps can be a very painful experience – benefiting from it is a lot more fun. Do not miss the big number of opportunities presenting themselves to you now and in the years to come. Take your trading to the next level! Join us for this three-day workshop and leave prepared to trade the system right away.
Plus, we will offer Two days of live Futures trading so you can trade the systems live!
|
|
|
|
April 27-29
Friday-Sunday
|
|
|
|
|
|
|
Check out Ken's 4-minute video referenced in our feature article today where he touches upon a variety of trading edges to consider.
In this new three-day workshop, Dr. Ken Long presents a series of advanced, adaptive trading systems that work well in the swing period holding timeframe — from two days to two weeks.
In addition to the robust seven patterns found in the RL Framework, Ken will also teach at least three other swing trading systems:
MaxPain Range Compression System
In any given two-week period, some stocks and ETFs will be down. If you compare all of the issues that are down, some of them are down more than others. These are the issues with “max pain”. Of that max pain group, some of them are very near their 10 day lows — they have not yet started to recover. These are the ones who have range compression. MPRC symbols have a higher probability of popping than other groups and Ken has effective and simple ways to take advantage of these situations.
Autoframer System
For this system, Ken starts with the assumption that every symbol has a reward to risk relationship with its 10 day high and 10 day low. The potential long reward is the distance from its current price to its 10 day high and the risk is the distance from its current price to its 10 day low. Ken will stalk very closely those symbols with the greatest reward to risk ratio within those parameters. That idea is so simple that you might not think this system would work well but if you thought that, you would miss out on nearly daily opportunities.
Daily Squeeze Play System
While prices do not move reliably in a cyclical pattern, volatility tends to move much more cyclically. Periods of low volatility are typically followed by periods of high volatility. With an effective way to find symbols that have had low volatility recently, Ken has developed an effective system that captures those volatile moves out of the narrow price ranges.
|
|
|
|
Presented by Van Tharp
with co-presenter RJ Hixson
|
|
|
|
|
|
|
|
|
Presented by Van Tharp
and RJ Hixson
|
|
|
|
May 22-24
Tuesday-Thursday
|
|
|
|
|
|
|
|
|
|
CryptoCurrency Trading - Super Trader Exclusive
Presented by Van Tharp
|
|
|
|
June 19-21
Tuesday-Thursday
|
|
|
|
|
|
|
|
Options Trading
Presented by Chuck Whitman
|
|
|
|
June 23-25
Saturday-Monday
|
|
|
|
|
|
|
|
Options Trading Advanced
Presented by Chuck Whitman
|
|
|
|
June 27-28
Wednesday-Thursday
|
|
|
|
|
|
|
|
|
|
Presented by Van Tharp
with co-presenter RJ Hixson
|
|
|
|
|
|
|
|
|
|
|
July 17-19
Tuesday-Thursday
|
|
|
|
|
|
|
|
|
|
Presented by Kim Andersson
Profit When Price Goes Nowhere: How to Successfully Trade Sideways Markets In Every Time Frame
|
|
|
|
August 17-19
Friday-Sunday
|
|
|
|
|
|
|
|
|
|
Presented by R. J. Hixson
|
|
|
|
September 14-16
Friday-Sunday
|
|
|
|
|
|
|
|
Presented by Libby Adams and RJ HIxson
|
|
|
|
September 18-21
Tuesday-Friday
|
|
|
|
|
|
|
|
|
|
Presented by Van Tharp
with co-presenter RJ Hixson
|
|
|
|
October 12-14
Friday-Sunday
|
|
|
|
|
|
|
|
|
|
October 16-18
Tuesday-Thursday
|
|
|
|
|
|
|
|
Presented by Gabriel Grammatidis
|
|
|
|
October 20-22
Friday-Sunday
|
|
|
|
|
|
|
|
Presented by Gabriel Grammatidis
|
|
|
|
October 23-24
Tuesday-Wednesday
|
|
|
|
|
|
|
|
Presented by Van Tharp
and RJ Hixson
|
|
|
|
October 26-28
Friday-Sunday
|
|
|
|
|
|
|
|
|
|
Exciting New Work from Van Tharp
|
|
|
|
|
|
|
|
|
|
|
FREE Book!
We pay for the book, you just pay for shipping.
When you add the free book to an item already being shipped there is generally no extra shipping charge (of course, depending on your location).
Read Van’s Latest Book —
TRADING BEYOND THE MATRIX
The Red Pill for Traders and Investors
Eleven traders tell their stories about transforming
their trading results and lives, in this 400 plus page book.
Below is a brief video on how powerful this book is to traders.
|
|
|
|
Cary, NC Workshop Information
For a list of nearby hotels for our Cary, North Carolina locations,
click here.
Book your flight arriving to the Raleigh-Durham International Airport (RDU).
When traveling to a three-day course, it's best to arrive the evening before.
To help determine your arrival and departure times, see:
Questions? Click Here to Ask Van...
CONTACT US
If you no longer wish to receive our email updates, click the unsubscribe link in the bottom-left corner of this email.
This is a supplement to our subscription based newsletter, Tharp's Thoughts.
800-385-4486 * 919-466-0043 * Fax 919-466-0408
|
|
|
|
|