|
Dig into the numbers and stay up-to-date on current market type conditions.
|
|
|
|
|
|
Tharp's Thoughts
Inbox Mentoring
|
|
|
|
|
|
|
|
-
Feature: January 2017 Market Update:
Strong Bull Quiet Market Type,
by
Van K. Tharp, Ph.D.
-
Workshops: Our $700 Early Enrollment Discount Ends Next Week!
-
Tips: January 2018 System Quality Number ® Report, by Van K. Tharp, Ph.D.
-
|
|
DON'T WORRY, THERE'S STILL TIME TO GET THE $700 DISCOUNT! REGISTER TODAY.
|
|
Our mission at the Van Tharp Institute is to help people transform themselves, and the Peak Performance 101 Workshop is the key workshop we use to teach people how to do it.
If you learn how you control your trading results, you've accomplished something that will help you immensely, plus, this workshop is also a prerequisite to applying for our Super Trader Program.
Peak 101 and Blueprint for Trading Success are presented back-to-back in February. This is the only US presentation of Blueprint in 2018. We encourage you to take action now. These two workshops have the potential to change the way you trade, and as so many students report, the way you live your life even aside from trading. (Note: Peak Performance 101 will also be held in Sydney, Au in March). Attend both February workshops and save even more with the combo discount.
|
|
|
|
January 2017 Market Update:
Strong Bull Quiet Market Type
by Van K. Tharp, Ph.D.
|
|
|
|
|
I always say that people do not trade the markets; they trade their beliefs about the markets. In that same way, I'd like to point out that these updates reflect my beliefs. I find the market update information useful for my trading, so I do the work each month and am happy to share that information with my readers. If your beliefs are not similar to mine, however, then this information may not be useful to you. Thus, if you are inclined to go through some sort of intellectual exercise to prove one of my beliefs wrong, simply remember that everyone can usually find lots of evidence to support their beliefs and refute others. Simply know that I admit that these are my beliefs and that your beliefs might be
different.
These monthly updates are in the first issue of Tharp's Thoughts each month which allows us to get the closing data from the previous month. These updates cover 1) the market type (first mentioned in the April 30, 2008 edition of Tharp's Thoughts), 2) the debt statistics for the US, 3) the five-week status on each of the major US stock market indices, 4) our four-star inflation-deflation model, and 5) tracking the US dollar. I also write a report on the strongest and weakest areas of the overall market as a separate SQN™ Report. Significant market changes may mean the SQN Report comes out more than once a month.
Part I: The Big Picture
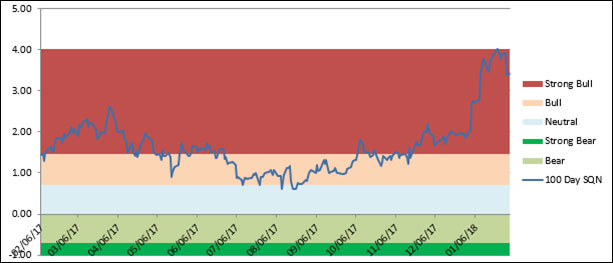
The equity markets finished the year in Strong Bull Quiet mode. The S&P has been in Bull or Strong Bull since early in the year. It’s been in this market type for a long, long time. And that is the value of market type. This is the kind of market that makes the average person look like a genius. And, of course, the average person is still afraid of the market although more and more people are entering it. There is very little interest, for example, in trading books. Our market type classification system is descriptive of today’s conditions, not predictive of tomorrows. It’s like a trend. You know the direction, but you don’t know whether it will continue tomorrow.
|
|
|
|
|
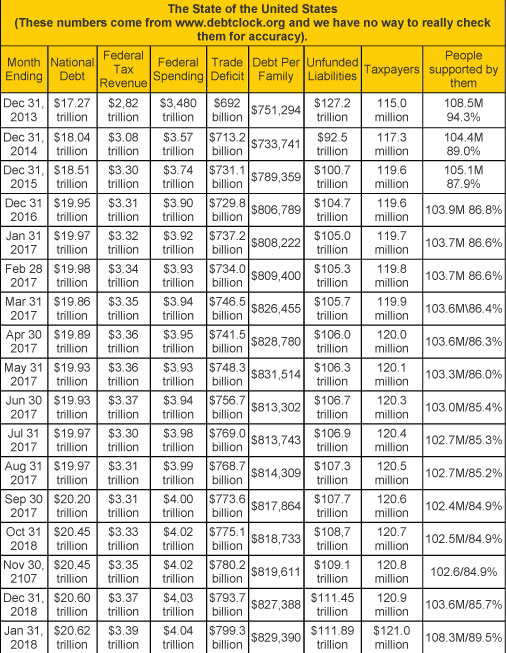
The US National Debt has finally surpassed $20 trillion and has zoomed to 20.62 trillion. Federal spending is now listed at 4 trillion dollars for the last five months. Trump just fires his own people in the white house, not government employees. Right now there are 23.7 Federal Employees which is actually up a little bit from the time Trump took office.
Currently, 121.0 million taxpayers supporting 108.3 other people. Here I’m counting retirees, disabled, and Food stamp recipients. However, the US debt clock lists 165.5 million people receiving some benefit. I had to take social security last year, so I guess I’m one of them.
Part II: The Current Stock Market Type Is Strong Bull Quiet
The market has been bull (or strong bull) quiet for most of 2017. And at the end of the year, all four SQN scores were strong bull quiet. It’s even stronger now. People should be fully invested in a modified buy and hold mode (i.e., 25% trailing stop on everything). This is about as good as it gets and if you are not up about 20% or more in your portfolio in 2017, something is wrong. And if you are not even in the market, something is really wrong. By the way, the SQN 100 on the S&P 500 is 3.43 right now. I’ve never seen it that high. I cannot imagine it will be that high next month, but that won’t mean that the bull market is over. Pay attention to what the
market is doing, not to what you think it might do.
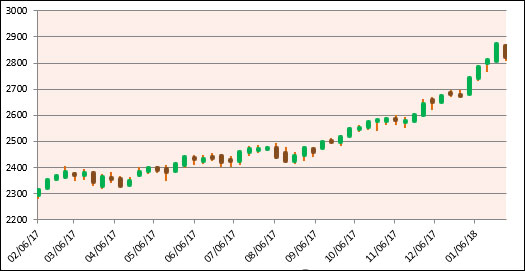
The first graph shows the S&P 500 in weekly bars over the last year, so it is easy to see the bull market. By the way, we have had a bull market type for a long time now. Does it mean it will continue? No, it’s pretty much like a trend in that you never know when it will stop. However, it has continued for a long time and had you invested appropriately you would have reaped large rewards. The last two months I have had to reformat the axis for this chart in excel because it didn’t go high enough.
|
|
|
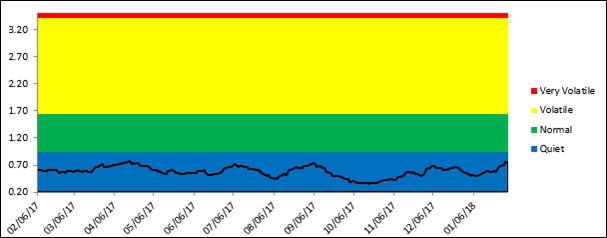
Furthermore, the S&P 500 14 all-time high days in the last month. And again, are you in this market or not? There is still no volatility to be worried about. That is not an atmosphere which should concern you.
|
|
This the volatility is so quiet that I had to change the axis to go below 0.5 in order to show the line (now at 0.41) This is not the climate out of which bear markets arrive.
|
|
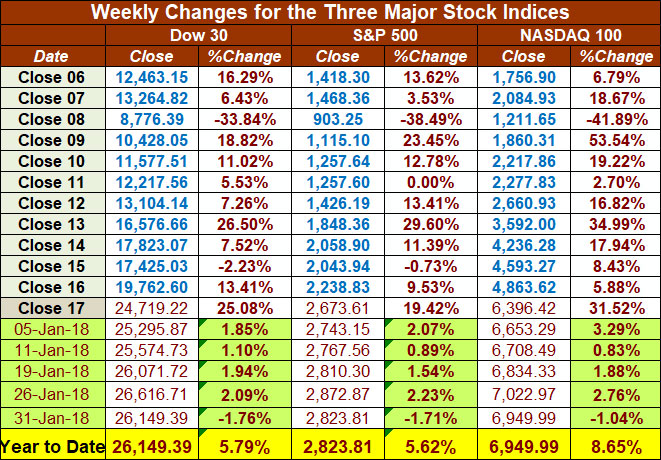
The table below reports the three major US Indices levels through the end of the year. And over the last month. All three indices are up over 5% for the month. Hopefully, you have caught all of that. Please say you do that and please don’t say this market scares you. We’ve had tax changes which are good for the market and whether or not you think the tax changes are fair, the market is how you can capitalize. Contrast those 5%+ gains with what people are earning in their savings accounts or what those who are predicting a bear market and sitting on the sidelines are making. What are you doing?
|
|
Part III: Our Four-Star Inflation-Deflation Model
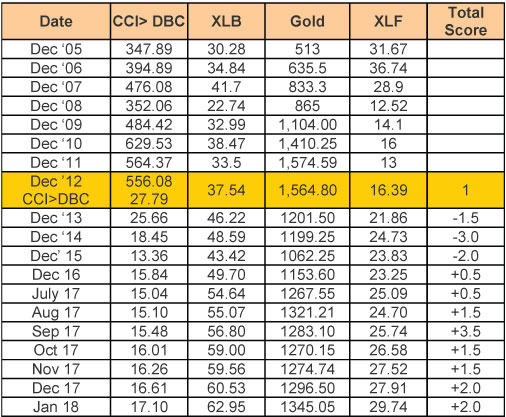
Gold and builders and commodities are up over the last six month which produces an inflationary model score. See the historical numbers for previous years and the monthly figures for the last year below.
|
|

|
|
Our model has shown signs of inflation for the past six months. As a result, I took a look at the shadowstat.com data and notice that the inflation rate, based upon how the CPI was calculated in 1980, still shows close to a 10% inflation rate.
Part IV: Tracking the Dollar
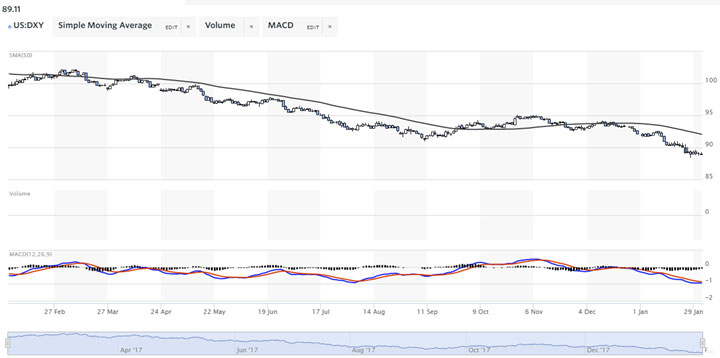
The dollar has more or less gone down throughout all of 2017. Perhaps it’s a Trump phenomenon. However, if you are a US citizen, notice that the dollar went down about 10% last year. If all of your wealth is in the US Dollar, then your net worth went down 10%. Moreover, it makes the big gains in the stock market about half as impressive as they seem. In addition, the dollar went down enough in January to wipe out most of the stock market gains you thought you made. And if you were in cash, well, your net worth went down 5% last month.
|
|
|
Conclusion
Today, equities are in a Strong Bull Quiet market type. The market type is as strong as I’ve ever seen it. It’s better than the late 1990s because there is much less volatility. Does the market type have to change anytime soon now that it has gone on so long? No. Will it change soon? Maybe. It will change sooner or later. When will we know? When it changes. Then why bother trying to figure out the market type if it doesn’t help you know what’s coming . . .
I monitor market type because it helps traders understand which kind of trading systems they should be using right now. Systems that perform well in a Bull Quiet market type should have been performing really well for most of the year — and right now. Bull Quiet type systems are relatively easy to design (think buy and hold with a trailing stop) but I would also encourage you to have trading systems for other market types. If the market were to switch to a Sideways Quiet type, you would stop using your Bull Quiet systems and start using your Sideways Quiet systems. Rather than trying to predict what the market will do and how to be proactive with your positions ahead of
the market, know the market type and trade the appropriate systems.
This approach makes a few assumptions —
- You have a market type classification system and you use it. My market type classification system works well for me but it may not fit you. If that’s the case, how would you go about describing and classifying market conditions? And you should really understand it and the implications of the meaning it is giving you.
- You understand trading systems. You know the parts, the purpose of each, and how they work together well. You understand the system’s edge and the beliefs behind it that enable the system to profit.
- You have a trading system development process and can develop one or more systems for each market type. Most people try to create a trading system that performs well all the time. If that’s what you have been trying to do, save your time and effort — focus on one particular set of market conditions per system.
- You trade one or more systems created for the current market type. (Some trading systems may perform best in one market type but will perform acceptably well in one or two other market types also.)
Look at the market type. What’s the market doing right now. It’s bull quiet. PERIOD.
Until next month, this is Van Tharp.
|
|
|
|
About the Author: Trading coach, and author, Dr. Van K. Tharp is widely recognized for his best-selling books and his outstanding Peak Performance Home Study program - a highly regarded classic that is suitable for all levels of traders and investors. You can learn more about Van Tharp www.vantharp.com.
|
|
|
|
|
|
|
|
|
Did You Miss The Cryptocurrencies Webinar?
|
|
|
|
January 2018 System Quality Number® Report
The SQN® Report
by Van K. Tharp, Ph.D.
|
|
|
|
|
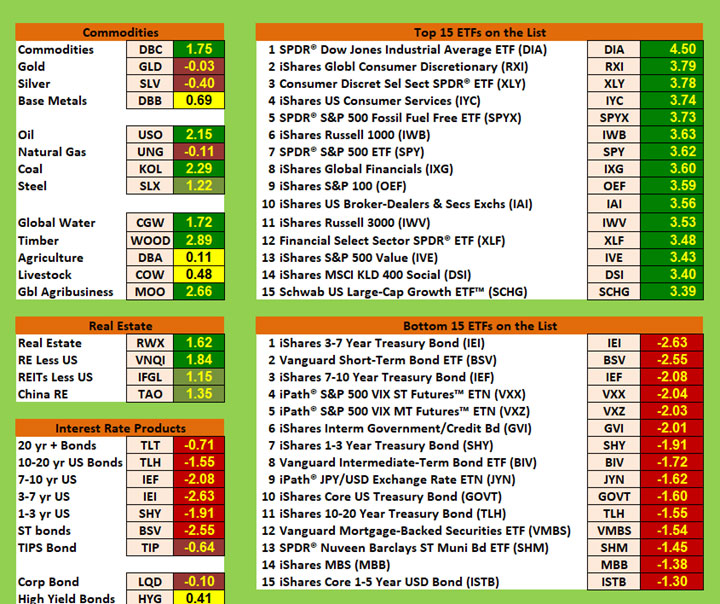
There are numerous ETFs that track everything from countries, commodities, currencies and stock market indices to individual market sectors. ETFs provide a wonderfully easy way to discover what’s happening in the world markets. I apply a version of my System Quality Number® (SQN®) score to measure the relative performance of numerous markets in a world model.
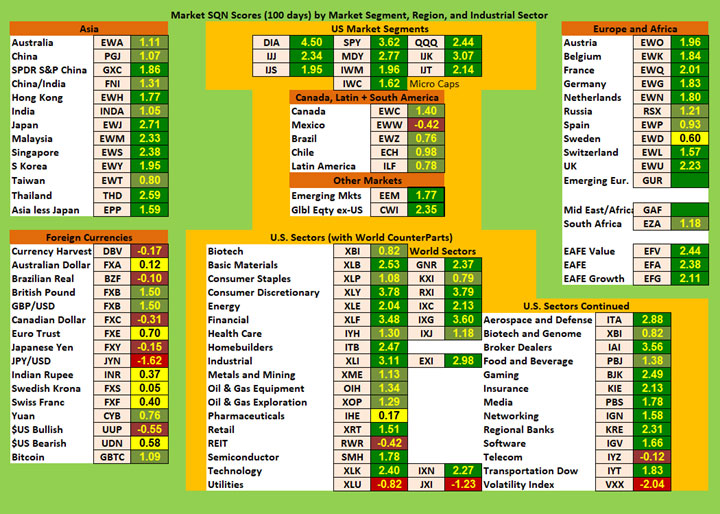
The Market SQN score uses the daily percent change for input over a 100-day period. Typically, a Market SQN score over 1.47 is strongly bullish, and a score below -0.7 is very weak. The following color codes help communicate the strengths and weaknesses of the ETFs in this report:
- Dark Green: ETFs with very strong Market SQN scores > 1.47
- Light Green: ETFs with strong Market SQN scores (0.70 to 1.47).
- Yellow: ETFs with slightly positive Market SQN scores (0 to 0.70). These are Neutral/Sideways
- Brown: ETFs with slightly negative Market SQN scores (0 to -0.7).
- Red: Very weak ETFs that earn negative Market SQN scores (< -0.7).
This is basically the same rating scale that we use for the Market SQN Score in the Market Update. The world market model spreadsheet report below contains a cross-section of currently available ETFs; excluding inverse funds and leveraged funds. In short, it covers equity markets around the globe, major asset classes, equity market segments, industrial sectors, and major currencies.
World Market Summary — Equities & Currencies
Each month we look at the equities markets across the globe by segment, region, and sector.
The US Dollar is still a weak currency. And since the world model is valued entirely in the US dollar, everything should be increasing relative to the dollar.
Overall, the US market segments look amazing. The Dow has an SQN of 4.5. I’ve never seen an index ETF that high before. And the S&P500 has an SQN of 3.62 — again extremely high. Investing in these indexes is like taking candy from a baby right now. What I also don’t remember seeing is that every US index is dark green including microcaps.
The other Americas are all light green except Mexico. However, Mexico has moved from red last month to brown. Global equities ex-US and emerging markets are both light green.
Asia is entirely green as well — either light green or dark green. So we will just mention the five strongest. Those are Japan (2.71); Thailand (2.59); Singapore (2.38); Malaysia (2.33) and South Korea (1.95). Pay attention to Japan because it has been a relatively weak stock market for a long, long time. But not anymore!
Europe is also all green except for Sweden. Here the five strongest are the UK (2.23); France (2.01); Austria (1.96); Belgium (1.84) and German (1.83). Again, very strong markets. The only disappointment is that several of the ETFs that were tracked no longer exist and had dropped off their data.
Austria, France, Germany and the UK are all light green. Belgium, the Netherlands, Russia, and Switzerland are yellow. While Spain and Sweden are brown. Emerging countries on that side of the chart are quite strong.
On the currencies side, we have three green currencies (all light green) the British Pound, the Yen, and Bitcoin (based on the closed end fund). Bitcoin is green despite a 50% drop from the highs, but remember the SQN 100 is 100 days.
The weakest currencies are the Brazilian Real, the US Dollar, the Canadian Dollar and the Japanese Yen. All of them are brown.
In the US stock market sectors, we have numerous areas that are not only strong but have SQN100 scores over 3.0. Again, I haven’t seen that before. These include Consumer Discretionary (3.78), Broker Dealer (3.56); Finance (3.48); and Industrial (3.48). However, we also have more that are over 2.0 including Aerospace and Defense (2.88); Basic Materials (2.53); Homebuilders (2.47); Technology (2.47), Gaming (2.49); Regional banks (2.31), and Insurance (2.13). It’s a fantasy world.
There is one yellow, Pharmaceuticals, and two brown, REITs and Telecom, and one red, utilities. And, of course, volatility which is almost non-existent is also red.
|
|
|
Commodities, Real Estate, Debt, and the Top and Bottom Lists
Commodities are a mixed bunch again. Commodities, oil, coal, global water, timber, and global agribusiness are all dark green. Steel is light green. Base metals, agriculture, and livestock are all yellow. And finally we have silver, gold, and natural gas being brown. Silver and gold are actually going up but not for 100 days.
|
|
|
Interest rates all look terrible. Except for Junk bonds (yellow) and corporate and inflation-adjusted bonds, which are brown, all interest rates are red.
Real estate in mostly neutral with the US again being stronger than China. As I mentioned last month, in my area of the country inexpensive houses have increased in price a lot. We bought a condo last year for $125,000, put about $20,000 into it and rented it out for a year. We’ll soon be listing it, and it looks like we might make a slight profit after the realtor’s fee.
However, more expensive houses, are selling at prices that are not much over their cost 20 years ago. My house, for example, is probably about double what I paid for it 28 years ago, but that doesn’t even make up for inflation.
However, there is a good side to that. We are buying a new house that’s an upgrade. The people we are buying it from are just about breaking even from what they paid for it 18 years ago. Here are a couple of snapshots. We close on Feb 13th, and I’m getting excited about it. It’s been on the market almost a year.
|

|
|
The view includes 1) the great room/entertainment area; 2) view from the master bedroom; 3) the room that will become my office and 4) a view of the front/side of the house.
The Top/Bottom Ranking Lists:
The top ranking list has one every ETF above 3.0 — the Dow for the 2nd straight month. However, it’s above 4, and that’s the first for any ETF in my memory.
And the bottom ranking lists are mostly interest rates. Rates are going up, the market is going up, and you don’t want to be in interest rate instruments unless you have some beliefs about being diversified and only holding and keeping one portfolio.
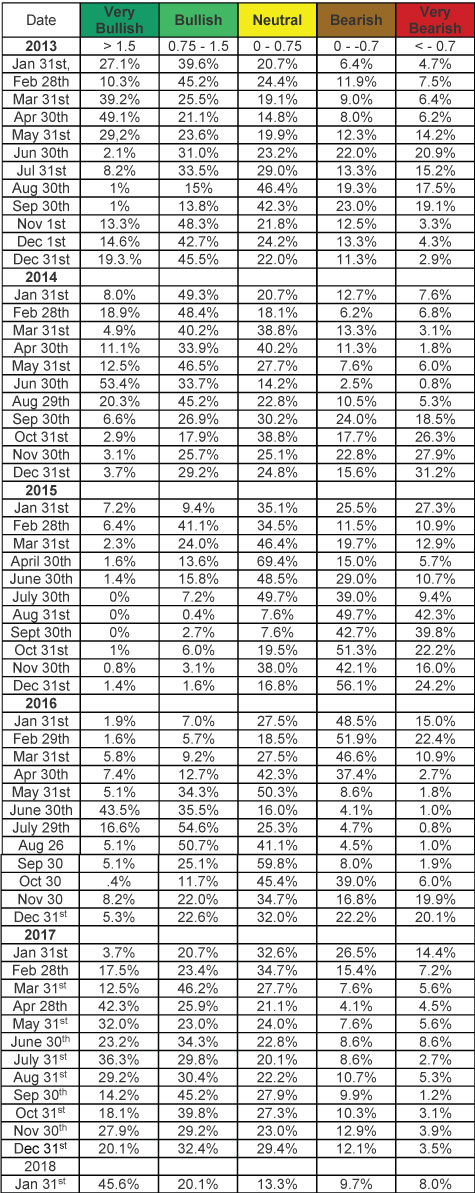
Summary
Let’s look at the summary table which measures the percentage of ETFs in each of the strength categories. You can see the distribution of the database by Market SQN score in bullish, neutral and bearish categories below with the January 31st figures at the bottom of the table —
|
|
|
The market is really strong with 45.6% strong bull and 65.7% bullish. The market is fairly strong and staying there. Only April 2013 and June 2014 passed this month in terms of more strongly bullish ETFs.
Be careful to base your actions upon what IS happening, not what you think might happen. The markets always offer opportunities, but to capture those opportunities, you MUST know what you are doing. If you want to trade these markets, you need to approach them as a trader, not a long-term investor. We’d like to help you learn how to trade professionally because trying to navigate the markets without an education is hazardous to your wealth. All the beliefs given in this update are my own. Though I find them useful, you may not. You can only trade your own beliefs about the markets.
Until next month this is Van Tharp.
|
|
|
|
February 2018 - Cary, NC
Click the title of the workshop to see more about each.
|
|
|
|
Presented by Van Tharp
with co-presenter RJ Hixson
|
|
|
|
February 17-19
Saturday-Monday
|
|
|
|
|
|
|
|
|
|
Peak Performance 101 is Dr. Tharp's core psychological workshop, and his most transformative course for over 25 years. If you want to know how great traders think, behave and act so you can achieve consistent and profitable results, without stress, then this workshop is for you. Plus, this is a qualifying workshop for traders to apply for the Super Trader Program.
|
|
Presented by Van Tharp
and RJ Hixson
|
|
|
|
February 21-23
Wednesday-Friday
|
|
|
|
|
|
|
|
In just three days you’ll see how all of Van Tharp ’s strategic trading concepts fit into one seamless design for more predictable trading results. Your trading will never be the same.
This course illustrates the relationships among the steps so that the process is logical and reasonable. Moreover, you will learn how to take each step experientially, so you really get it. This workshop is filled with time-tested elicitation questions to bring forth each person’s most important issues.
|
|
|
|
March 2018 - Sydney, Australia
|
|
|
|
Presented by Van Tharp
with co-presenter RJ Hixson
|
|
|
|
|
|
|
|
|
Presented by RJ Hixson
and Van Tharp
|
|
|
|
March 13-15
Tuesday-Thursday
|
|
|
|
|
|
|
|
Do you want bigger and more consistent profits from the market?
If you want consistency and would like to make profits from the market, you'll want to attend this three-day workshop. We'll show you little-known, closely guarded secrets that you're not likely to find unless you accidentally stumble upon them yourself.
Are you a low-risk investor who just wants to make small, consistent profits each month with only an occasional loss? We can show you how to develop a system that will allow you to develop a unique methodology that will give you that kind of consistency!
Are you a gutsy trader who'd like to make yearly profits of 100%, 200% or even 1,000% per year? Although risky, it is possible, and we can show you how to do it! The interesting thing is that you can do it in such a way that the only money you're risking is the money you've already made from the market. That's real leverage!
|
|
|
|
March 23-25
Friday-Sunday
|
|
|
|
|
|
|
|
|
|
What You Will Get In This Course
Beginning on Day 1, you’ll learn what the real Wealth Game is and, more importantly, what it isn’t. You will discover:
- Who decides the rules in the wealth game
- What money really is and why it doesn’t even matter
- What is holding you back from creating infinite wealth in your own life
- How different people think about money and why it matters
- The single greatest method for infusing positive beliefs about wealth into your being
- How to achieve infinite wealth in 7 simple steps
We’ll finish the day by playing that’s designed to get you thinking about the game of wealth in a much different way and to look at your patterns of behavior when it comes to money. You’ll learn more about yourself…your beliefs about money, and what’s possible (or not) just by playing this game
On Day 2, we’ll start with a quick review before I share with you the exact same steps I took to create infinite wealth for my family and myself. You will learn how to model my success and achieve real freedom for yourself. We begin by discovering how to:
- Become debt-free in less than 7 years, including your home, cars, credit card debt, student loan debt and more, all on your current income
- “See yourself” infinitely wealthy with the same visualization techniques my Super Traders use
- Invest in yourself to increase your income by 1000%
- Use tax expectancy to your advantage as a trader and investor
- Create inner wealth to achieve the freedom you seek
At the end of the day, we’ll again play the game to reinforce new wealth-building concepts while continuing to think of infinite wealth as a game to be played.
Day 3 begins with a review of the previous day’s notes and discoveries before we cover more in- depth inner work. Before you leave the workshop, you will know how to:
- Overcome your weaknesses while fostering your strengths with SWOT analysis
- Come back from a set-back, all with a unique mental resilience tool
- Begin each day with a clear intention, simply by removing your limiting money beliefs
- Use the matrix model to achieve infinite wealth
- Get your life purpose in alignment with your financial goals
|
|
|
|
|
|
April 14-15
Saturday-Sunday
|
|
|
|
|
|
|
|
|
|
Presented by Gabriel Grammatidis
|
|
|
|
April 21-23
Saturday-Monday
Brief description available now. More info coming soon.
|
|
|
|
|
|
|
|
Presented by Gabriel Grammatidis
|
|
|
|
April 24-25
Tuesday- Wednesday
Registration open now. More info coming soon.
|
|
|
|
|
|
|
|
|
|
April 27-29
Friday-Sunday
|
|
|
|
|
|
|
|
|
|
Presented by Van Tharp
with co-presenter RJ Hixson
|
|
|
|
|
|
|
|
|
Presented by Van Tharp
and RJ Hixson
|
|
|
|
May 22-24
Tuesday-Thursday
|
|
|
|
|
|
|
|
|
|
More 2018 Dates Coming Soon
|
|
June: Super Trader Program Members only. Options, Advanced Options and Cryptocurrency Trading
July: Peak 101 and Modeling Great Trading Through Mental Strategies (Peak 204)
August: Day Trading Systems and Live Day Trading. Plus, Trading in a Sideways Market
September: How to Develop Winning Trading Systems that Fit You. Plus, Peak Performance 202
October: LONDON! Peak Performance 101, Peak Performance 203, Forex Trading Systems, Live Forex Trading, and, Blueprint for Trading Success
Specific dates for the above events will be released soon and the workshops will open for registration at that time.
|
|
|
|
FREE Book!
We pay for the book, you just pay for shipping.
When you add the free book to an item already being shipped there is generally no extra shipping charge (of course, depending on your location).
Read Van’s Latest Book —
TRADING BEYOND THE MATRIX
The Red Pill for Traders and Investors
Eleven traders tell their stories about transforming
their trading results and lives, in this 400 plus page book.
Below is a brief video on how powerful this book is to traders.
|
|
|
|
Cary, NC Workshop Information
For a list of nearby hotels for our Cary, North Carolina locations,
click here.
Book your flight arriving to the Raleigh-Durham International Airport (RDU).
When traveling to a three-day course, it's best to arrive the evening before.
To help determine your arrival and departure times, see:
Questions? Click Here to Ask Van...
CONTACT US
This is a supplement to our subscription based newsletter, Tharp's Thoughts.
800-385-4486 * 919-466-0043 * Fax 919-466-0408
|
|
|
|
|