|
|
|
Tharp's Thoughts
Weekly Newsletter
|
|
|
|
|
|
|
|
-
Feature: November 2017 Market Update — Bull Quiet Market Type
by Van K. Tharp, Ph.D.
-
Workshops: Forex Discounts End, Plus Dates Added for Australia and more in 2018.
-
Tips: October 2017 System Quality Number ® Report The SQN ® Report
Van K. Tharp, Ph.D.
-
|
|
|
|
$700 EARLY BIRD DISCOUNT
ENDS TODAY!
|
|
|
|
November 2017 Market Update:
Bull Quiet Market Type
Van K. Tharp, Ph.D.
|
|
|
|
|
I always say that people do not trade the markets; they trade their beliefs about the markets. In that same way, I'd like to point out that these updates reflect my beliefs. I find the market update information useful for my trading, so I do the work each month and am happy to share that information with my readers. If your beliefs are not similar to mine, however, then this information may not be useful to you. Thus, if you are inclined to go through some sort of intellectual exercise to prove one of my beliefs wrong, simply remember that everyone can usually find lots of evidence to support their beliefs and refute others. Simply know that I admit that these are my beliefs and that your beliefs might be different.
These monthly updates are in the first issue of Tharp's Thoughts each month which allows us to get the closing data from the previous month. These updates cover 1) the market type (first mentioned in the April 30, 2008 edition of Tharp's Thoughts), 2) the debt statistics for the US, 3) the five-week status on each of the major US stock market indices, 4) our four-star inflation-deflation model, and 5) tracking the US dollar. I also write a report on the strongest and weakest areas of the overall market as a separate SQN® Report. Significant market changes may mean the SQN Report comes out more than once a month.
Part I: The Big Picture
The equity markets right now continue in Bull Quiet mode. The S&P has been in Bull or Strong Bull since early in the year. It’s been in this market type for a long, long time. And this is the value of market type. These are the kind of market conditions that make an average investor look like a genius. Of course, the average person is still afraid of the market although more and more people are entering. There continues to be very little interest, for example, in trading books. The market type classification system is descriptive of today’s conditions, not predictive of tomorrow’s.
|
|
|
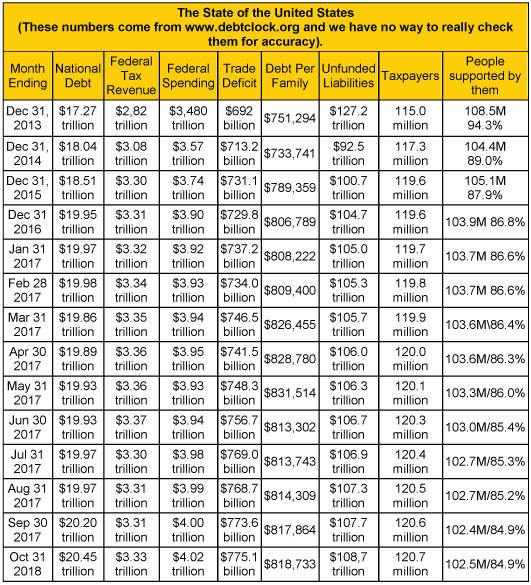
The US National Debt has finally surpassed $20 trillion and has nearly zoomed to $20.5 trillion. Federal spending is now listed at $4 trillion for the first time. Right now there are 23.4 million federal employees — pretty much the same as it’s always been. Trump just fires his own people in the White House, not government employees.
Currently there are 120.7 million taxpayers supporting 102.5 million other people. Here I count retirees (51.3M, disabled, 10.5 million, and Food stamp recipients, 40.7M), however, the US debt clock lists 165.7 million people receiving some sort of benefit. I had to start taking Social Security last year, so I guess I’m one of them. I figure, however, that I contribute back about a 1/3 of what I get each year and I pay another third of it back in taxes. And I’ve been paying the maximum into Social Security for some time.
Part II: The Current Stock Market Type Is Bull Quiet
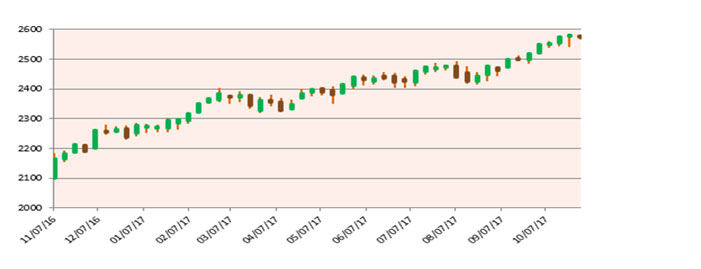
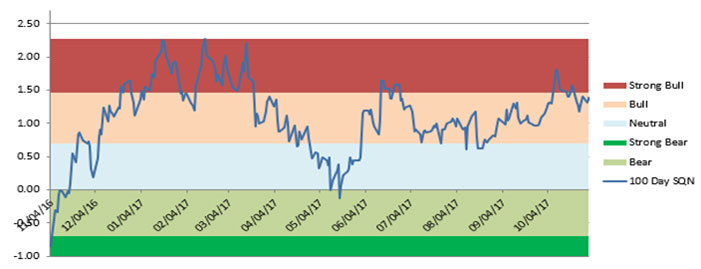
The market continues in Bull mode at the end of October and it’s been that way for most of 2017. People should be fully invested using a modified buy and hold (i.e., 25% trailing stop on everything). The Market SQN score for the 100 day period is Bull. The Market SQN score for 200 days, 50 days, and 25 days puts all of them in the Strong Bull range. This is about as good as it gets and if you are not up about 20% or more in your portfolio in 2017, then something is wrong.
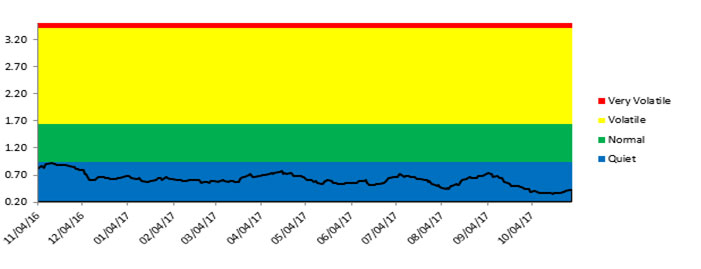
The first graph below shows the S&P 500 in weekly bars over the last year so the bull market is easy to see. By the way, we have had a bull market type for a long time now. Does that mean it will continue? No, it’s pretty much like a trend in that you never know when it will stop. But it has continued for a long time and had you been invested based on the market type, you would have reaped large rewards.
|
|
|
Market volatility is so quiet that I had to change the axis to go below 0.5 in order to show the line (now at 0.41) Again, this is not the climate out of which bear markets arrive.
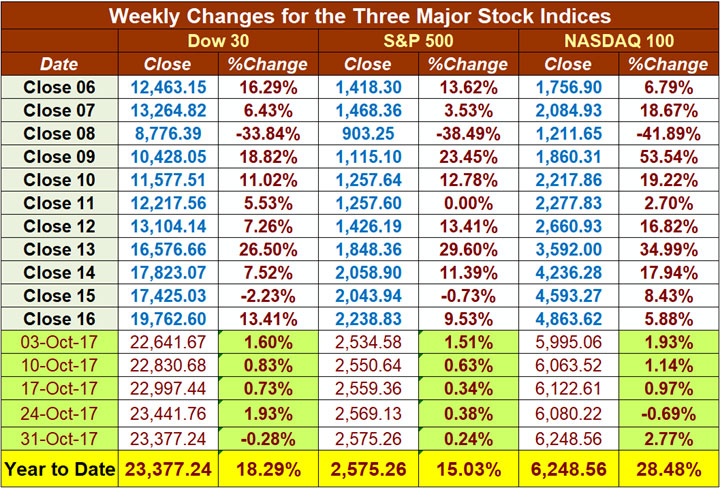
The table below reports the three major US Indices levels through the end of October. The Dow and S&P 500 are both up over 15% on the year and the NASDAQ is up nearly 30%. Contrast those returns with what people are earning in their savings accounts or what they are making sitting on the sidelines predicting a bear market. How about you?
|
|
|
|
Market volatility is so quiet that I had to change the axis to go below 0.5 in order to show the line (now at 0.41) Again, this is not the climate out of which bear markets arrive.
The table below reports the three major US Indices levels through the end of October. The Dow and S&P 500 are both up over 15% on the year and the NASDAQ is up nearly 30%. Contrast those returns with what people are earning in their savings accounts or what they are making sitting on the sidelines predicting a bear market. How about you?
|
|
|
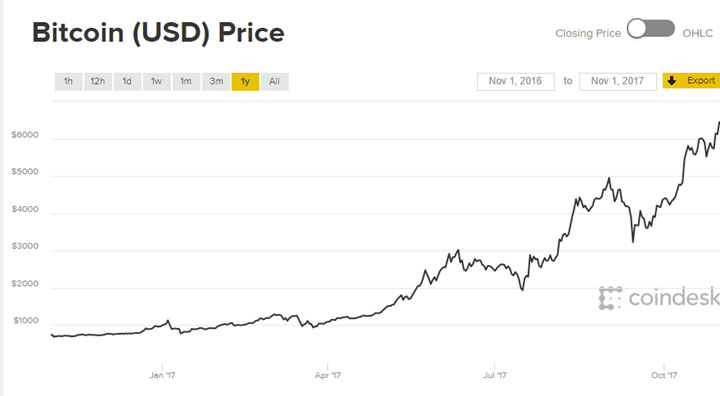
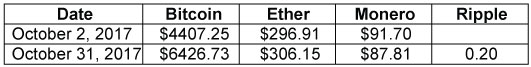
I want to start tracking an extra market here, the price of Bitcoin and several other major crypto-currencies. I think Bitcoin and crypto-currencies in general have the potential to be significant in the future. And, of course, Bitcoin only went up 44.82% from its price which I last listed in on October 3rd. Hedge funds can now use leveraged instruments to invest in it and the CME just announced on Halloween that it would list a Bitcoin futures contract soon. The next step will be a Bitcoin ETF.
There are now many newsletters claiming to help you make a fortune in crypto-currencies. Palm Beach Research has about 140,000 people on a conference call scheduled for Thursday night. Many of them will pay several thousand dollars for a newsletter to help them invest in a market that has a total capitalization that’s much lower than Apple. Stansberry Research launched such a newsletter as did Motley Fool. In each case, the price of the newsletter is VERY expensive and the subscriptions are pulling in millions of dollars of revenue. Be careful about this area and watch for more information coming in Tharp’s Thoughts.
|
|
|
The following is a bitcoin chart over the last year. Notice anything interesting?
|
|
Bitcoin was first introduced as a concept in a paper in 2008. As of early this year it was well under $1000. Notice what’s happened to the price of gold as bitcoin has become more popular — even in scary times when one would have expected gold to go up. There are now more than 1,000 crypto-currencies in existence now, most of which will be deadly to your wealth if you own them.
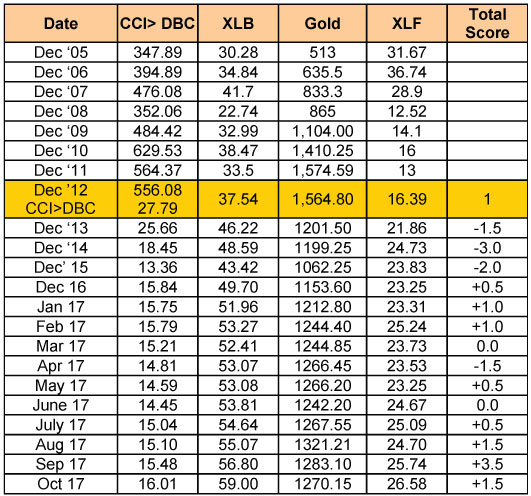
Part III: Our Four-Star Inflation-Deflation Model
Gold, basic materials, and commodities are up over the last six month which helped produce an inflationary model score. See the historical numbers for previous years and the monthly figures for the last year below.
|
|
The model produced an inflationary score for the month of October which continues the trend for the last few months. I took a look at the shadowstat.com data and notice that inflation, based upon how the CPI was calculated in 1980, still shows close to a 10% rate.
|

|
|
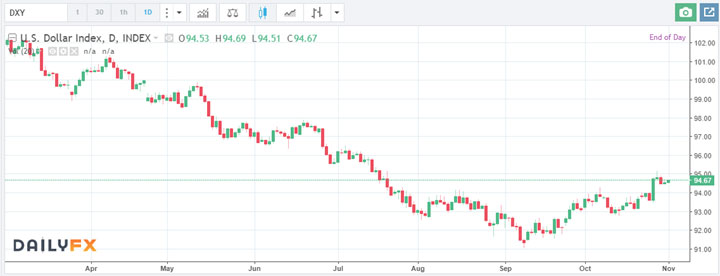
Part IV: Tracking the Dollar
The dollar has formed something of a base with a slight recovery since September. That’s amazing considering I was presenting workshops in the UK during the last month. The Tharp Effect says that the dollar goes down (especially against the foreign currency concerned) whenever Van goes overseas. USD is down considerably, however, from its highs when Donald Trump took office.
The USD Index looks like it would probably be a Bear Quiet market type now. UUP (the US Dollar ETF) is now in a Strong Bear market type based on our World Market Model (see the SQN Report article below). What does that mean to your pocket if all of your assets are based in $US? It means that since the highs early this year, you have lost about 10% of your net worth relative to other major currencies.
|
|
|
Conclusion
Today, equities are in a Bull Quiet market type. The market type has been either Bull Quiet or Strong Bull Quiet for many months. Has this market type gone on too long to continue? No. Is there a market type change about to happen? Maybe, the market type will change at some point. When? I don’t know.
I monitor market type to know what kind of trading systems to trade. Right now, you should basically be long and use a trailing stop (25% if nothing else) to manage your risk. As long as the market type is bull and quiet, a simple approach like this will make money.
I continue to read headlines about reasons for a pending market crash. Look at what the market is doing right now. It’s bull quiet. PERIOD.
Until next month, this is Van Tharp.
|
|
|
|
|
|
About the Author: Trading coach, and author, Dr. Van K. Tharp is widely recognized for his best-selling books and his outstanding Peak Performance Home Study program - a highly regarded classic that is suitable for all levels of traders and investors. You can learn more about Van Tharp www.vantharp.com.
|
|
|
|
|
|
|
Forex has evolved into a market in which individual investors can trade efficiently.
Early enrollment discount expires TODAY on our Forex courses this month!
|
|
|
|
Presented by Gabriel Grammatidis
|
|
|
|
November 10-12
Friday-Sunday
|
|
|
|
|
|
|
|
Presented by Gabriel Grammatidis
|
|
|
|
November 13-14
Monday-Tuesday
|
|
|
|
|
|
|
|
|
|
Get a look at what it's like to attend a Forex Workshop in the video below.
|

|
|
Learn to Trade Three Forex Trading Systems with an Edge
Gabriel will be teaching three robust Forex systems based on trend-following. Each system is based on similar “ingredients,” but each has a different recipe to capture a different part of the trend. Consequently, the systems are complementary to each other and together offer several trading setups nearly every day of the year.
Gabriel will spend most of the workshop teaching his trend-following systems. The first half day is spent to go over the specifics of trading the Forex market and cover such topics as:
- Why trade Forex?
- What are the advantages and drawbacks of trading Forex versus other instruments?
- What are the main market characteristics, and who are the Forex market participants?
- What methods work best in the Forex market?
- All you need to know about Forex trading sessions and the currency pairs.
- How are Forex chart characteristics different than stocks or futures?
- What do you look for in a Forex broker? What do you avoid?
- Why Forex may actually be the best market for new traders to learn trading.
- What are the trading edges that work in Forex?
Join us for this three-day workshop and leave prepared to trade the systems right away. Plus, join us for 2 days of live Forex trading so you can trade the systems live for even more hands on experience!
|
NEW BONUS OFFER. For the first time Gabriel is extending a combo discount on the workshop and live trading. Attend both for an additional $500 discount on live trading.
Special price offers:
-
Start your study early. Order the Forex Home Study Course now and walk through the door with a thorough understanding of the Busted Breakout (System 1). Home study buyers get $600 off the price of the live workshop!
-
Combo discount: We have never before offered a combo discount on the live portion of the Forex training. But now, for a limited time, when you register for both November events you'll get an extra $500 off on live trading. Learn More...
|
|
|
|
October 2017 System Quality Number® Report
The SQN® Report
by Van K. Tharp, Ph.D.
|
|
|
|
|
There are numerous ETFs that track everything from countries, commodities, currencies and stock market indices to individual market sectors. ETFs provide a wonderfully easy way to discover what’s happening in the world markets. I apply a version of my System Quality Number® (SQN®) score to measure the relative performance of numerous markets in a world model.
The Market SQN score uses the daily percent change for input over a 100-day period. Typically, a Market SQN score over 1.47 is strongly bullish and a score below -0.7 is very weak. The following color codes help communicate the strengths and weaknesses of the ETFs in this report:
- Dark Green: ETFs with very strong Market SQN scores > 1.47
- Light Green: ETFs with strong Market SQN scores (0.70 to 1.47).
- Yellow: ETFs with slightly positive Market SQN scores (0 to 0.70). These are Neutral/Sideways
- Brown: ETFs with slightly negative Market SQN scores (0 to -0.7).
- Red: Very weak ETFs that earn negative Market SQN scores (< -0.7).
This is basically the same rating scale that we use for the Market SQN Score in the Market Update. The world market model spreadsheet report below contains a cross section of currently available ETFs; excluding inverse funds and leveraged funds. In short, it covers equity markets around the globe, major asset classes, equity market segments, industrial sectors, and major currencies.
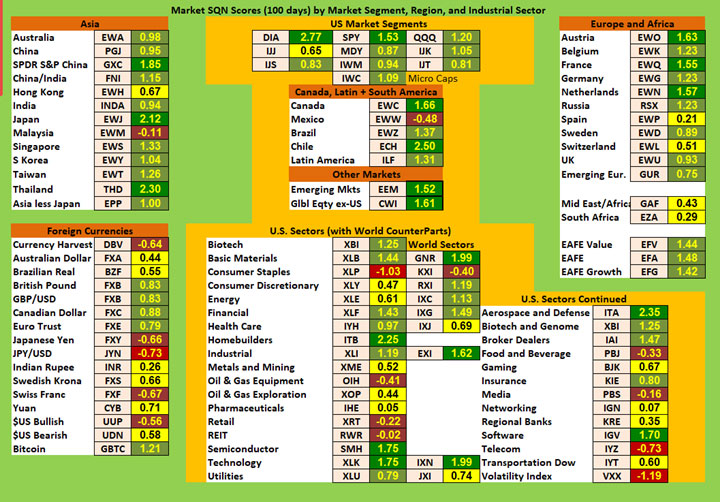
World Market Summary — Equities & Currencies
Each month we look at the equities markets across the globe by segment, region, and sector.
The US Dollar is no longer the weakest currency that we track but it’s brown. And since the world model is totally valued in the US Dollar, everything should be increasing relative to the dollar. Thus, the rest of the world looks better as a result of the weak Dollar.
Overall, the US market segments look much like last month. They are all yellow and green. The Dow is dark green, and it’s one of the strongest ETFs in our database. SPY is also dark green. In the Americas geography, country market scores are all positive — either yellow or green, except Mexico which is brown. Canada and Chile, like last month, are both dark green. Global equities ex-US and emerging markets are dark green, respectively.
Asia is also green with one yellow (Hong Kong) and one brown, Malaysia. China, Japan and Thailand are dark green. Pay attention to Japan because it has had a relatively weak stock market for a long, long time.
Europe is all green with the exception of Spain which is yellow. Austria and the Netherlands are both dark green. The Middle East and South Africa are both neutral but Pakistan (which we don’t track in the table) in the weakest ETF in the database right now.
|
|
|
In currencies this month, the Currency Harvest ETF, the Japanese Yen, the Swiss Franc, and the US Dollar are all brown. The Yen vs the Dollar is red (which I’m not sure makes sense as both currencies are brown). The strongest currencies are the British Pound (the Tharp Effect in action during our London workshops?), the Canadian Dollar, the Euro, and Bitcoin. The Bitcoin symbol in the database, however, is a highly overvalued closed end fund. Bitcoin would be dark green and the strongest thing on the chart but the fund price doesn’t track exactly Bitcoin’s price. We will be better able to track Bitcoin once a Bitcoin ETF is offered. The neutral currencies
include the Australian Dollar, the Brazilian Real, the Indian Rupee, and the Swedish Krona.
In the US stock market sectors, Semiconductors, Technology, Software and Aerospace and Defense are the strongest sectors being dark green. There are many light green sectors. The weakest sectors are consumer related, oil and gas related, Retail, REITS, and Telecom. Due to such little volatility in the market, the VIX based ETF (VXX) is still weak but it is no longer red. It’s not going down because its already very low.
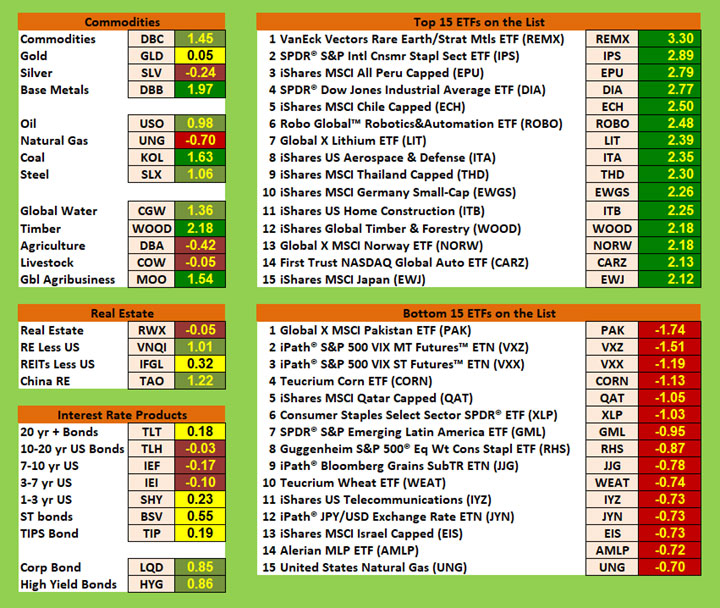
Commodities, Real Estate, Debt, and the Top and Bottom Lists
Commodities are a mixed bunch again. There is one red sector, Natural Gas. Agriculture, Livestock, and Silver are all weak. Oil and Silver have moved to brown. Gold is neutral. But Blended Commodities, Oil, Steel, and Global Water are all light green. The strongest commodities in October were Base Metals, Coal, Timber, and Global Agribusiness.
Real estate is another mixed bag, with US real estate being brown, and Chinese real estate being light green. It’s interesting. I’ve owned my house for 27 years and its value has not kept up with inflation … even the government’s weaker measure of inflation. While in London in October, I looked at the house that my parents bought there in the late 1950s for probably less than $10,000. It’s now worth about three million pounds. Location and country are very important. I saw 2 bedroom leasehold apartments in Covent Garden (the theater district in central London) going for over 2 million pounds.
All of the government interest rate products are neutral or brown. The positive performance in debt is in corporate bonds and junk bonds which are still just light green.
|
|
|
The Top and Bottom Ranking Lists
The top ranking list has one ETF above 3.0 — rare earth metals (a new ETF to the database) and the rest of the list is above 2.0. Many of these ETFs were added to our database in a recent update and I’m not seeing any significant trends here.
This month’s bottom list is similar in that many of the ETFs that appear are newer ones such as Pakistan. But some items remain from previous months such as the VIX ETF and certain commodities (corn, wheat, natural gas).
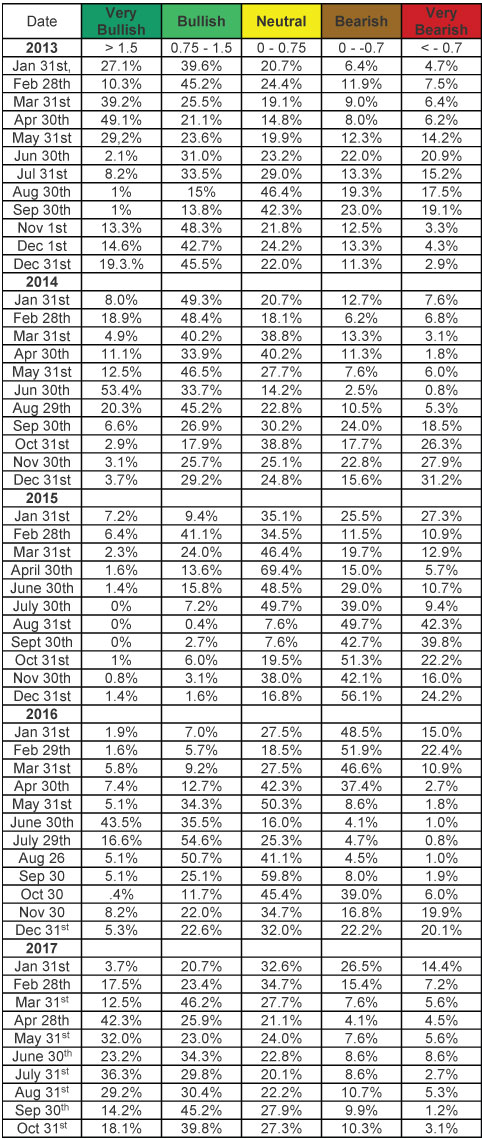
Summary
Let’s look at the summary table which measures the percentage of ETFs in each of the strength categories. You can see the distribution of the database by Market SQN score in bullish, neutral and bearish categories just below with the October 31 figures at the bottom of the table —
|
|
|
There is no real trend in the recent data. The market is fairly strong and staying there for now.
Be careful to base your actions upon what IS happening, not what you think might happen. The markets always offer opportunities, but to capture those opportunities, you MUST know what you are doing. If you want to trade these markets, you need to approach them as a trader, not a long-term investor. We’d like to help you learn how to trade professionally because trying to navigate the markets without an education is hazardous to your wealth. All the beliefs given in this update are my own. Though I find them useful, you may not. You can only trade your own beliefs about the markets.
Until next month this is Van Tharp.
|
|
|
|
|
|
January 19-21
Friday-Sunday
|
|
|
|
|
|
|
|
Van shares years of knowledge about wealth concepts, wealth creation modeling, being wealthy inside, and the infinite wealth processes. Attend this workshop and completely reshape your attitudes toward money, work, paychecks, income, wealth, scarcity, and abundance. Your paradigm shifts in just three days will amaze you and release you from your current beliefs about wealth that have been running in your unconscious and holding you back.
|
|
|
|
Presented by Libby Adams and RJ HIxson
|
|
|
|
January 23-26
Tuesday-Friday
|
|
|
|
|
|
|
|
Immense success is possible for most traders and investors. But the secret to that success has little to do with some magical trading system. Instead, it has everything to do with you. You are the secret ingredient to your success. And when you transform yourself, you transform everything. Peak Performance 202 is a major leap forward for those of you who are willing to step out of your comfort zone.
|
|
|
|
Presented by Van Tharp
with co-presenter RJ Hixson
|
|
|
|
February 17-19
Saturday-Monday
|
|
|
|
|
|
|
|
|
|
Peak Performance 101 is Dr. Tharp's core psychological workshop, and his most transformative course for over 25 years. If you want to know how great traders think, behave and act so you can achieve consistent and profitable results, without stress, then this workshop is for you.
|
|
Presented by Van Tharp
and RJ Hixson
|
|
|
|
February 21-23
Wednesday-Friday
|
|
|
|
|
|
|
|
In just three days you’ll see how all of Van Tharp ’s strategic trading concepts fit into one seamless design for more predictable trading results. Your trading will never be the same.
This course illustrates the relationships among the steps so that the process is logical and reasonable. Moreover, you will learn how to take each step experientially, so you really get it. Dr. Tharp is an expert in delivering elicitation questions to bring forth each person’s most important issues.
|
|
|
|
March 2018 - Sydney, Australia
|
|
|
|
Presented by Van Tharp
with co-presenter RJ Hixson
|
|
|
|
|
|
|
|
|
Presented by RJ Hixson
and Van Tharp
|
|
|
|
March 13-15
Tuesday-Thursday
|
|
|
|
|
|
|
|
|
|
March 23-25
Friday-Sunday
|
|
|
|
|
|
|
|
|
|
Futures Trading Workshop
Presented by Gabriel Grammatidis
|
|
|
|
April 21-23
Saturday-Monday
Registration will open soon. Do not book any travel at this time.
|
|
|
|
|
|
|
|
Futures Live Trading
Presented by Gabriel Grammatidis
|
|
|
|
April 24-25
Tuesday- Wednesday
Registration will open soon. Do not book any travel at this time.
|
|
|
|
|
|
|
|
|
|
April 27-29
Friday-Sunday
|
|
|
|
|
|
|
|
|
|
Presented by Van Tharp
with co-presenter RJ Hixson
|
|
|
|
|
|
|
|
|
Presented by Van Tharp
and RJ Hixson
|
|
|
|
May 22-24
Tuesday-Thursday
|
|
|
|
|
|
|
|
|
|
NEW E-learning Course!
Forex Trading Systems: The Busted Breakout System
Click on the image below to watch a brief 1 minute video that hightlights this new course.
|

|
|
Gabriel developed and refined his Busted Breakout system on the concept of trend-following while he was still enrolled in the Super Trader program.
The system has a high win rate (about 65%) and it takes advantage of a price pattern that happens again and again in the charts — breakout failures. The main advantage of this is that it benefits from running for other peoples’ stops. This is a unique edge of the system making the trade break-even early on. Watching 15-minute charts for 4-6 hours a day and trading only the biggest, most liquid currency pairs, the system finds easily more than 150 trades per year. The pattern works equally well on 5min, 60min and 240min charts so the trade opportunity per year can be much higher depending how you trade. Gabriel is confident that someone with the programming skills could turn the system into a well-performing automated trading system.
The three-day workshop cost is $3,995 but the cost of the home study program is $1,295. As a special introduction price for early responders you can get this new home study for just $995.
Plus, buy the home study now and if you decide to join us at the 3-day Forex Trading workshop in November (or for any Forex workshop in the future), you can deduct $600 off of your course payment for the workshop.
This is win-win for all! If you are among the group of clients who simply cannot come to one of our workshops this home study offers you the benefit of still gaining access to a robust and premium forex trading system. Gabriel has traded it himself in several timeframes for many years now offering a persistent edge in the market.
But, if you have already been considering attending the workshop this is a great way for you to get a full-steam head-start and walk through the workshop door already understanding the system well. You will then have the opportunity to ask Gabriel anything you need. And in addition, learn two new Forex trading systems. The three systems taught in the workshop all offer unique advantages. They complement each other giving you the opportunity to reap various stages in a trend.
|
|
|
|
FREE Book!
We pay for the book, you just pay for shipping.
Read Van’s Latest Book —
TRADING BEYOND THE MATRIX
The Red Pill for Traders and Investors
Eleven traders tell their stories about transforming
their trading results and lives, in this 400 plus page book.
Below is a brief video on how powerful this book is to traders.
|
|
|
|
Cary, NC Workshop Information
For a list of nearby hotels for our Cary, North Carolina locations,
click here.
Book your flight arriving to the Raleigh-Durham International Airport (RDU).
When traveling to a three-day course, it's best to arrive the evening before.
To help determine your arrival and departure times, see:
Questions? Click Here to Ask Van...
CONTACT US
This is a supplement to our subscription based newsletter, Tharp's Thoughts.
800-385-4486 * 919-466-0043 * Fax 919-466-0408
|
|
|
|
|