|
|
|
Tharp's Thoughts
Weekly Newsletter
|
|
|
|
|
|
|
|
-
Feature: July 2017 Market Update:
Bull Quiet Market Type,
by Van K. Tharp, Ph.D.
-
Workshops: Workshop Dates Set for the rest of 2017, including London, England this October!
-
Tips: July 2017 SQN Report
by Van K. Tharp, Ph.D.
-
|
|
|
|
For The First Time Ever We Have An
Exciting New Benefit to Offer Sideways Market Attendees:
You will have access to a recording of the workshop
during the period of follow-up coaching!
|
|
|
|
Attend Both August Workshops and Take an Extra $1,000 Off the Combo!
|
|
TIME SENSITIVE: Due to the extensive pre-work that will be distributed by Dr. Long to prepare for this class, it is highly recommended that students sign up as soon as possible after making the decision to attend. We want each student to have ample time to complete their work and be fully prepared before attending, so time in class will be the most beneficial for all.
|
|
|
|
July 2017 Market Update:
Bull Quiet Market Type
by Van K. Tharp, Ph.D.
|
|
|
|
|
I always say that people do not trade the markets; they trade their beliefs about the markets. In that same way, I'd like to point out that these updates reflect my beliefs. I find the market update information useful for my trading, so I do the work each month and am happy to share that information with my readers. If your beliefs are not similar to mine, however, then this information may not be useful to you. Thus, if you are inclined to go through some sort of intellectual exercise to prove one of my beliefs wrong, simply remember that everyone can usually find lots of evidence to support their beliefs and refute others. Simply know that I admit that
these are my beliefs and that your beliefs might be different.
These monthly updates are in the first issue of Tharp's Thoughts each month which allows us to get the closing data from the previous month. These updates cover 1) the market type (first mentioned in the April 30, 2008 edition of Tharp's Thoughts), 2) the debt statistics for the US, 3) the five-week status on each of the major US stock market indices, 4) our four-star inflation-deflation model, and 5) tracking the US dollar. I also write a report on the strongest and weakest areas of the overall market as a separate SQN™ Report. Significant market charges may mean the SQN Report comes out more than once a month.
Part I: The Big Picture
So what are the markets telling us now?
The markets have been quite strong since the Trump election. The Market SQN™ score is bullish and has been pretty much since November.
|
|
|
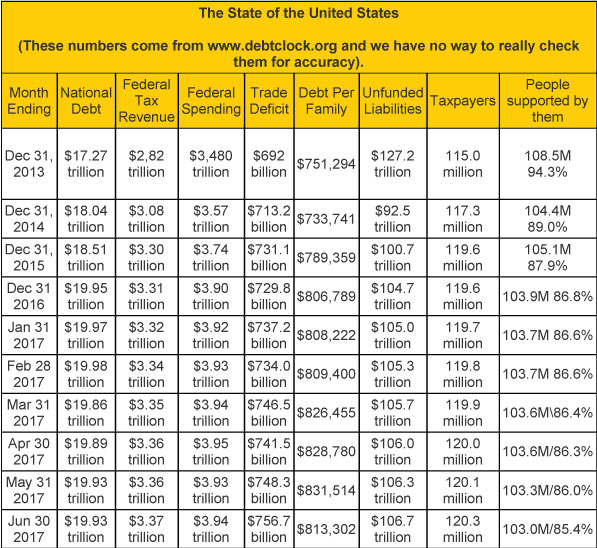
In late April 2016, usdebtclock.org said our official debt went over the $19 trillion mark and at the end of last month we are only $70 billion away from $20 trillion. Nevertheless, our politicians are doing their usual “wonderful” job of spending our money plus money they don’t have. Donald Trump is nothing new. Trump wants to build a multibillion dollar wall (that will basically be useless), reduce taxes, and increase the worst form of spending — war spending (framed as Defense). Incidentally, when the USSR dissolved and the Cold War ended, we could have slashed our defense spending and today, we would basically have no debt. Instead, the war machine
needed to keep making money so they invented the War on Terror, homeland security, and took away a lot of our prior freedoms all in the name of protecting Americans.
Incidentally, the website says there are 120.3 million U.S. taxpayers. I add together US Retirees (51.1 million) food stamp recipients (41.3 million) and disabled people drawing social security (10.6 million). I don’t think there is any overlap here. And lately those numbers are going down, just because food stamp recipients are going down each month. Those groups total 103.3 million and that’s why I say that they constitute a group that’s 86% of the number of taxpayers. I could also include all government employees (23.5 million) as among those supported by taxpayers — but they do pay taxes. The US debt clock now say the US revenue per taxpayer is $28,029. So if
your taxes are less than that, you are below average. But remember about 10% of the taxpayers (12 million tax payers) pay most of the tax revenue. By the way, the debt clock lists Medicaid, Medicare, and several other sources of benefits that I don’t include because I assume they are overlaps and thus lists 164.2 million people as receiving benefits. That’s over half the population.
Part II: The Current Stock Market Type Is Bull Quiet
The market type classification tells us what is happening today — not what is going to happen tomorrow. Since the election, the S&P has been strong although we are going into a relatively flat period now.
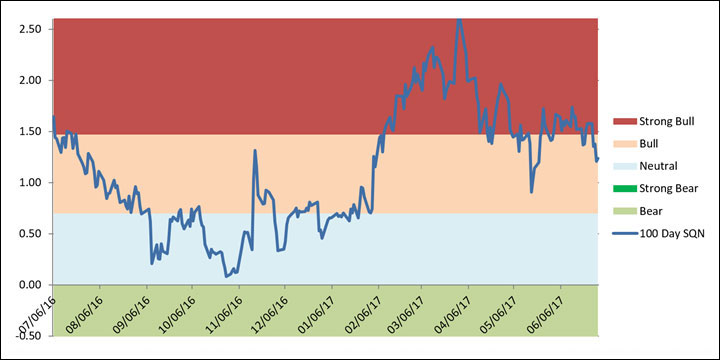
I use the Market SQN score for 100 days and a volatility measure to classify the market type. Right now the market is Bull Quiet. For reference, the market type for 200 days is Strong Bull Quiet while the market type for both 100 days and 50 days is Bull Quiet. The 25 day period direction is Neutral.
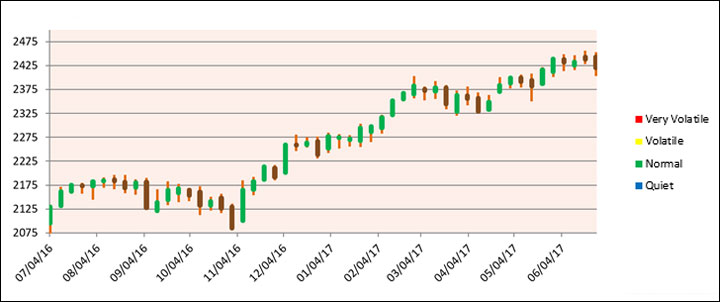
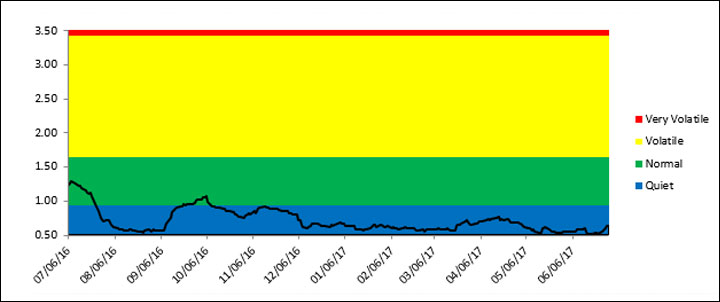
You’ll notice that the bar chart below was bullish from December through February, had a consolidation period, rose again, and now is going sideways again. Only the last two weeks have been down. Like last month, the S&P 500 has had 20 all-time new highs in the last 100 days and 4 of them occurred in the last month. That means that about one day in five over the last 100 days was an all-time high on the S&P 500 with the last one happening on June 19th.
|
|
|
Compare the price bar patterns to the Market SQN chart below. The market was rising slightly from mid-April to late May. The current flat period started a few weeks back and the market type direction has leveled off from Strong Bull to Bull.
|
|
Volatility has firmly been in the Quiet range since late last year. Right now, there is little danger in terms of volatility which is at the lowest that it has been for some time. Bear markets do not start from this kind of volatility.
|
|
|
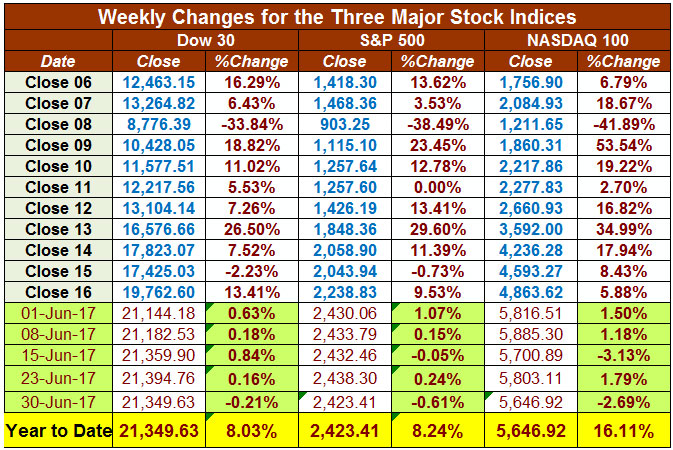
The table below reports the three major US Indices levels through June 30th. All three of the major market indices are up nicely for the first six months of the year and over last month. The S&P 500 is up 8.24% on the year, the Dow is up 8.03% and the NASDAQ 100 is up 16.11%. Are you up over 8% already for 2017? How about the 16% that the NASDAQ is up? This is a little like the 1990s. High tech stocks are on fire — even with the slight correction over the last three weeks.
Despite the Bull Quiet market type, in my opinion, this is one of the best markets for the average person that I have seen in a long time. Volatility is quiet so this is a perfect buy and hold market (where hold means having a 25% trailing stop). It’s were everyone looks like a genius. This is not about prediction. It’s about what the market is doing and the market is Bullish AND QUIET.
|
|
|
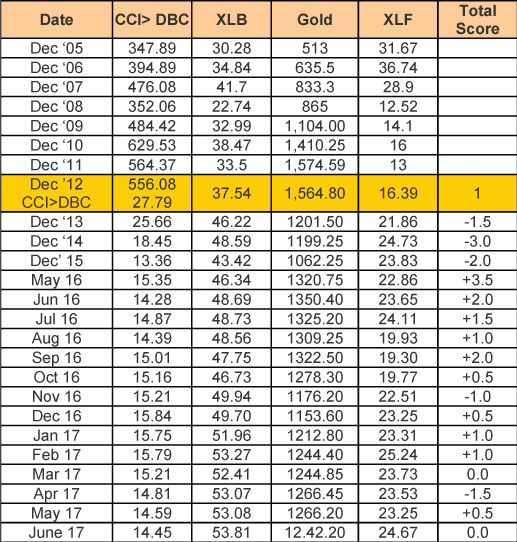
Part III: Our Four Star Inflation-Deflation Model
My model has generated mostly deflationary scores for the last few years. Deflation means that stuff generally becomes cheaper. In 2016, however, the model shifted results to the inflation side, which means that stuff tends to get more expensive. Markets move in correlation to inflation/deflation trends so it can be helpful to track these trends.
The tracking table below has historical and current year figures.
|
|
Here are the model components and how the prices looked at the end of June compared with two months back and six months back.
|
|
The score of 0.0 out of a possible 4.0 is Neutral so neither inflation nor deflation is very strong right now.
Part IV: Tracking the Dollar
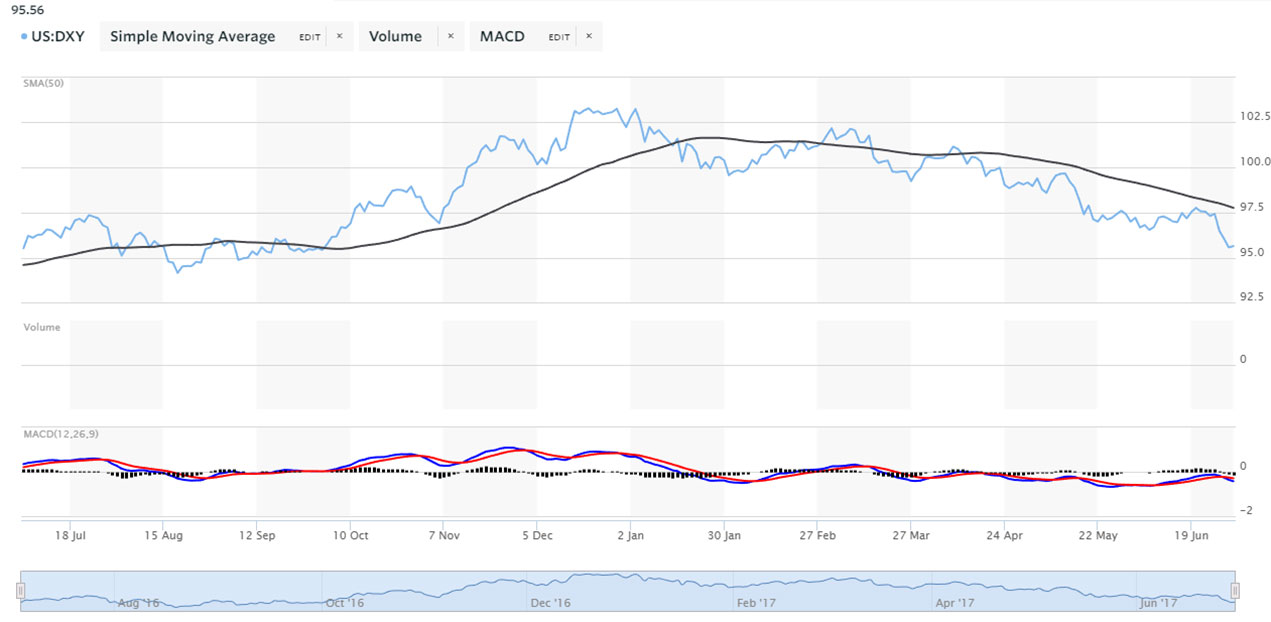
The US Dollar Index has been in a general downturn since January and is down nearly 7% since that time. That’s a huge decline despite the Fed raising interest rates. Perhaps the world measures the value of the US Dollar by what they think of our president. Don’t expect any significant interest rate hikes due to the size of our debt.
In October, we are going to present three workshops in London so it wouldn’t surprise me if the dollar continued to weaken against at least the British Pound until we return. (That would be the Tharp Effect in action — but remember it’s just a running joke that all too often seems to be true).
|
|
|
Graph from marketwatch.com
Conclusion
This market is strong. On top of that, the average person is not involved in the market. In fact, they are scared. They don’t buy investment books and they don’t go to conferences. This is the perfect scenario for those in the know to make a lot of money.
Chances are you won’t make huge money, but just buying and holding the NASDAQ 100 would have returned 16% on your money so far in the first half of this year. My guess (not a prediction) is that the S&P 500 will be up at least 15% by the end of the year — it returned nearly 10% last year. And who knows? The NASDAQ 100 could be up over 50% on the year. This reminds me a lot of the 1990s but again, this newsletter is not about prediction; it’s about telling you what is happening right now.
In April I concluded an article by saying that a market downturn is not close. To summarize that, the traditional causes of recessions, interest rate spikes, and oil price spikes are not close at all. The only possible danger to the market is if Donald Trump manages to get himself impeached or starts a war. Harry Dent (who is a major BEAR) says that Trump will resign and we will have a major crash. But don’t pay attention to major bears. Pay attention to what the market is saying.
We are in a bull market with low volatility. That’s a buy and hold investors dream (but have a 25% trailing stop).
Until next time, this is Van Tharp.
For the next two months, RJ Hixson will write the Monthly Update while I am traveling.
|
|
|
|
|
|
About the Author: Trading coach, and author, Dr. Van K. Tharp is widely recognized for his best-selling books and his outstanding Peak Performance Home Study program - a highly regarded classic that is suitable for all levels of traders and investors. You can learn more about Van Tharp www.vantharp.com.
|
|
|
|
|
|
|
|
|
Presented by Van Tharp
and Rebecca Price
|
|
|
|
|
|
|
|
|
|
If you make a last minute decision to come this weekend, give us a call. We can still accommodate you! 919 466-0043. Or, email [email protected].
|
|
|
|
|
|
August 5-7
Saturday-Monday
|
|
|
|
|
|
|
|
|
|
|
|
August 8-9
Tuesday-Wednesday
|
|
|
|
|
|
|
|
Dr. Ken Long begins his Day Trading Systems workshop by teaching you two day trading systems called the Frog and RLCO. Through his action-packed lectures students will gain an understanding of each system’s beliefs, rules, and variations.
Ken has been a long-time active trader and observer of the markets. He's noticed the consistent habit of prices for particular issues to move a certain amount. Much like a frog jumps when it hears a loud noise, prices tend to move a certain amount before they pause or move again. Different frogs are able to jump different distances, but each one tends to jump about the same distance as it did last time. Would it be possible to know about how far a stock’s price would move on any given day?
After attending this three-day workshop you qualify to stay on and live trade these same systems for the next two days alongside Ken. Plus attendees will receive follow up assistance in Ken's ongoing Chatroom for Traders.
Special Bonus: Free Membership in Powerful 'Chatroom' Plus Three Coaching Calls
Inspired by the powerful networking Ken has seen develop over the years at VTI, both through the Super Trader program and workshop attendees, he created and leads a group of traders with a shared interest in swing trading and intraday trading which he calls the Chatroom.
Ken and his chatroom members have been developing a daily community of practice to encourage a healthy and helpful environment to support each members' development as a trader.
And, as a way to maintain the spirit of cooperation experienced at the workshops after you are headed back home, you get free membership and access to this chatroom forum. And while this membership is free to workshop attendees, the value of this ongoing interaction and learning is likely as valuable the workshop itself.
|
|
|
|
Presented by Kim Andersson
Profit When Price Goes Nowhere: How to Successfully Trade Sideways Markets In Every Time Frame
|
|
|
|
August 11-13
Friday-Sunday
|
|
|
|
|
|
|
|
|
|
Announcing An Exclusive New Trading Workshop:
Sideways Market Strategies
Profit When Price Goes Nowhere:
How to Successfully Trade Sideways Markets In Every Time Frame
|
|
Kim Andersson covers a few objectives of the new Sideways Market Strategies course in this short video above.
|
|
Did you realize that no matter what time frame you trade or what method you use to measure them, Sideways markets happen between 59% and 65% of the time!
And yet scant attention is given to this market type. When you encounter them the task of trading becomes much more challenging, stressing your systems and your psychology beyond your normal comfort zone. This new workshop is the antidote to this under appreciated, and least understood market type.
AN EXTRA SPECIAL BONUS FROM YOUR INSTRUCTOR
As an extra added bonus, Kim Andersson has agreed to provide additional support to all Sideways Market Strategies attendees for the remainder of 2017! This is no small offer. Your class will get four monthly calls (1 hour each), as well as ongoing email support for months after the workshop. She will offer her feedback and expert guidance for any sideways trading issues you may have for the rest of 2017. This way you know that you can be fully prepared to trade in Sideways conditions and get your follow up questions answered.
|
|
|
|
Presented by Van Tharp
with co-presenter RJ Hixson
|
|
|
|
September 15-17
Friday-Sunday
|
|
|
|
|
|
|
|
|
|
NEW! Systems Thinking for Traders
Presented by Van Tharp
with co-presenter RJ Hixson
(more information coming soon)
|
|
|
|
September 19-21
Tuesday-Thursday
|
|
|
|
|
|
|
|
|
|
October 2017 LONDON, ENGLAND
|
|
|
|
Presented by Van Tharp
with co-presenter RJ Hixson
|
|
|
|
October 13-15
Friday-Sunday
|
|
|
|
|
|
|
|
|
|
Presented by RJ Hixson
and Van Tharp
|
|
|
|
October 17-19
Tuesday-Thursday
|
|
|
|
|
|
|
|
|
|
|
|
October 21-23
Saturday-Monday
|
|
|
|
|
|
|
|
|
|
Presented by Gabriel Grammatidis
|
|
|
|
November 10-12
Friday-Sunday
|
|
|
|
|
|
|
|
|
|
Presented by Gabriel Grammatidis
|
|
|
|
November 13-14
Monday-Tuesday
|
|
|
|
|
|
|
|
|
|
Podcast: Check out our first podcast from a few weeks ago. New podcasts coming soon.
|
|
The Super Trader Program Price Increase Deadline Is 26 Days Away
|
|
If you've ever wondered what it is like to be part of Van Tharp's Super Trader Program click on the short 4 minute video below to hear more about what our students have to say about their Super Trader journeys.
|

|
|
I plan to continually look for new things to model to help people become more successful traders and investors. And what we are working on now is doing everything we can to make the Super Trader Program, which I think is already unique and the best in the world, even better...We have about 10 open slots in the Super Trader Program for 2017. We’d like to make sure that everyone who wants to join this year can get in at the current rate, which goes up after July 31st. Right now the price of the program is $52,500 for the first three years. It will go up to $60,000 for the first three years in August 2017. As a result, for those who qualify*, we are running a one month special on the
program.
Now through July 31, We Have The Following Specials:
- A lump sum one-time payment of $50,000 (less applicable discounts**) will save people $10,000 over the new price.
- Three installment payments six months apart for the current price of $52,500 (less applicable discounts**) will save people $7,500 over the new price. This payment option spreads out the cost over a year's time — which I don’t do normally.
* To qualify for the ST program, applicants must first attend one of these workshops: Peak Performance 101, Infinite Wealth, or the Oneness Awakening Weekend. This allows me to personally assess your openness to the psychological part of the program and to gauge your level of commitment. To be eligible to submit an application for Super Trader before the August 1 price increase, only one workshop remains — Oneness Awakening Weekend on July 8-9.
** Previous purchases from VTI reduce your total cost of the ST program. Candidates can receive a credit for 100% of certain purchases! If you'd like more information, including any credits that are available to you, please email [email protected]
For more information about the program click here.
|
|
|
|
July 2017 System Quality Number™ Report
The SQN™ Report
by Van K. Tharp, Ph.D.
|
|
|
|
|
There are numerous ETFs that track everything from countries, commodities, currencies and stock market indices to individual market sectors. ETFs provide a wonderfully easy way to discover what’s happening in the world markets. I apply a version of my System Quality Number™ (SQN™) score to measure the relative performance of numerous markets in a world model.
The Market SQN score uses the daily percent change for input over a 100-day period. Typically, a Market SQN score over 1.47 is strongly bullish and a score below -0.7 is very weak. The following color codes help communicate the strengths and weaknesses of the ETFs in this report:
- Dark Green: ETFs with very strong Market SQN scores > 1.47
- Light Green: ETFs with strong Market SQN scores (0.70 to 1.47).
- Yellow: ETFs with slightly positive Market SQN scores (0 to 0.70). These are Neutral/Sideways
- Brown: ETFs with slightly negative Market SQN scores (0 to -0.7).
- Red: Very weak ETFs that earn negative Market SQN scores (< -0.7).
This is basically the same rating scale that we use for the Market SQN Score in the Market Update. The world market model spreadsheet report below contains a cross section of currently available ETFs; excluding inverse funds and leveraged funds. In short, it covers equity markets around the globe, major asset classes, equity market segments, industrial sectors, and major currencies.
World Market Summary — Equities & Currencies
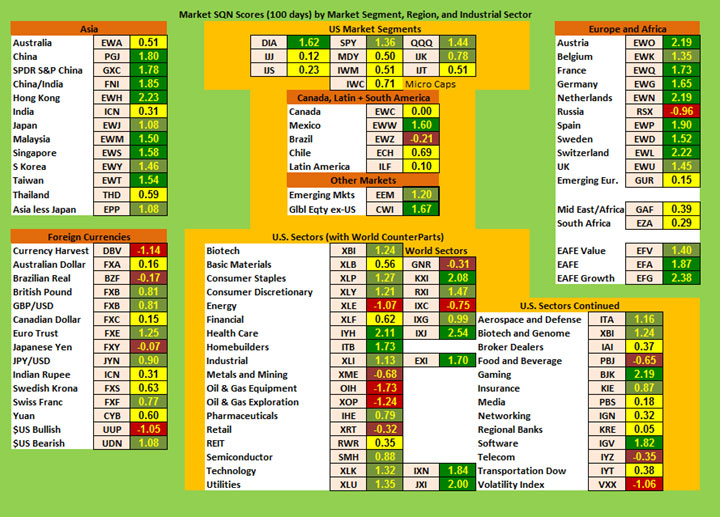
Each month we look at the equities markets across the globe by segment, region, and sector. This month the dollar is the weakest currency, being in the red with Market SQN™ score of -1.05. What’s interesting is that was the same score at the beginning of June. The value of the dollar influences everything on the chart and for that reason both Europe and Asian markets are looking strong.
The US equity market segments are no longer all dark green. In fact, only the DOW is dark green — SPY, QQQ, and JIK are light green. Remember last month that QQQ was dark green and over 3.0. Everything else is now yellow — but that’s also somewhat due the 7% drop we’ve had in the dollar since the beginning of the year. We now have brown and yellow showing up and in various sectors, we even have red — especially in Energy. In the other countries in the Americas, we have Mexico being dark green (pretty amazing), Brazil is brown, and all of the other countries in the Americas are now yellow. But remember the dollar is weak.
As a region, Asia has become stronger. Australia, Thailand and India are yellow but everything else is either green or dark green. We have seven dark green ETFs and three light green in Asia. Rated by strength they are: Hong Kong, China, Singapore, Taiwan, and Malaysia. Japan and South Korea are light green.
On the right hand side of the table, everything in Europe is dark green, except for Russia (not really Europe) which is red and Emerging Europe which is yellow. Three countries have ETFs with strength ratings over 2.0. They are The Netherlands, Switzerland, and Austria — the same as last month. South Africa, the rest of Africa, and the Middle East is yellow.
|
|
|
In currencies, the US Dollar is -1.05 for the second month in a row and is the only red currency. The Brazilian Real is brown as is the Japanese Yen. Light green currencies include the British Pound, the Euro, the Yen vs the USD, and the Swiss Franc. The Aussie dollar, the Canadian Dollar, the Rupee, the Swedish Krona, and the Chinese Yuan are all yellow.
In the US stock market, the dark green sectors are down in number from eight last month to four currently. Those are Homebuilders, Software, Health Care, and Gaming with the last two being new for this month. There are still plenty of light green sectors (11 of them), however, there are now four brown ones — Metals and Mining, Retail, Food and Beverage, and Telecom. And there are four red sectors: Energy, Oil and Gas Equipment, Oil and Gas Exploration, and Volatility.
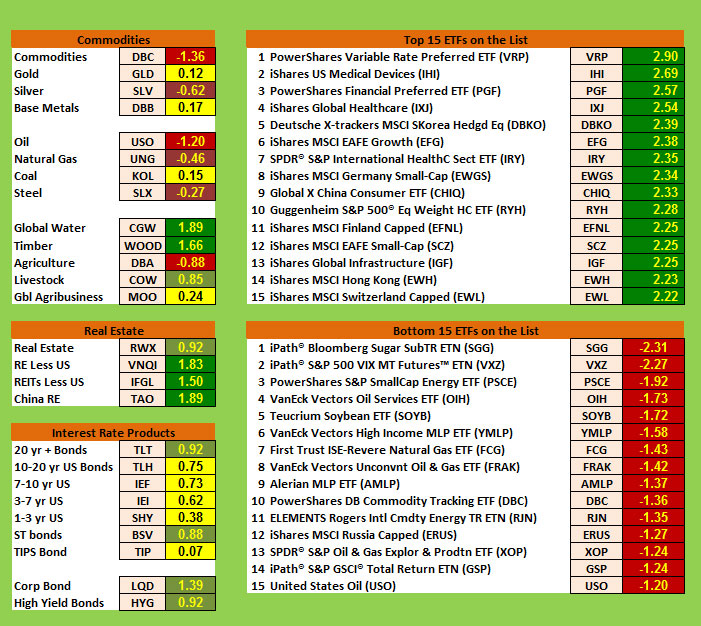
Commodities, Real Estate, Debt, and the Top and Bottom Lists
Commodities have had an interesting month. Commodities (DBC), Oil, and Agriculture are all red. Silver, Natural Gas, and Steel are brown. Gold, Base Metals, Global Agriculture and Coal are yellow. Livestock is light green while Timber and Global Water are dark green. Everything in real estate is green. Debt instruments are mostly yellow but short-term bonds, 20 year+ bonds, corporate bonds and high yield bonds are light green.
|
|
|
The Top Ranking List:
Last month, the top 11 of the top 15 ETFs had a Market SQN score over 3.0. This month nothing is over 3.0. That’s a huge drop off. And now the strength is in Health Care, Medical Devices, and a number of diverse countries like Switzerland, Hong Kong, and Finland.
The Bottom Ranking List:
This month’s bottom list is entirely red but only two ETFs (like last month) show scores lower than a -2 — which is the best we’ve seen in a while. Those are Sugar and Volatility. Energy issues still dominate the weakest ETFs.
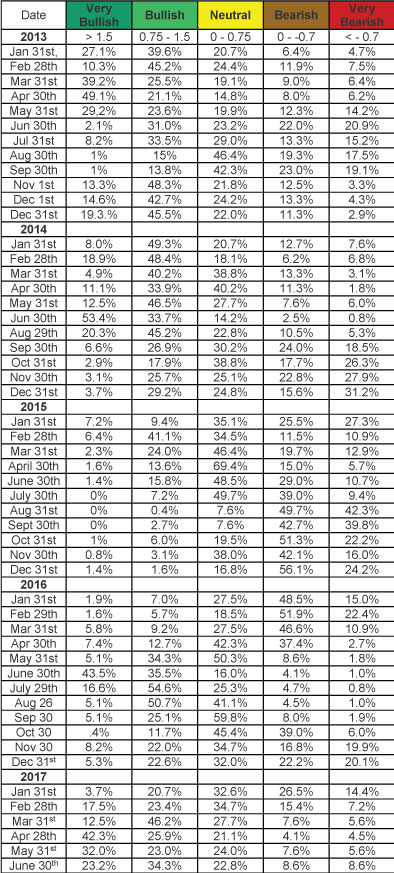
Summary
Let’s look at the summary table which measures the percentage of ETFs in each of the strength categories. You can see the distribution of the database by Market SQN score in bullish, neutral and bearish categories just below with the June 30th figures at the bottom of the table —
|
|
|
At the end of April, the split for bullish/neutral/bearish ETFs was 68%/ 21%/ 9%. At the end of June (two months later) the ratio is down to 57%/ 23%/ 17%.
Donald Trump continues to play the buffoon and now he’s under investigation so it’s not likely that he’ll get much done in office. I can’t imagine that he’ll serve more than one term. The media hates Trump and the markets love him.
Be careful to base your actions upon what IS happening, not what you think might happen. The markets always offer opportunities, but to capture those opportunities, you MUST know what you are doing. If you want to trade these markets, you need to approach them as a trader, not a long-term investor. We’d like to help you learn how to trade professionally because trying to navigate the markets without an education is hazardous to your wealth. All the beliefs given in this update are my own. Though I find them useful, you may not. You can only trade your own beliefs about the markets.
For the next two months, RJ Hixson will write the SQN Report while I am traveling.
|
|
|
|
FREE Book!
We pay for the book, you just pay for shipping.
Read Van’s Latest Book —
TRADING BEYOND THE MATRIX
The Red Pill for Traders and Investors
Eleven traders tell their stories about transforming
their trading results and lives, in this 400 plus page book.
Below is a brief video on how powerful this book is to traders.
|
|
|
|
Cary, NC Workshop Information
For a list of nearby hotels for our Cary, North Carolina locations,
click here.
Book your flight arriving to the Raleigh-Durham International Airport (RDU).
When traveling to a three-day course, it's best to arrive the evening before.
To help determine your arrival and departure times, see:
Questions? Click Here to Ask Van...
CONTACT US
If you no longer wish to receive our email updates, click the unsubscribe link in the bottom-left corner of this email.
This is a supplement to our subscription based newsletter, Tharp's Thoughts.
800-385-4486 * 919-466-0043 * Fax 919-466-0408
|
|
|
|
|