|
|
|
Tharp's Thoughts
Weekly Newsletter
|
|
|
|
|
|
|
|
-
Feature: May 2017 Market Update:
Strong Bull Quiet Market Type
by Van K. Tharp, Ph.D.
-
Workshops: June & July Workshops That Qualify You To Apply for The Super Trader Program
-
Tips: May 2017 System Quality Number™ Report
The SQN™ Report
by Van K. Tharp, Ph.D.
-
|
|
|
|
Come let us show you how these peak performance events will change your trading, your perspective on the markets, and most importantly, your perspective on how you interact with the markets.
|
|
|
|
May 2017 Market Update:
Strong Bull Quiet Market Type
by Van K. Tharp, Ph.D.
|
|
|
|
|
I always say that people do not trade the markets; they trade their beliefs about the markets. In that same way, I'd like to point out that these updates reflect my beliefs. I find the market update information useful for my trading, so I do the work each month and am happy to share that information with my readers. If your beliefs are not similar to mine, however, then this information may not be useful to you. Thus, if you are inclined to go through some sort of intellectual exercise to prove one of my beliefs wrong, simply remember that everyone can usually find lots of evidence to support their beliefs and refute others. Simply know that I admit that these are my beliefs and that your beliefs might be different.
These monthly updates are in the first issue of Tharp's Thoughts each month which allows us to get the closing data from the previous month. These updates cover 1) the market type (first mentioned in the April 30, 2008 edition of Tharp's Thoughts), 2) the debt statistics for the US, 3) the five-week status on each of the major US stock market indices, 4) our four-star inflation-deflation model, and 5) tracking the US dollar. I also write a report on the strongest and weakest areas of the overall market as a separate SQN™ Report. Significant market charges may mean the SQN Report comes out more than once a month.
Part I: The Big Picture
So what are the markets telling us now?
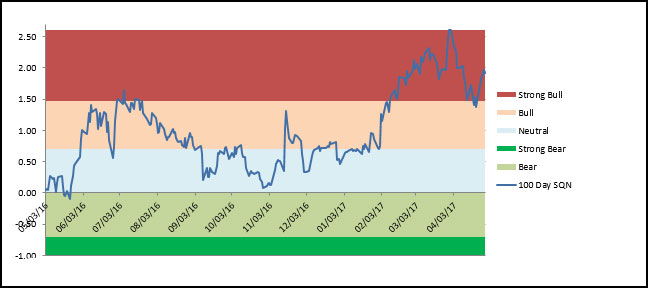
The markets have been quite strong since the Trump election. The Market SQN® score has been bullish pretty much since the election and is strongly bullish now.
|
|
|
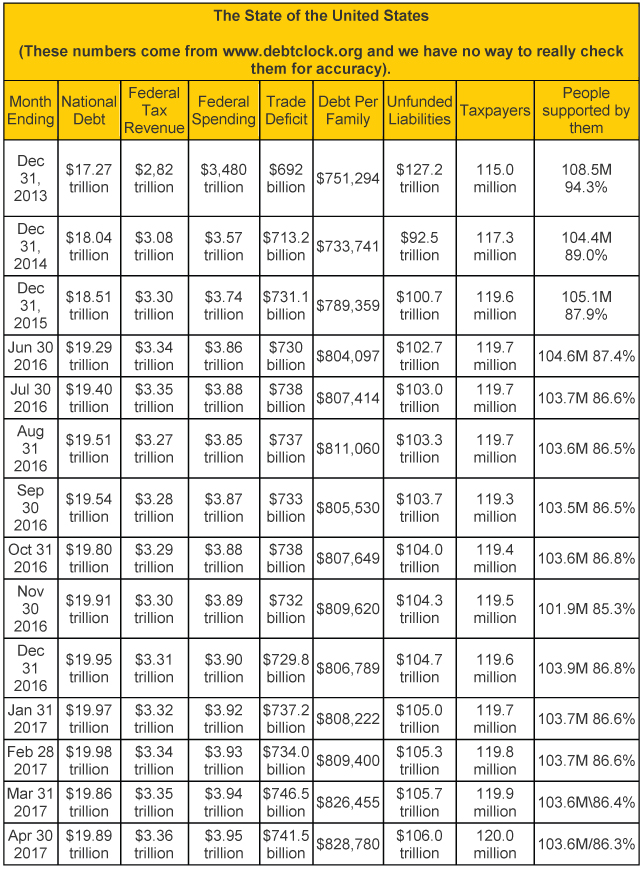
In late April 2016, usdebtclock.org said our official debt went over the $19 trillion mark. A year later, we are only $110 billion away from $20 trillion. Nevertheless, our politicians are doing their usual “wonderful” job of spending our money plus money they don’t have. Don’t expect Donald Trump to be any better than previous presidents. Trump wants to build a multibillion-dollar wall (that will basically be useless), reduce taxes, and increase the worst form of spending — war spending (framed as Defense).
Incidentally, the website says there are 120 million U.S. taxpayers. I add together US Retirees (50.8 million) food stamp recipients (42.2 million) and disabled people drawing social security (10.6 million). I don’t think there is any overlap here. Those groups total 103.6 million and that’s why I say that they constitute a group that’s 86.3% of the number of taxpayers. I could also include all government employees (23.5 million) as among those supported by taxpayers — but they do pay taxes. Remember about 10% of the taxpayers (12 million) pay most of the income tax revenue. By the way, the debt clock lists Medicaid, Medicare, and several other sources of benefits that I don’t include because I assume they are overlaps and thus lists 163.8 million people as receiving
benefits. That group makes up over half the population.
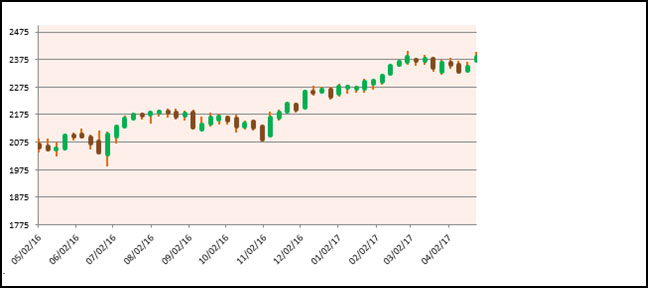
Part II: The Current Stock Market Type Is Strong Bull Quiet
The market type classification tells us what is happening today — not what is going to happen tomorrow. Since the presidential election in November, the S&P has been on fire. The Market SQN score for 100 days is now in Strong Bull mode. The Market SQN scores for 200 days and 25 days are both at bull readings and the 50-day period score is neutral. You’ll notice that the bar chart below turned up in November, had a consolidation period for the last few weeks, and now is starting to rise again.
|
|
|
|
Compare the price bar patterns above to the Market SQN chart below. The Market SQN score was neutral to bullish for much of last year up until February this year. Since then, it has been in the bull or strong bull range on the chart — the market has really been going up strongly. In fact, in the last 97 days the market has had 17 new all-time highs in the S&P500. But since March 1st, there have been no new all-time highs. Still, at the close on Friday, April 28th, we were only 11 points away from that most recent high on March 1.
|
|
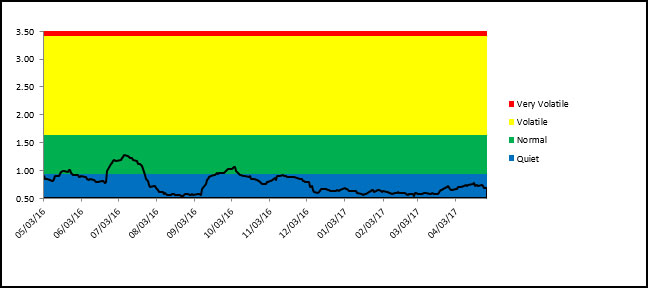
Volatility has been quiet for eleven of the last twelve months. Right now, there is little danger in terms of volatility.
|
|
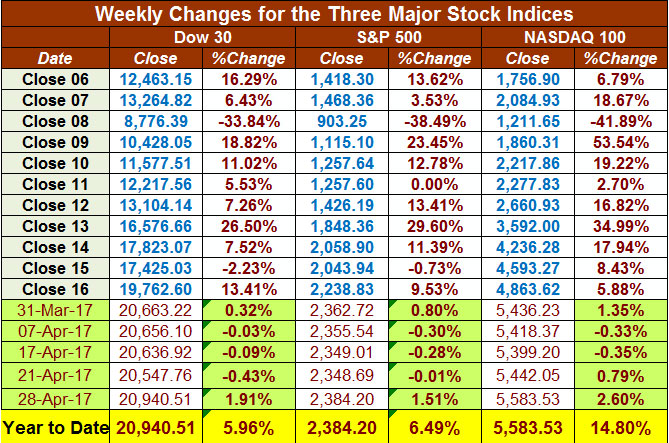
The table below reports the three major US Indices levels through Friday, April 28th. All three market indices are up nicely over the last month and for the first four months of the year. The S&P 500 is up 6.49% on the year, the Dow is up 5.96% and the NASDAQ 100 is up 14.8%. Are you up over 6% already for 2017?
In our recent survey of Tharp Thoughts readers, many people responded to our question by saying they were afraid to invest now or that they were waiting for a pullback to get into the market.
This is one of the best markets for the average person that I have seen in a long time — but people are afraid. The volatility is quiet. This is a perfect buy and hold market (which means have a 25% trailing stop) where everyone in the market looks like a genius. This is not about prediction. It’s about what the market is doing and the market is STRONG AND QUIET.
|
|
|
Part III: Our Four Star Inflation-Deflation Model
My model has generated mostly deflationary scores for the last few years. Deflation means that stuff generally becomes cheaper. In 2016, however, the model results shifted to the inflation side where stuff tends to get more expensive. Markets move in correlation with inflation/deflation trends so it can be helpful to track these trends.
The tracking table below has historical and current year figures.
|
|
Here are the model components and how the prices looked at the end of April compared with two months back and six months back.
|
|
The score of -1.5 out of a possible 4.0 is again deflationary.
Part IV: Tracking the Dollar
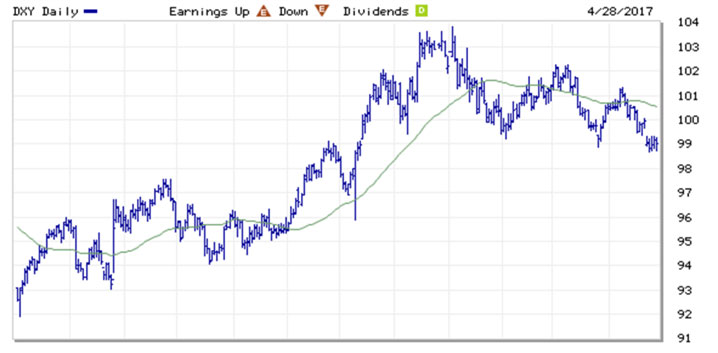
The US Dollar Index is suddenly looking much weaker and I’m not sure of a good reason. We’ve had interest rate increases (although don’t expect any significant raises due to the size of our debt), however, the chart clearly shows that the dollar has gone down about 5% since the first of the year when it was 104.
We will probably present workshops in Europe this fall so a weak dollar against the Euro or British Pound would not surprise me due to the well documented “Tharp Effect.” (That’s the running joke that all too often seems to be true — the dollar weakens whenever we travel out of the country.)
|
|
|
Conclusion
This market is strong. On top of that, the average person is not involved in the market. In fact they are scared. They aren’t buying investment books and they don’t go to trading conferences. What they do seem to be doing, however, is paying attention to newsletters that guarantee a 500% return. I listened to a webinar this week with 25,000 people attending and then 1,250 of them spent $1,500 on a newsletter — that’s $1.8 million dollars the publishing company made in a few hours. (Their “guarantee” simply means that if the newsletter doesn’t deliver readers the promised return, the readers get another year of the newsletter for free.)
Chances are the newsletter readers won’t make huge money, but just buying and holding the S&P 500 would have returned 6.49% on your money so far this year. My guess (not a prediction) is that holding the S&P will return at least double that figure by the end of the year. Last year, the S&P 500 returned nearly 10%.
In last month’s article, I concluded with comments about why a market downturn is not close.
To summarize those points, the traditional causes of recessions, interest rate spikes, oil price spikes are not close at all.
The only possible danger to the market is if Donald Trump manages to start a war or gets himself impeached. Bill Clinton had that problem (impeachment) and most people really liked Bill.
In the meantime, we are in a strong bull market with the possibility for a strong breakout in May after a recent flat consolidation.
Until next month, this is Van Tharp.
|
|
|
|
About the Author: Trading coach, and author, Dr. Van K. Tharp is widely recognized for his best-selling books and his outstanding Peak Performance Home Study program - a highly regarded classic that is suitable for all levels of traders and investors. You can learn more about Van Tharp www.vantharp.com.
|
|
|
|
|
|
|
|
|
PEAK PERFORMANCE 101 June 2-4
Peak Performance 101 is Dr. Tharp's core psychological workshop, and his most transformative course for over 20 years. If you want to know how great traders think, behave and act so you can achieve consistent and profitable results, without stress, then this workshop is for you. You will not only learn what makes a great trader great, but you will also find out what is holding you back. There are many ways you could be sabotaging your market experiences: overtrading, not pulling the trigger, over confidence or lack of confidence, or just making mistake after mistake. Van Tharp designed this workshop to help you break down barriers, as well as teach you specific tasks and
strategies that will improve your trading results overnight.
Workshop Objectives
Students will learn and begin to understand each of these objectives after attending Peak Performance 101:
- How great traders approach their craft and learn a daily procedure that resembles what they do.
- How you create your own experience in the market and how you are responsible for the results that you get.
- Become more aware of some of your own psychological issues that affect your performance as a trader/investor.
- Learn about expectancy, position sizing strategies and the power of big R-multiples through a simulation game. This game is also designed to help you observe your emotions in a setting in which only a small amount is at stake compared with what you will face in the market.
- Learn some of the variables that affect your emotions and how you can gain control over them.
- Learn to overcome self-sabotage through exercises done in the class.
- Students will get guidance on how to develop an ongoing program to work on themselves using the Super Trader Program as a model.
- Students will leave with a plan to make the maximum use of the workshop.
- Participants in this course will get to meet and network with some really great people who a lot in common with each other.
Peak 101 is required in order to proceed on to Peak 202 and above. Also Peak 101 is required to apply to the Super Trader Program. This June Peak 101 is the last one before the Super Trader Program price increase in July.
Attend all three June workshops and get an extra $900 discount!
PEAK PERFORMANCE 202 June 6-9
Workshop Objectives
This workshop has a team of instructors who will be focused on meeting these objectives:
|
- To teach you how to obtain greater control of your life and to give you a broader perspective of what is possible.
- To teach you how to create your own experiences and how you are responsible for the results that you get
- To help you use “Big I” to solve what seem like issues and keep you on course. To make you aware of some of your own psychological issues that affect your performance as a trader/investor.
- To teach you about games and the factors that affect games:
- Level of awareness
- The ability to make up rules
- Game domains
- Game rules
- To teach you your “Winning Strategy” and how - although it has been responsible for your successes - it holds you back from doing even more.
- To give you a procedure to re-invent yourself using advanced psychological principles.
- To allow you to meet and network with some really great people who have a lot in common with you.
|
|
PEAK PERFORMANCE 204
Modeling Great Trading Through Mental Strategies June 10-12
Workshop Objectives
The material presented in this new, advanced workshop is poised to make a dramatic impact on your life. While in attendance, you will gain understanding about how you are the central character in your story, and how you really create this story, and see how you can ultimately play an active role in shaping your own life. By thoroughly exploring how each of us uses mental strategies and the sequencing of thoughts, you will have the groundwork to continue to hone your skills throughout the workshop and beyond.
Learn the Mental Secrets for Getting What You Really Want!
Attending this cutting-edge workshop can translate into real profits and successes for you. The material presented in this three-day workshop will be information you can use to improve your life and increase your effectiveness, and is not the sort of thing that you can learn anywhere else.
This workshop is likely the only one of its kind, with such unique and powerful concepts geared toward traders — all in one place! Most importantly, the material presented is also quite practical, including plenty of exercises so you can incorporate the strategies you learn right into your daily life with ease. When you leave the workshop, these important strategies will become part of you.
Advanced Mental Exploration
If you have successfully completed Peak Performance 101, you have met the primary prerequisite to attend this course. However, we want to caution you that this workshop involves advanced mental exploration. You must be open to what goes on in your mind to appreciate the depth of this workshop. We will be doing a lot of work with sub-modalities so you should also have at least a little experience working within this framework.
|
|
|
|
The Super Trader Program has several openings available at our current rate. However, at the end of July the rate will increase. If you are considering joining we encourage you to get your application in now to "beat the rush" of new applicants that come in as the deadline approaches.
|
|
|
|
Presented by Van Tharp
with co-presenter RJ Hixson
|
|
|
|
|
|
|
|
|
|
|
Presented by Libby Adams and RJ HIxson
|
|
|
|
|
|
|
|
|
|
|
|
|
June 10-12
Saturday-Monday
|
|
|
|
|
|
|
|
|
|
Presented by Van Tharp
and Rebecca Price
|
|
|
|
|
|
|
|
|
|
|
|
|
August 5-7
Saturday-Monday
|
|
|
|
|
|
|
|
|
|
|
|
August 8-9
Tuesday-Wednesday
|
|
|
|
|
|
|
|
|
|
NEW! Trading in a Sideways Market
Presented by Super Trader graduate Kim Andersson
(more information about this workshop will be added soon)
|
|
|
|
August 11-13
Friday-Sunday
|
|
|
|
|
|
|
|
|
|
There is a possibility Dr. Tharp will be holding workshops in Europe this fall. More to come as that develops! When we confirm that location we will release dates for Sept, Oct and Nov.
The Super Trader Summit is in December.
|
|
|
|
May 2017 System Quality Number™ Report
The SQN™ Report
by Van K. Tharp, Ph.D.
|
|
|
|
|
There are numerous ETFs that track everything from countries, commodities, currencies and stock market indices to individual market sectors. ETFs provide a wonderfully easy way to discover what’s happening in the world markets. I apply a version of my System Quality Number™ (SQN™) score to measure the relative performance of numerous markets in a world model.
The Market SQN score uses the daily percent change for input over a 100-day period. Typically, a Market SQN score over 1.47 is strongly bullish and a score below -0.7 is very weak. The following color codes help communicate the strengths and weaknesses of the ETFs in this report:
- Dark Green: ETFs with very strong Market SQN scores > 1.47
- Light Green: ETFs with strong Market SQN scores (0.70 to 1.47).
- Yellow: ETFs with slightly positive Market SQN scores (0 to 0.70). These are Neutral/Sideways
- Brown: ETFs with slightly negative Market SQN scores (0 to -0.7).
- Red: Very weak ETFs that earn negative Market SQN scores (< -0.7).
This is basically the same rating scale that we use for the Market SQN Score in the Market Update. The world market model spreadsheet report below contains a cross section of currently available ETFs; excluding inverse funds and leveraged funds. In short, it covers equity markets around the globe, major asset classes, equity market segments, industrial sectors, and major currencies.
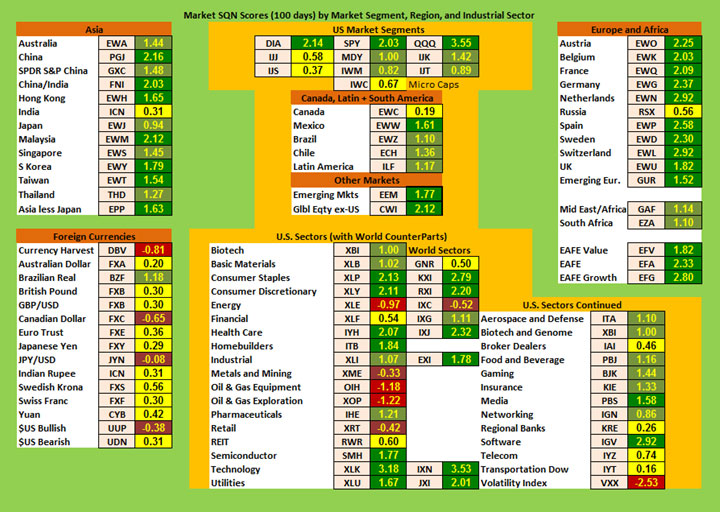
World Market Summary — Equities & Currencies
Each month we look at the equities markets across the globe by segment, region, and sector. For the last two months, the US dollar was very strong and that definitely influenced the model because everything in it is dollar based. This month, the dollar turned brown and has become one of the weakest currencies. And probably for that reason, both Europe and Asian markets are looking strong this month.
The US equity market segments are no longer all dark green. The three major indices (all large caps) are still very strong with the growth and blended segments strong in the mid-caps and small caps. Microcaps and smaller value stocks are now yellow.
In the Americas, all of the other counties are green except Canada, which is yellow. Even Mexico, which has been so weak after Trump’s election is now dark green.
As a region, Asia has grown stronger. India is still yellow but everything else is either light green or dark green with the three strongest markets being China, Malaysia, and South Korea. Singapore and Australia have moved back from dark green to light green over the last month, reversing what they did the prior month.
On the right hand side of the chart, everything in Europe is dark green, except for Russia (though not really Europe). Even the African countries have moved up to light green.
|
|
|
In currencies, only the US Dollar moved from light green last month to brown this month. The Canadian Dollar and the Japanese Yen are also brown. The only light green currency is the Brazilian Real while most currencies are now yellow.
In the US, consumer staples, consumer discretionary, financial, health care, homebuilders, semiconductors, technology, media, software and utilities are all dark green. That’s a long list but it’s smaller than the dark green list last month. The only yellow sectors are financials, REITS, broker deals, regional banks, telecom, and transportation. The browns include metals & mining and retail. And this month, there are some reds other than just volatility. They include energy, oil & gas equipment, oil and gas exploration.
The performance of the broker dealers ETF confirms what I’ve been saying about what’s going on right now. The markets are very strong but the broker dealers sector remain weak. People have not been participating in this market.
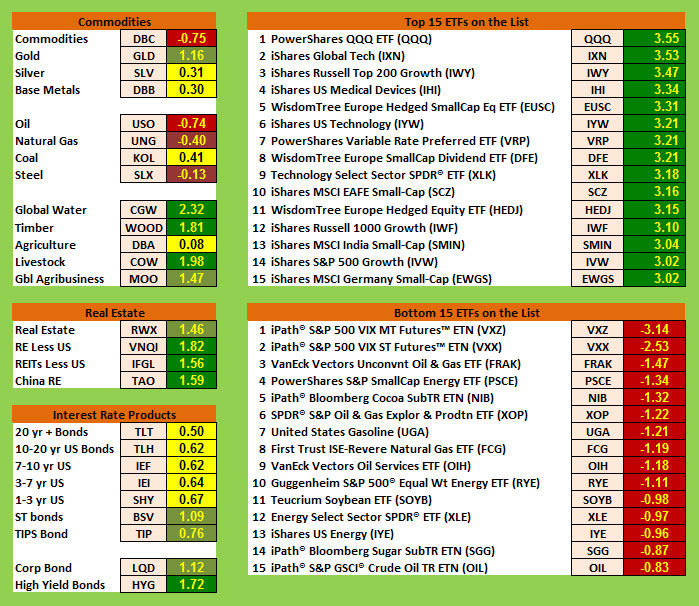
Commodities, Real Estate, Debt, Top and Bottom Lists
Commodities have had an interesting month. Blended commodities and oil are red. Natural gas and steel are brown. Silver, base metals, coal, and agriculture are yellow. Gold and global agribusiness are light green while global water, timber and livestock are dark green. This is somewhat surprising considering the markets expectancies about Trump’s infrastructure buildup.
With the Fed raising interest rates twice now and possibly again sometime soon, real estate is now all green. Long term debt is back to yellow. Short-term bonds, corporate bonds, and inflation-protected bonds are light green; however, junk bonds are now dark green. Junk bonds are now the safety value of income. People are not worried about corporate failures.
|
|
|
The Top and Bottom Ranking List:
I thought it was amazing last month when three ETFs on the top list had scores above 3.0. This month, every ETF on the top 15 has an SQN score over 3.0. I don’t remember ever seeing that before. And they are mostly major stock indices such as the top one — QQQ. Technology and growth are very strong.
This month’s bottom list is entirely red but only two ETFs scored lower than -2, which is the best we’ve seen in a while. Volatility ETFs hold the lowest scores in the model but VXX is above a -3 this month. Most of the weak ETFs are debt related instruments — which currently have low yields — but now energy has crept onto the list. I’ve heard rumors that there is an new alternative fuel instead of oil — it was an advertising gimmick for some newsletter webinar which I didn’t bother with so I’m not sure. There is talk also about hydrogen fuel cells and extracting methane from crystals in Alaska, however, I don’t think either of those are a short-term concern for the oil companies.
Summary
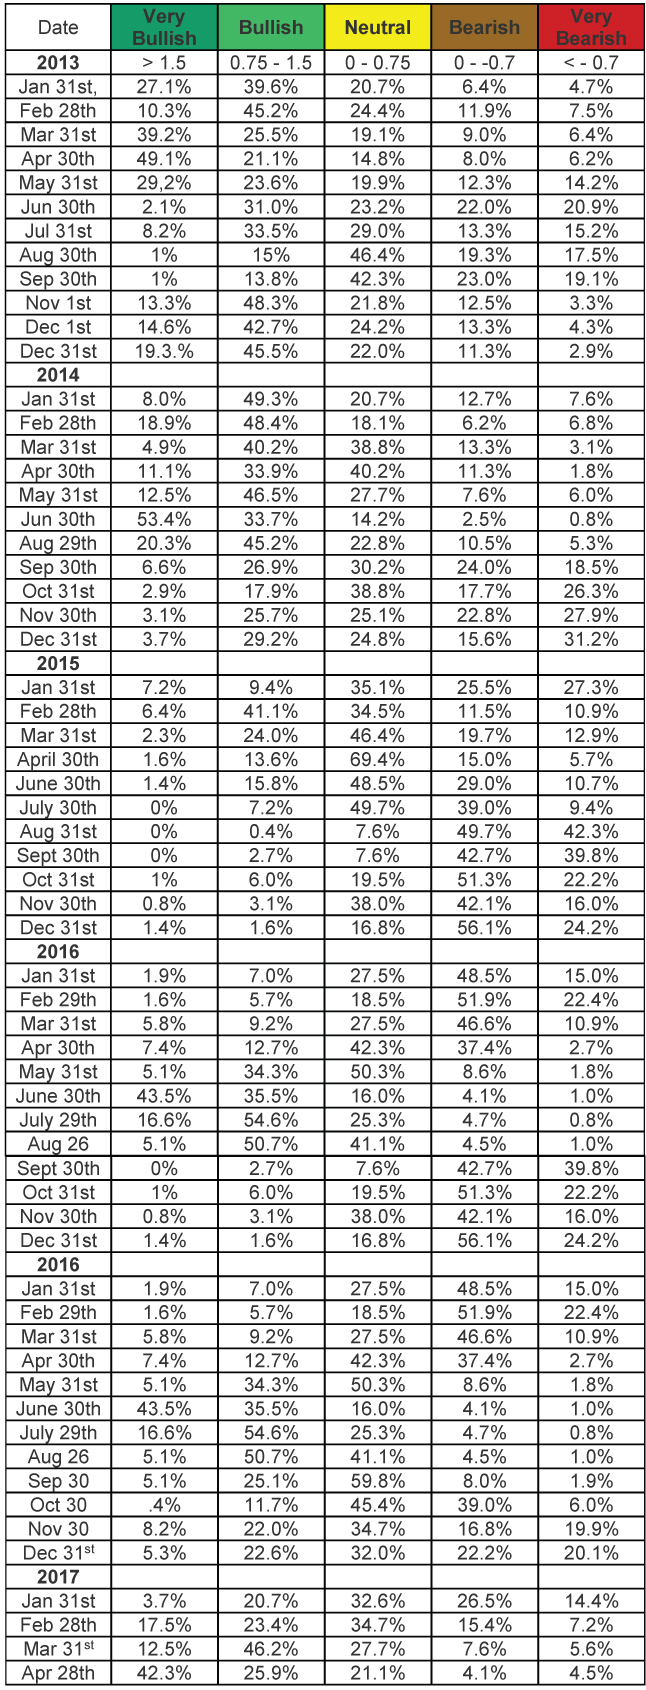
Let’s look at the summary table which measures the percentage of ETFs in each of the strength categories. You can see the previous monthly figures for the distribution of the database by Market SQN score in bullish, neutral and bearish categories just below.
This table has the database distribution for nearly the last four years —
|
|
|
At the end of March, the split for bullish/neutral/bearish ETFs was 58.7%/27.7%/13.2%. This month it’s still even more bullish at 68.2%/21.1%/8.6%.
Be careful to base your actions upon what IS happening, not what you think might happen. The markets always offer opportunities, but to capture those opportunities, you MUST know what you are doing. If you want to trade these markets, you need to approach them as a trader, not a long-term investor. We’d like to help you learn how to trade professionally because trying to navigate the markets without an education is hazardous to your wealth. All the beliefs given in this update are my own. Though I find them useful, you may not. You can only trade your own beliefs about the markets.
|
|
|
|
FREE Book!
We pay for the book, you just pay for shipping.
Read Van’s Latest Book —
TRADING BEYOND THE MATRIX
The Red Pill for Traders and Investors
Eleven traders tell their stories about transforming
their trading results and lives, in this 400 plus page book.
Below is a brief video on how powerful this book is to traders.
|
|
|
|
Cary, NC Workshop Information
For a list of nearby hotels for our Cary, North Carolina locations,
click here.
Book your flight arriving to the Raleigh-Durham International Airport (RDU).
When traveling to a three-day course, it's best to arrive the evening before.
To help determine your arrival and departure times, see:
Questions? Click Here to Ask Van...
CONTACT US
If you no longer wish to receive our email updates, click the unsubscribe link in the bottom-left corner of this email.
This is a supplement to our subscription based newsletter, Tharp's Thoughts.
800-385-4486 * 919-466-0043 * Fax 919-466-0408
|
|
|
|
|