|
|
|
Tharp's Thoughts
Weekly Newsletter
|
|
|
|
|
|
|
|
-
Feature: January 2017 Market Update:
Bull/Neutral Quiet Market Type, By Van K. Tharp, Ph.D.
-
Workshops: Early Enrollment Discounts End Next Week for January Workshops!
-
Tips: January 2017 System Quality Number™ Report, By Van K. Tharp, Ph.D.
-
|
|
|
|
All Van Tharp Products, Home Study Courses, Workshop Videos, Audio Downloads and Books Are On Sale
But the discounts will expire TODAY. Get that item you have been wondering about now. And remember, most products come with a satisfaction guarantee. If it's not for you, you can ask for a refund. You can learn more about each item through this link:
|
|
|
|
January 2017 Market Update:
Bull/Neutral Quiet Market Type
by Van K. Tharp, Ph.D.
|
|
|
|
|
I always say that people do not trade the markets; they trade their beliefs about the markets. In that same way, I'd like to point out that these updates reflect my beliefs. I find the market update information useful for my trading, so I do the work each month and am happy to share that information with my readers. If your beliefs are not similar to mine, however, then this information may not be useful to you. Thus, if you are inclined to go through some sort of intellectual exercise to prove one of my beliefs wrong, simply remember that everyone can usually find lots of evidence to support their beliefs and refute others. Simply know that I admit that these are my beliefs and that your beliefs might be different.
These monthly updates are in the first issue of Tharp's Thoughts each month which allows us to get the closing data from the previous month. These updates cover 1) the market type (first mentioned in the April 30, 2008 edition of Tharp's Thoughts), 2) the debt statistics for the US, 3) the five-week status on each of the major US stock market indices, 4) our four-star inflation-deflation model, and 5) tracking the US dollar. I also write a report on the strongest and weakest areas of the overall market as a separate SQN™ Report. Significant market charges may mean the SQN Report comes out more than once a month.
Part I: The Big Picture
So what are the markets telling us now?
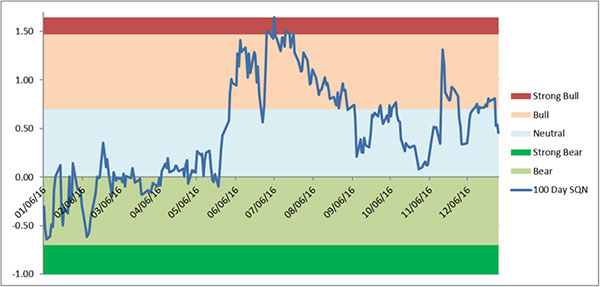
The Markets have been quite strong since the Trump election. The Market SQN® 100 has been neutral for the last three days of December but it was Bullish for much of December. The Market SQN score for 200 days is Bull, for 50 days - Bull, and for 25 days - Neutral. Every time period except for 100 days, however, has been in the Strong Bull range within the last 15 trading days. The S&P 500 has actually reached 9 new all-time highs in the last 100 days. Because of this pattern I’m calling the market direction Bull/Sideways, just like last month.
|
|
|
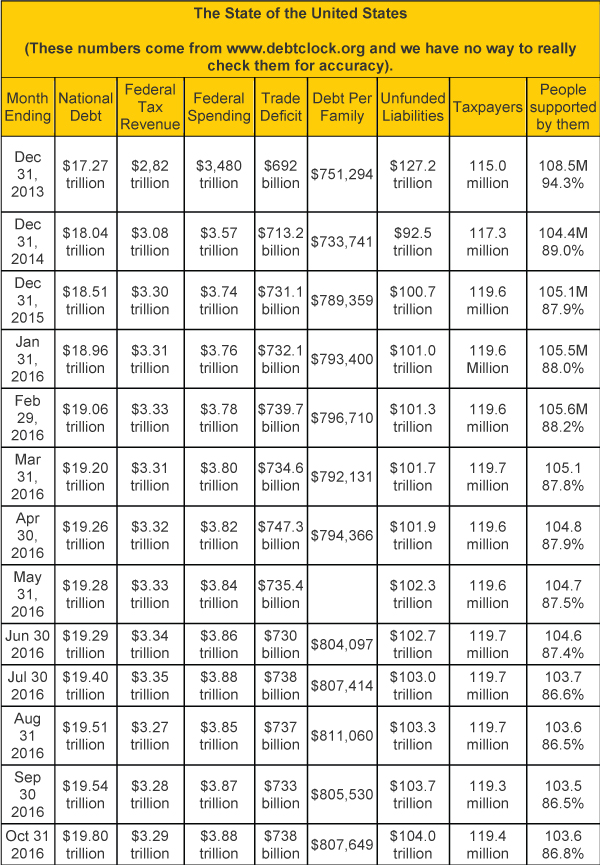
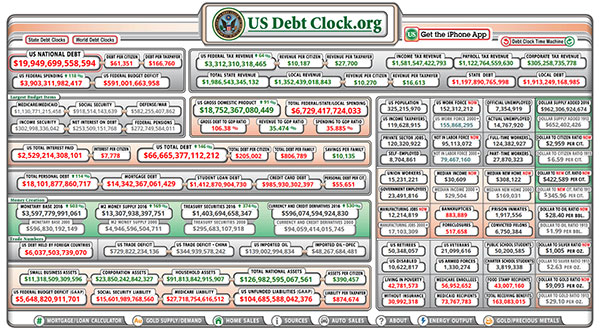
In late April 2016, usdebtclock.org said our official debt went over the $19 trillion mark and now we are almost at $20 trillion. So our politicians continue doing their usual “wonderful” job of spending our money plus money they don’t have.
Incidentally, this website says there are 119.6 million U.S. taxpayers. I add together US Retirees (50.3 million) food stamp recipients (43.0million) and disabled people drawing social security (10.6 million). I don’t think there is any overlap here. Those groups total 103.9 million and that’s why I say that they constitute a group that’s 86% of the number of taxpayers. I could also include all government employees (23.5 million) as among those supported by taxpayers — but they do pay taxes. Remember about 10% of the taxpayers (11.96 million) pay most of the tax revenue. By the way, the debt clock lists Medicaid, Medicare, and several other sources of benefits that I don’t include because I assume they are overlaps and thus lists 163.1 million people as receiving benefits. That’s over half the population of the US. I’m now a member of that group as I was required to start taking Social Security payments after I turned 70. I guess I shouldn’t complain as I never thought I’d collect any of it.
|
|
|
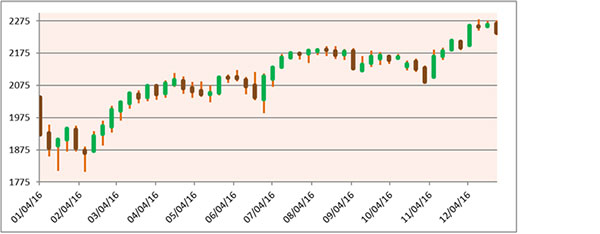
Part II: The Current Stock Market Type Is Bull/Neutral Quiet
The market type classification tells us what is happening today – not what is going to happen tomorrow. All through October, the market moved mostly sideways in a relatively tight range. Since the election, however, it has been up except for the last week of December - which was probably some tax related selling. You can see this fairly easily just looking at the S&P price chart below of weekly bars going back one year. What’s interesting is that all the pundits said that the stock market actions during the election were favoring Clinton and that the market would crash if Trump won. But just the opposite has occurred. The only negative influence on the market has been some interest rate fears because the Fed has now raised rates twice.
|
|
|
Compare the price bar pattern to the Market SQN chart below. As the uptrend from the February through July period transitioned into the flat period from August to today, you can see the Market SQN score weakening from Bull to Neutral. Most of the other time periods where we measure the Market SQN on the S&P are also quite strong. Volatility is low so if the market remained strong through next month, I would not be surprised.
|
|
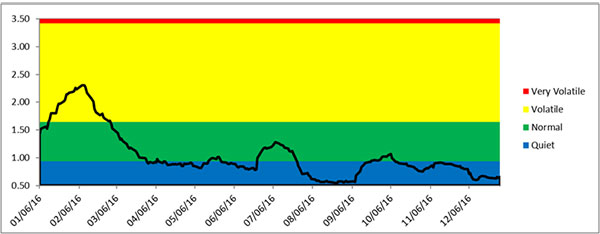
While volatility rose into the normal range in late September/early October for a few days, it has settled in the Quiet range since then.
|
|
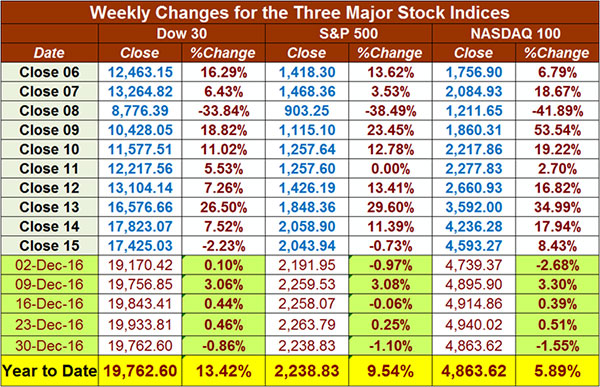
The table below reports the three major US Indices levels through the last trading day of the year, Friday, December 30th. All three market indices are up nicely for the year — and thanks to the Trump rally those gains increased almost 50% in the last month. The S&P 500 is up nearly 10% on the year, the Dow is up 13.4%, and the NASDAQ 100 5.89%. Did your trading in 2016 beat the indexes? Hopefully so.
|
|
Part III: Our Four Star Inflation-Deflation Model
My model has generated mostly deflationary scores for the last few years. Deflation means that stuff generally becomes cheaper. 2016, however, has seen a shift to inflationary scores in the model which means that stuff has tended to get more expensive. Markets move in correlation to inflation/deflation trends so it can be helpful to track these trends.
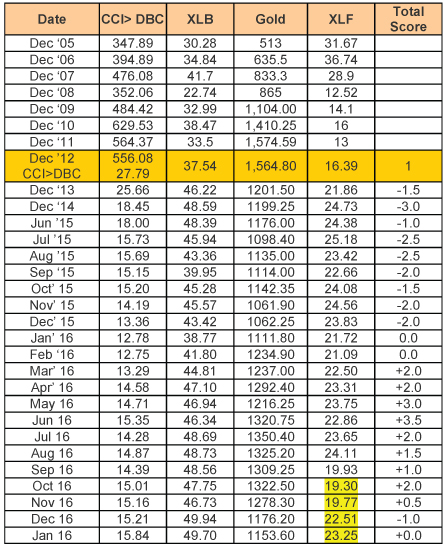
The tracking table below has historical and current year figures.
|
|
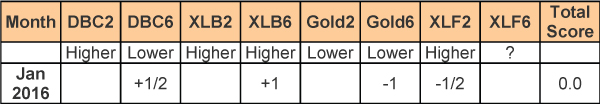
Here are the model components and how the prices looked at the end of February compared with two months back and six months back.
|
|
|
The score of 0.0 out of a possible 3.5 is neutral again.
Note: XLF recently had a share split and declared a dividend. We have four months of new XLF data so I am using only the two-month change portion of the XLF component. When we have six months of new data (two months from now), I will start using the long term XLF portion of the model again so both portions of all four components will generate the score.
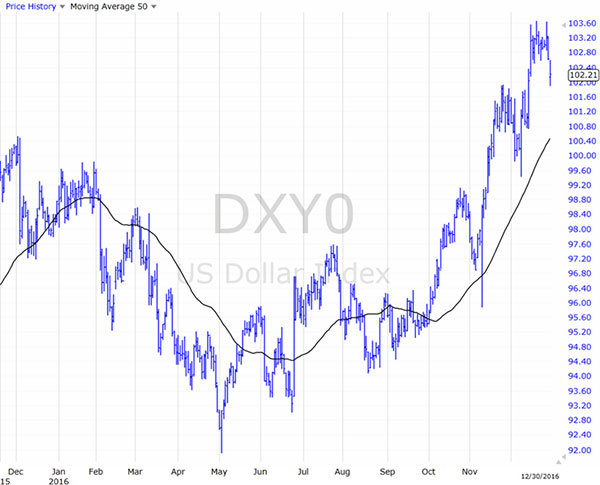
Part IV: Tracking the Dollar
The US Dollar Index remains very strong because the Fed raised interest rates for the second time this year. It’s now up at the 102-103 range which is the strongest it has been in some time. The USD is now almost at par with the Euro. If the “Van Effect” holds, perhaps it’s time to start watching the Singapore dollar (we are having workshops in Singapore in next month, so I’ll be traveling there. I always joke that whenever I travel internationally, the local currency goes up and the dollar goes down in value).
By the way, I believe the best trading opportunities in the foreseeable future are in Forex. We are presenting a Forex Trading workshop in Singapore in February. Normally, we go to Australia this time of year but we cannot present any technical workshop there due to certain laws.
So many Australians now trade Forex (more than half of recent Sydney workshops) that we decided to provide an easy way to learn some proven Forex systems — all based on psychological edges. So the February Forex Workshop is a great opportunity for anyone within a flight or two of Singapore. I’ll also be teaching Peak Performance 101 Workshop in February, the first one in Singapore in perhaps 10 years.
|
|
|
Conclusion
Most of 2016 was relatively flat with a slight uptrend bias. The S&P was up nearly 10% for the year and since Trump won the presidency, we have had a nice rally. One might say that last year was a fairly good one for the market. Hopefully, you managed to make 10%+ in your accounts last year.
I’m writing an article on the state of the market for next week’s newsletter so I won’t add any more comments here.
Until next week, this is Van Tharp.
|
|
|
|
|
|
About the Author: Trading coach, and author, Dr. Van K. Tharp is widely recognized for his best-selling books and his outstanding Peak Performance Home Study program - a highly regarded classic that is suitable for all levels of traders and investors. You can learn more about Van Tharp www.vantharp.com.
|
|
|
|
|
|
|
|
|
$700 Early Enrollment Discounts Expire NEXT WEEK on Peak Performance 101 and Blueprint For Trading Success in January.
Attend them both and get an additional $500 discount!
|
|
|
|
Presented by Van Tharp
with co-presenter RJ Hixson
|
|
|
|
January 20-22
Friday-Sunday
|
|
|
|
|
|
|
|
|
|
Presented by Van Tharp
and RJ Hixson
|
|
|
|
January 24-26
Tuesday-Thursday
|
|
|
|
|
|
|
|
|
|
Presented by Gabriel Grammatidis
|
|
|
|
February 18-20
Saturday-Monday
|
|
|
|
|
|
|
|
|
|
Presented by Mr. Gabriel Grammatidis
|
|
|
|
February 21-22
Tuesday-Wednesday
|
|
|
|
|
|
|
|
|
|
|
|
February 24-26, 2017
Friday-Sunday
|
|
|
|
|
|
|
|
|
|
Presented by R. J. Hixson
and Kirk Cooper
|
|
|
|
|
|
|
|
|
|
|
|
|
March 7-9
Tuesday-Thursday
|
|
|
|
|
|
|
|
|
|
Presented by Van Tharp
and Rebecca Price
|
|
|
|
March 18-19
Saturday-Sunday
|
|
|
|
|
|
|
|
|
|
Presented by Van Tharp
with co-presenter RJ Hixson
|
|
|
|
March 31-April 2
Friday-Sunday
|
|
|
|
|
|
|
|
|
|
Presented by RJ Hixson
and Kirk Cooper
|
|
|
|
April 4-6
Tuesday-Thursday
|
|
|
|
|
|
|
|
|
|
|
|
April 8-10
Saturday-Monday
|
|
|
|
|
|
|
|
|
|
January 2017 System Quality Number™ Report
The SQN™ Report
by Van K. Tharp, Ph.D.
|
|
|
|
|
There are numerous ETFs that track everything from countries, commodities, currencies and stock market indices to individual market sectors. ETFs provide a wonderfully easy way to discover what’s happening in the world markets. I apply a version of my System Quality NumberTM (SQN™) score to measure the relative performance of numerous markets in a world model.
The Market SQN score uses the daily percent change for input over a 100-day period. Typically, a Market SQN score over 1.47 is strongly bullish and a score below -0.7 is very weak. The following color codes help communicate the strengths and weaknesses of the ETFs in this report:
- Dark Green: ETFs with very strong SQN 100 scores > 1.47
- Light Green: ETFs with strong SQN 100 scores (0.70 to 1.47).
- Yellow: ETFs with slightly positive Market SQN scores (0 to 0.70). These are Neutral/Sideways
- Brown: ETFs with slightly negative Market SQN scores (0 to -0.7).
- Red: Very weak ETFs that earn negative Market SQN scores (< -0.7).
This is basically the same rating scale that we use for the Market SQN Score in the Market Update. The world market model spreadsheet report below contains a cross section of currently available ETFs; excluding inverse funds and leveraged funds. In short, it covers equity markets around the globe, major asset classes, equity market segments, industrial sectors, and major currencies.
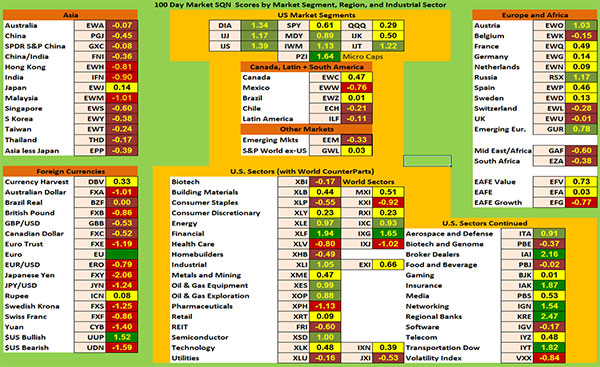
World Market Summary — Equities & Currencies
Each month we look at the equities markets across the globe by segment, region, and sector. I want to caution everyone that the US Dollar (UUP) has a Market SQN™ 100 reading of 1.52 at the end of December and is dark green. Since the entire World Market Model is based upon the US Dollar, its strength could make foreign markets look much weaker than they actually are; they might be weak only relative to the strong US Dollar.
This month, the model shows strengthening prices in the US and weaker prices in most of the rest of the world. This is just as we would suspect with a super strong US Dollar.
All of the US market segments are light green with three yellows and one dark green (Microcaps). The latter suggest a lot of speculation in the last 100 days. The other countries in the Americas are yellow to red - which you might expect with a Trump presidency. Mexico is red while Chile and Latin America are brown. Canada and Brazil are both neutral.
As a region, Asia has one yellow country (Japan) but the rest are red or brown. That’s a function of Trump’s expected trading plans and the strong dollar. The red markets are Hong Kong, India, and Malaysia. I would expect India to be weak right now since it basically destroyed its cash market over the last few months as the government voided all cash notes bigger than 500 rupees (500 rupees is about $7US). So this would be like the US government getting rid of all of our paper bills larger than $5. Indians had until Dec. 30 to deposit their cash in banks but if they brought in too much, they had to show receipts to explain its source. If the government didn’t like the explanation, it could tax the deposit at 90% or just confiscate it all. So basically — there is no cash in their cash based economy at the moment and that’s why the Indian stock market is down.
On the right hand side of the chart, Austria and Russia are light green but everything else in Europe/Africa is yellow except for Switzerland and the UK — both brown (but still close to neutral).
|
|
|
In currencies, only the US Dollar is dark green. Everything else is brown or red - but remember all currencies are being stated relative to the strong US Dollar. Ironically the Rupee is yellow. Probably the damage is already done there and the government will be coming out with new currency bills including (my understanding) a long overdue 2,000 Rupee note.
In the US, the financial sector is dark green (they like a Trump presidency and the possibility of a lot of deregulation). Other dark green sectors include Broker Dealers, Insurance, Networking, Regional Banks, and Transportation. Light green areas include Energy, Oil and Gas Equipment, Oil and Gas Exploration, Semiconductors, Aerospace and Defense. Pharmaceuticals and Volatility are both red. While Biotech, Consumer Staples, REITS, Utilities, Biotech and Genome, Food and Beverage, and Software are all brown. Everything else is neutral.
|
|
|
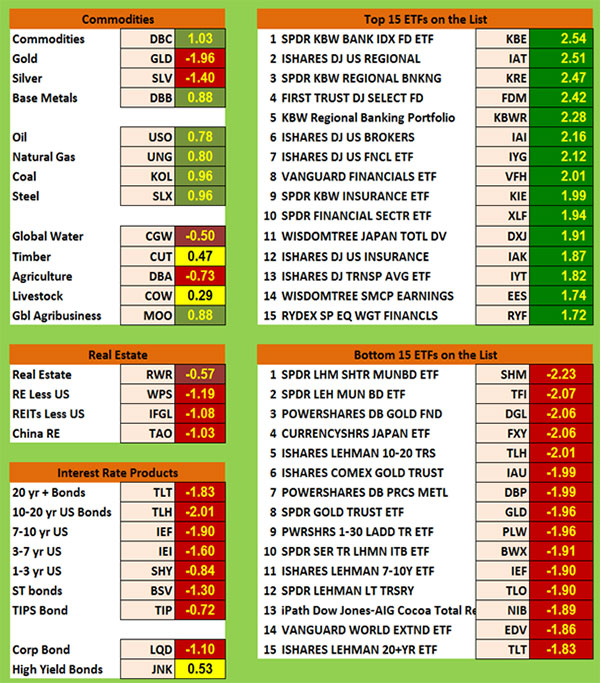
Commodities, Real Estate, Debt, Top and Bottom Lists
Commodities have had an interesting month. Except for Gold, Silver, and Agriculture being red with Global Water being brown, everything else looks bullish. Oil, Gas, Coal, Steel, Global Agribusiness, Commodities, and Base Metals are all light green. Timber and Livestock are both yellow.
With the Fed raising interest rates twice now, the real estate and debt sections are all red/brown except for High Yield Bonds which are yellow.
The Top Ranking List:
All of the top 15 ETFs are dark green with 8 of them having scores above 2.0. These include many of the ETFs we’ve been talking about with Brokers, Regional Banks, and finance issues being way up on the chart. The market is expecting financial deregulation under Trump and expecting his administration to undo everything that has been put in place after the global financial crisis. That’s what’s expected so banks are doing really well.
The Bottom Ranking List:
This month’s bottom list is entirely red — but it’s not as bad as last month with only five ETFs below -2.0 and none below -3.0. Remember that last month, we had 3 ETFs below -3.0 which I’d never seen before. The really weak areas include the former darling category — Muni Bonds. The bottom list also includes Gold, the Japanese Yen, and many debt instruments.
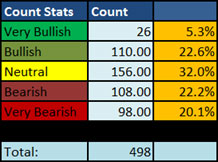
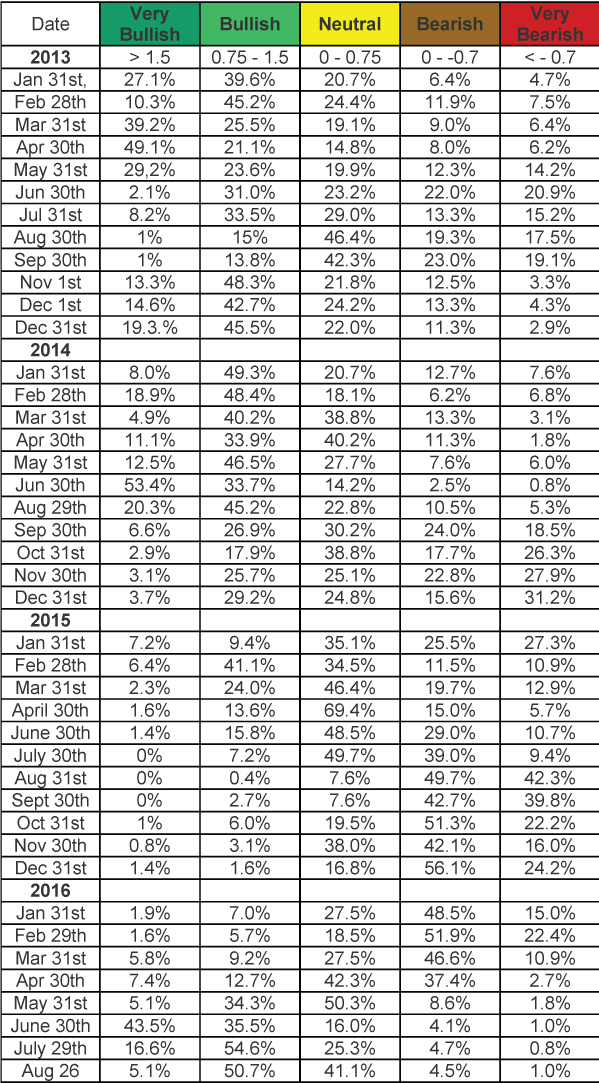
Summary
Let’s look at the summary table which measures the percentage of ETFs in each of the strength categories. You can see the Dec 31st figures for the distribution of the database by Market SQN score in bullish, neutral and bearish categories just below.
|
|
|
This table has the database distribution for nearly the last four years —
|
|
|
In November, the split for bullish/neutral/bearish ETFs was 30%/ 35%/ 37% which is basically balanced. This month it’s still pretty balanced at 28%/ 32%/ 40% but shifting toward bearish.
Conclusion
So Donald Trump is our next president. The markets did not even have a year-end tax selling cycle as everything continued to move up. Watch for next week’s newsletter as I’ll give a market outlook for 2017 — something I normally don’t do but I think things have changed.
Until next month this is Van Tharp.
Be careful to base your actions upon what IS happening, not what you think might happen. The markets always offer opportunities, but to capture those opportunities, you MUST know what you are doing. If you want to trade these markets, you need to approach them as a trader, not a long-term investor. We’d like to help you learn how to trade professionally because trying to navigate the markets without an education is hazardous to your wealth. All the beliefs given in this update are my own. Though I find them useful, you may not. You can only trade your own beliefs about the markets.
|
|
|
|
$700 Early Enrollment Discounts End Next Week for January Workshops!
- Two Peak Performance 101 Workshops Coming. Cary, NC and Singapore
- Blueprint For Trading Success (only offered once each year), January, Cary, NC
- For the first time, Forex Trading Systems Workshop in Singapore
|
|
|
|
FREE Book!
We pay for the book, you just pay for shipping.
Read Van’s Latest Book —
TRADING BEYOND THE MATRIX
The Red Pill for Traders and Investors
Eleven traders tell their stories about transforming
their trading results and lives, in this 400 plus page book.
Below is a brief video on how powerful this book is to traders.
|
|
|
|
Save Over $500, For A Limited Time Only
|
|
|
|
|
|
Ken Long's systematic approach to swing trading with 5 distinct trading systems. This course has over 10 hours of instruction with significant follow-along documents included for students to download.
Review the videos as many times, and as often as you like, for one full year. Plus, you receive a bonus workshop at no extra charge—Dr. Van Tharp's Tharp Think Essentials!
You can complete this course at your own pace, from the comfort of your own home or office, and access the materials as many times as you wish during your 1-year subscription period.
|
|
|
|
Take a look at this video from Ken to learn more about this course.
|
|
We have extensive information about the Swing Trading System e-learning course, including how to purchase...click the link below!
|
|
|
|
Cary, NC
For a list of nearby hotels for our Cary, North Carolina locations,
click here.
Book your flight arriving to the Raleigh-Durham International Airport (RDU).
When traveling to a three-day course, it's best to arrive the evening before.
To help determine your arrival and departure times, see:
Questions? Click Here to Ask Van...
CONTACT US
If you no longer wish to receive our email updates, click the unsubscribe link in the bottom-left corner of this email.
This is a supplement to our subscription based newsletter, Tharp's Thoughts.
800-385-4486 * 919-466-0043 * Fax 919-466-0408
|
|
|
|
|