|
|
|
Tharp's Thoughts
Weekly Newsletter
|
|
|
-
Feature: December 2016 Market Update: Bull/Neutral Quiet Market Type, by Van K. Tharp, Ph.D.
-
Workshops: Singapore Workshop Finalized! Forex Trading Systems and more...
-
Tip: December 2016 System Quality Number™ Report, by Van K. Tharp, Ph.D.
-
|
|
|
|
Two Peak Performance 101 Workshops Coming Soon:
A January Peak Performance 101 in Cary, NC &
A February Peak Performance 101 in Singapore
For the first time, VTI is bringing the
Forex Trading Systems Workshop to Singapore
|
|
|
|
December 2016 Market Update:
Bull/Neutral Quiet Market Type
by Van K. Tharp, Ph.D.
|
|
|
|
|
We are sending you two newsletters this week. So, in addition to the issue sent Wednesday, I wanted to get this most recent market update to you before I start presenting at the Super Trader Summit this weekend.
I recently returned from a trip to Egypt and Jordan. The Egyptian Pound doubled in value just before I arrived, so that was a nice exception to the normal rule where the US Dollar goes down against local currencies when Van travels. The Jordanian Dinar is pegged to the US Dollar so there’s no fluctuations in the currency rate.
Egypt was interesting in that they have lost 80% of their tourist trade since 9/11. It’s been a big shock to the economy, and they are really trying to encourage tourists. The country is full of tourist police whose job is to make sure the tourists are okay. In Egypt the vendors were saying, “It’s only a dollar.” But if you showed any interest, they were suddenly trying to get $20.
In Jordan, on the other hand, $200 gets you a fixed 140 Dinar. Tourist prices were very high in Jordan — mosaic tables were quoted at 5,000 Dinar — which is $7,000. There was some bargaining room, but the high prices were quite a shock after spending time in Egypt. Jordan has one of the top 30 economies in the world but the standard of living is supposed to be about 25% cheaper than the US. I certainly couldn’t tell that from the prices we saw. I’ll be writing a full article on my Egypt Jordan trip soon.
Also, I’d like to comment on money in India. As you may know India suddenly decided that their 1000 and 500 Rupee notes were no longer valid. To put that into perspective, when you travel to India and get spending money (say $500), that translates into about 32,000 Rupees. Thirty-two 1000 Rupee notes is a lot of paper to put into a wallet but suddenly the biggest bill that’s valid is the 100 rupee note. Converting $500 would mean I would now have to carry 320 100 Rupee notes. It’s a little like the US deciding that all paper currency is no longer valid except for the dollar bill. The 1000 and 500 Rupee notes will be totally worthless after December 31st so masses of people are going to banks to deposit their notes. If someone has a large amount of cash and the government doesn’t like their story for how they got it, they tax people 50% on that money. And if someone refuses to say how they got their money or they can’t prove how they got it, then they get taxed at 90%.
What’s interesting is that people could decide that the 500 and 1000 Rupee notes have value regardless of what the government says and they could just continue to use them — but that’s not happening. Money is all made up and the governments get to decide what pieces of paper are legitimate and how much each piece of paper is worth. India is an example of just what governments are capable of doing with money.
Now, let's examine what the current market conditions look like.
I always say that people do not trade the markets; they trade their beliefs about the markets. In that same way, I'd like to point out that these updates reflect my beliefs. I find the market update information useful for my trading, so I do the work each month and am happy to share that information with my readers. If your beliefs are not similar to mine, however, then this information may not be useful to you. Thus, if you are inclined to go through some sort of intellectual exercise to prove one of my beliefs wrong, simply remember that everyone can usually find lots of evidence to support their beliefs and refute others. Simply know that I admit that these are my beliefs and that your beliefs might be different.
These monthly updates are in the first issue of Tharp's Thoughts each month which allows us to get the closing data from the previous month. These updates cover 1) the market type (first mentioned in the April 30, 2008 edition of Tharp's Thoughts), 2) the debt statistics for the US, 3) the five-week status on each of the major US stock market indices, 4) our four-star inflation-deflation model, and 5) tracking the US dollar. I also write a report on the strongest and weakest areas of the overall market as a separate SQN™ Report. Significant market charges may mean the SQN Report comes out more than once a month.
Part I: The Big Picture
So what are the markets telling us now?
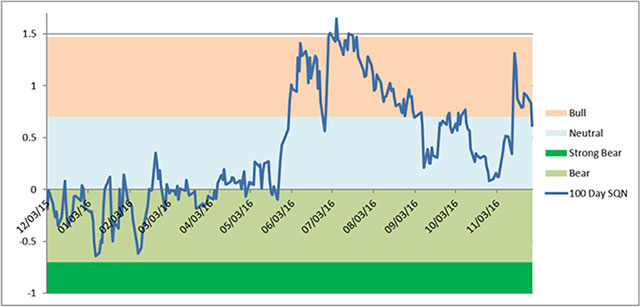
The 100 day Market SQN score turned sideways (Neutral) on November 29th after being bullish since November 15th. The Market SQN 200 day score is now in strong bull and the Market SQN scores for 50 days and 25 days are both in the bull range. My guess is that it’s probably safe to call the market bullish now despite the short term drop into sideways territory. I’d need more data to believe otherwise so that’s why we are saying the market type has a Bull/Neutral direction right now.
|
|
|
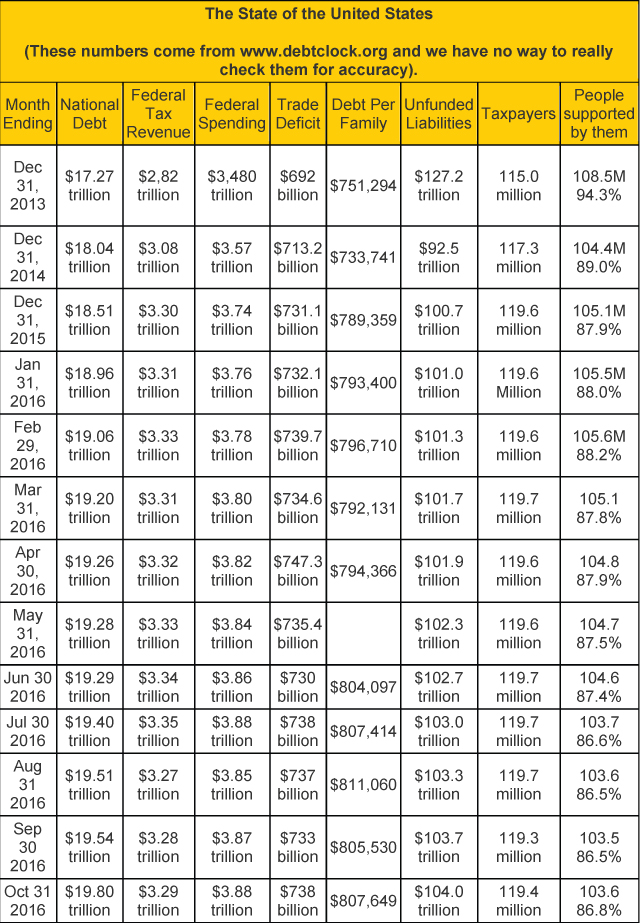
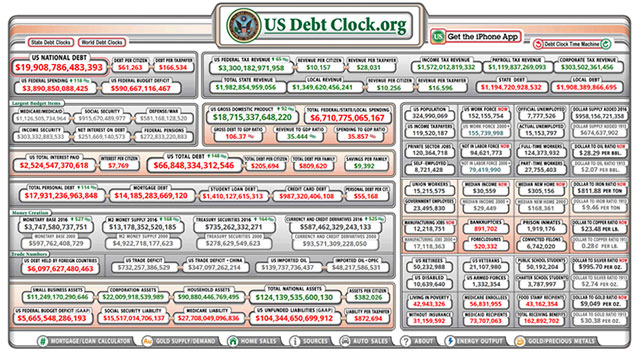
In late April 2016, usdebtclock.org said our official debt went over the $19 trillion mark and now we are almost at $20 trillion. So our politicians are doing their usual “wonderful” job of spending our money plus money they don’t have.
Incidentally, the website says there are 119.5 million U.S. taxpayers. I add together US Retirees (50.2 million) food stamp recipients (41.3million) and disabled people drawing social security (10.6 million). I don’t think there is any overlap here. Those groups total 103.6 million and that’s why I say that this group constitutes 86.5% of the number of taxpayers. I could also include all government employees (23.5 million) as among those supported by taxpayers — but they do pay taxes. Remember about 10% of the taxpayers (11.95 million) pay most of the tax revenue. By the way, the debt clock lists Medicaid, Medicare, and several other benefit recipients that I don’t include because I assume they are overlaps and thus included in the 162.5 million people receiving benefits.
|
|
|
Part II: The Current Stock Market Type Is Bull/Neutral Quiet
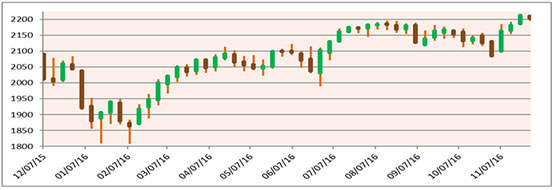
The market type classification tells us what is happening today — not what is going to happen tomorrow. All through October, the market continued to move mostly sideways in a relatively tight range. You can see that fairly easily just looking at the S&P chart below of weekly bars going back one year. What’s interesting is that all the pundits said that the steady stock market action in October was favoring Clinton and that it would crash if Trump won. But what has actually happened? Just the opposite occurred. The only negative influence on the market has been some interest rate fears because the Fed is saying they’ll raise rates this month — December.
|
|
|
Compare the price bar pattern to the Market SQN chart below. As the uptrend from the February through July period transitioned into the flat period from August through October, you can see the Market SQN score weakening from Bull to Neutral. If the market were to drift down in the coming month, we could see the score move into Bear territory for the January update.
|
|
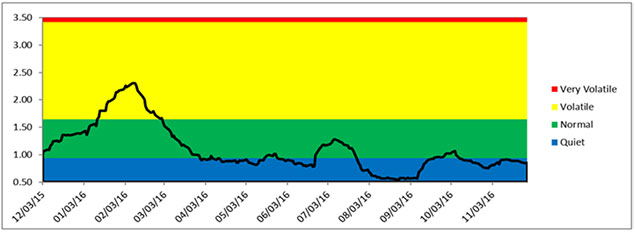
While volatility rose into the normal range in late September/early October for a few days, it has remained in the Quiet range since then.
|
|
If you needed additional confirmation of the quiet conditions, consider that the S&P is up .5% from 100 days back (early June) — even though we’ve had some new all-time highs recently.
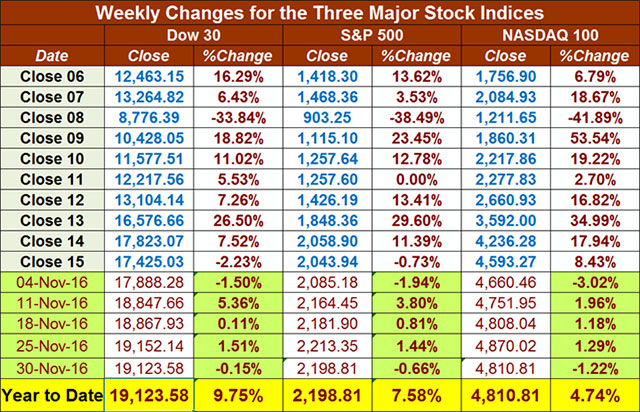
The table below reports the three major US Indices levels through Wednesday November 30th. All three market indices are up for the year — and thanks to the Trump rally those gains increased almost 50% last month. Has your trading in 2016 generated market-beating performance figures? Hopefully so. The S&P 500 is up nearly 8% on the year and the Dow nearly 10%.
|
|
Part III: Our Four Star Inflation-Deflation Model
My model has generated mostly deflationary scores for the last few years. Deflation means that stuff generally becomes cheaper. In 2016, however, there has been a shift to inflation which means that stuff tends to get more expensive. Markets move in correlation to inflation/deflation trends so it can be helpful to track these trends.
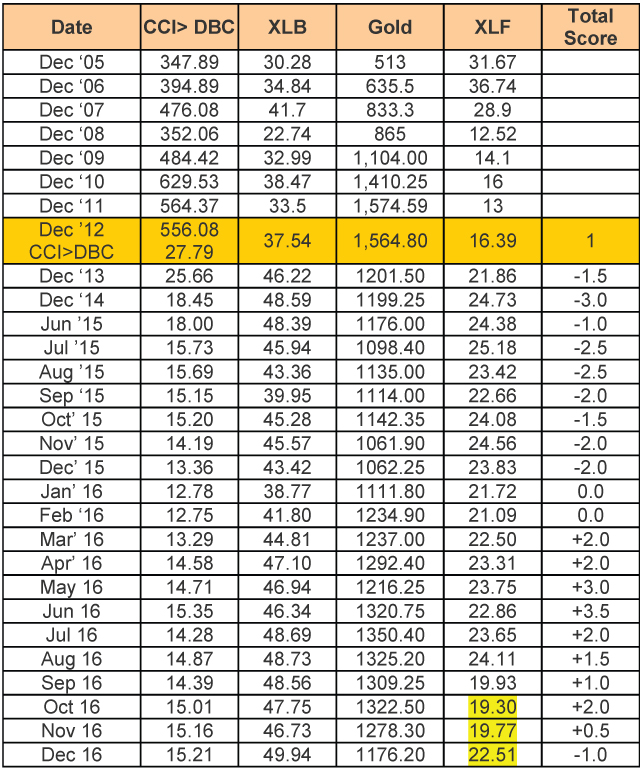
The tracking table below has historical and current year figures.
|
|
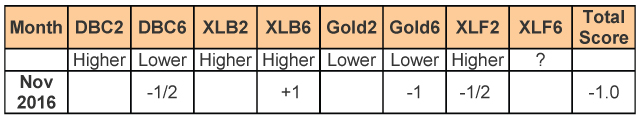
Here are the model components and how the prices looked at the end of February compared with two months back and six months back.
|
|
|
The score of -1.0 out of a possible 3.5 is starting to indicate deflationary pressures again.
Note: XLF recently had a stock split and declared a dividend. As a result, I will use the other three full components of the model. We have three months of new data so I have used only the two month change portion of the XLF component. When we have six months of new data, I will start using the long term XLF portion of the model again.
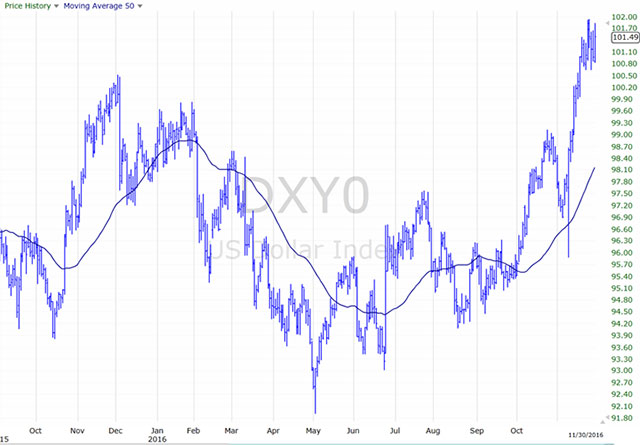
Part IV: Tracking the Dollar
The US Dollar Index still is within a very long term sideways zone. In October, though, it broke out of a short term range and nearly reached 100. And then after the election it went up to its new recent highs at nearly 102. It now stands at 101.5 which is the highest it has been in some time. So the pundits would tell us that currency traders are either expecting an rate increase or that they like Donald Trump. “Who knows?” We can say the dollar is on a short term uptrend right now.
|
|
|
Conclusion
Most of the year has been relatively flat with a slight uptrend bias. Since Trump won the presidency we have had a nice rally and one might say that 2016 has been a fairly good year for the market. I know a Vedic astrologer who has predicted the election correctly for the last 30 years using the birthdates of the candidates. This one, however, he got wrong. His excuse? There were three possible birth times for Clinton and he really wanted her to win so he picked the one that gave her a strong win.
Until next month, this is Van Tharp.
|
|
|
|
|
About the Author: : Trading coach, and author, Dr. Van K. Tharp is widely recognized for his best-selling books and his outstanding Peak Performance Home Study program—a highly regarded classic that is suitable for all levels of traders and investors. You can learn more about Van Tharp www.vantharp.com.
|
|
|
|
We will be in Singapore in February with Gabriel's Forex Trading Systems and Dr. Tharp's Peak Performance 101.
|
|
|
|
January 2017
Register now before the holiday season gets hectic.
|
|
|
|
Presented by Van Tharp
with co-presenter RJ Hixson
|
|
|
|
January 20-22
Friday-Sunday
|
|
|
|
|
|
|
|
|
|
Presented by Van Tharp
and RJ Hixson
|
|
|
|
January 24-26
Tuesday-Thursday
|
|
|
|
|
|
|
|
|
|
Presented by Gabriel Grammatidis
|
|
|
|
February 18-20
Saturday-Monday
|
|
|
|
|
|
|
|
|
|
Presented by Mr. Gabriel Grammatidis
|
|
|
|
February 21-22
Tuesday-Wednesday
|
|
|
|
|
|
|
|
|
|
|
|
February 24-26, 2017
Friday-Sunday
|
|
|
|
|
|
|
|
|
|
March 2017 — Dates Confirmed and Courses Open for Registration
|
|
|
|
Presented by R. J. Hixson
and Kirk Cooper
|
|
|
|
|
|
|
|
|
|
|
|
|
March 7-9
Tuesday-Thursday
|
|
|
|
|
|
|
|
Presented by Van Tharp
and Rebecca Price
|
|
|
|
March 18-19
Saturday-Sunday
|
|
|
|
|
|
|
|
|
|
More 2017 dates will be announced soon!
|
|
|
|
December 2016 System Quality Number™ Report The SQN™ Report
by Van K. Tharp, Ph.D.
|
|
|
|
|
There are numerous ETFs that track everything from countries, commodities, currencies and stock market indices to individual market sectors. ETFs provide a wonderfully easy way to discover what’s happening in the world markets. I apply a version of my System Quality Number™ (SQN™) score to measure the relative performance of numerous markets in a world model.
The Market SQN score uses the daily percent change for input over a 100-day period. Typically, a Market SQN score over 1.47 is strongly bullish and a score below -0.7 is very weak. The following color codes help communicate the strengths and weaknesses of the ETFs in this report:
- Dark Green: ETFs with very strong SQN 100 scores > 1.47
- Light Green: ETFs with strong SQN 100 scores (0.70 to 1.47).
- Yellow: ETFs with slightly positive Market SQN scores (0 to 0.70). These are Neutral/Sideways
- Brown: ETFs with slightly negative Market SQN scores (0 to -0.7).
- Red: Very weak ETFs that earn negative Market SQN scores (< -0.7).
This is basically the same rating scale that we use for the Market SQN Score in the Market Update. The world market model spreadsheet report below contains most currently available ETFs; excluding inverse funds and leveraged funds. In short, it covers equity markets around the globe, major asset classes, equity market segments, industrial sectors, and major currencies.
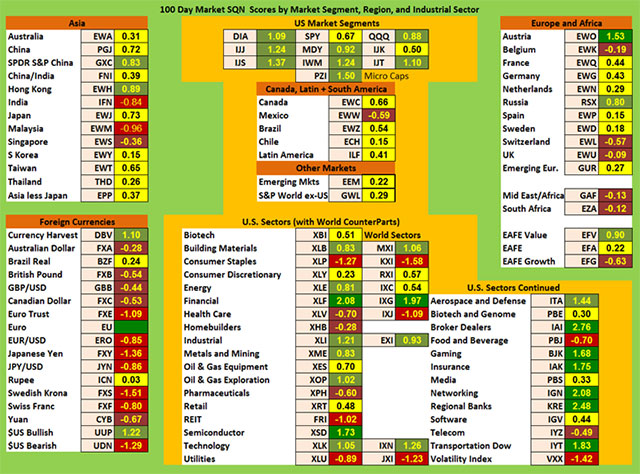
World Market Summary — Equities & Currencies
Each month we look at the equities markets across the globe by segment, region, and sector. This month, the model showed strengthening prices, especially in the US.
|
|
|
All of the US market segments are light green with two yellows. The Americas are yellow with one brown, Mexico. Remember how afraid some of these countries were about a Trump presidency? Now that he’s been elected, these countries’ markets are strong. So much for what the pundits say about the news and the markets.
As a region, Asia has two light green areas, China and Hong Kong. Asia has two very weak (red) areas -- India (see my comments on their currency in the December Update) and Malaysia and it has one brown country, Singapore. The rest of the Asian country markets are all yellow.
On the right hand side of the chart, Austria is dark green and Russia is light green. Belgium, the UK, and Switzerland are brown. The middle east and Africa are also brown. Everything else is neutral or yellow.
In terms of currencies, only the US Dollar is green. And remember that this entire report uses the US dollar as its currency so that biases the overall impact of what is happening. The Currency Harvest ETF (DBV) remains dark green indicating the carry trade strategy has continued working well. There are four red currencies: the Euro, the Japanese Yen, the Swedish Krona, and the Swiss Franc. Add to that the four brown currencies, the British Pound (interesting that after Brexit the pound now seems stronger than the Euro), the Canadian dollar, and the Aussie Dollar.
The Rupee is going through something of a disaster with the Indian government saying that all notes above 100 rupees are no longer valid (like the US saying all notes bigger than a dollar are no longer valid).
The US sector view has turned sharply bullish. There are seven dark green sectors (which I haven’t seen for some time); seven light green sectors; and five reds (all areas that were strong before). The dark greens include financial, semi-conductors, broker dealers, gaming, insurance, regional banks, and the Dow Transports. The light green sectors include: building materials, energy, industrials, energy exploration, metals and mining, technology, and aerospace and defense. The red sectors include REITS, utilities, consumer staples, and volatility.
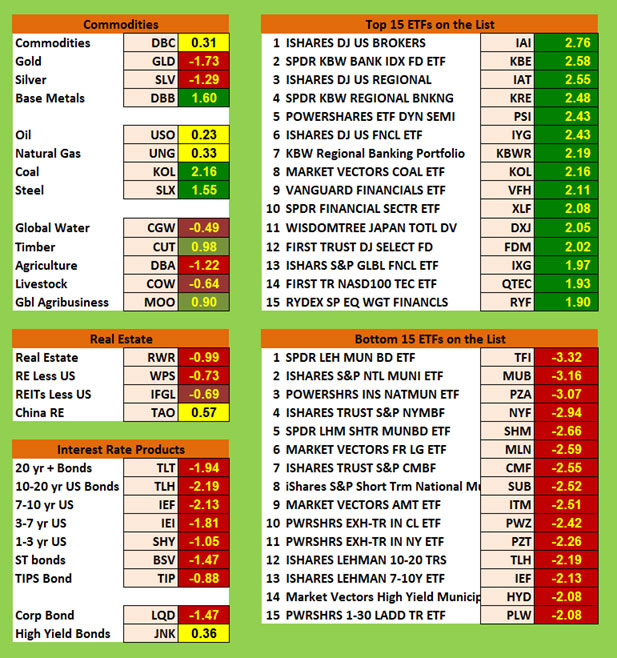
Commodities, Real Estate, Debt, Top and Bottom Lists
|
|
|
Commodities have had an interesting month. There are three strong bull candidates: coal, steel, and base metals. I find that very interesting because not that long ago, coal and steel were very, very weak. Timber and global agribusiness are both light green. On the down side, gold, silver, and agriculture are all red, while livestock and global water are both brown. Real estate is also red and brown except for Chinese real estate which is yellow.
I can remember when trends in ETFs used to last a long time. Today however, if something is really strong, then two months later it shows up as red. And if it’s really weak, then a few months later it shows up as dark green. Perhaps there is a trading system that will work well in there someplace. Big money is playing the game differently than they used to.
Remember when the debt instruments were all green? It wasn’t that long ago. Now they are red across the board except junk bonds which are yellow.
The Top Ranking Lists:
All of the top 15 ETFs are dark green with 12 of them having scores above 2.0. These include many of the ETFs we’ve been talking about with brokers, regional banks, and finance being way up on the chart.
The Bottom Ranking List:
This month’s bottom list is entirely red. All 15 of the ETFs are below -2.0 and the worst three are below -3.0. And I’ve have never seen a 100 day Market SQN below 3.0 before this. Just from a math standpoint, that’s really hard to do — but this month we have three of them. Guess what those three are? They are the darlings of last year — municipal bonds. Big money poured into muni bonds for a long time but it’s now moving elsewhere.
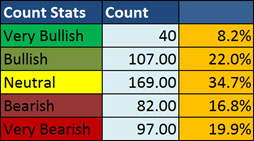
Summary
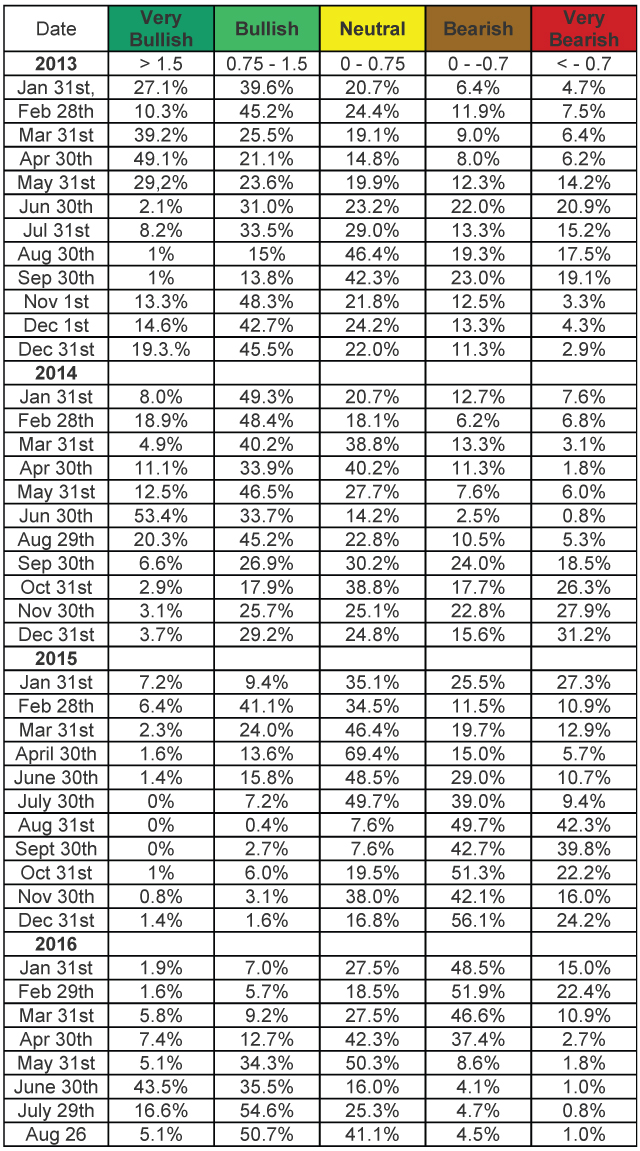
Let’s look at the summary table which measures the percentage of ETFs in each of the strength categories. You can see the Nov. 30 distribution of the database by Market SQN score in the five categories just below.
|
|
|
This table has the database distribution for nearly the last four years -
|
|
|
Last month, the split for bullish/neutral/bearish was 12%/45%/45% — a decidedly bearish move. This month it’s rather balanced at 30%/35%/37%.
In the last SQN Report at the beginning of November, RJ said that the picture was shifting bearish based on what the model was saying. The media said the shift was due to fear of an interest rate hike and the increasing support for Donald Trump. Well now, an interest rate hike is even closer, Donald Trump won, and markets are moving higher.
Until next month this is Van Tharp.
Be careful to base your actions upon what IS happening, not what you think might happen. The markets always offer opportunities, but to capture those opportunities, you MUST know what you are doing. If you want to trade these markets, you need to approach them as a trader, not a long-term investor. We’d like to help you learn how to trade professionally because trying to navigate the markets without an education is hazardous to your wealth. All the beliefs given in this update are my own. Though I find them useful, you may not. You can only trade your own beliefs about the markets.
|
|
|
|
FREE Book!
We pay for the book, you just pay for shipping.
Read Van’s Latest Book —
TRADING BEYOND THE MATRIX
The Red Pill for Traders and Investors
Eleven traders tell their stories about transforming
their trading results and lives, in this 400 plus page book.
Below is a brief video on how powerful this book is to traders.
|
|
|
|
Save Over $500, For A Limited Time Only
|
|
|
|
|
|
Ken Long's systematic approach to swing trading with 5 distinct trading systems. This course has over 10 hours of instruction with significant follow-along documents included for students to download.
Review the videos as many times, and as often as you like, for one full year. Plus, you receive a bonus workshop at no extra charge—Dr. Van Tharp's Tharp Think Essentials!
You can complete this course at your own pace, from the comfort of your own home or office, and access the materials as many times as you wish during your 1-year subscription period.
|
|
|
|
Take a look at this video from Ken to learn more about this course.
|
|
We have extensive information about the Swing Trading System e-learning course, including how to purchase...click the link below!
|
|
|
|
Cary, NC
For a list of nearby hotels for our Cary, North Carolina locations,
click here.
Book your flight arriving to the Raleigh-Durham International Airport (RDU).
When traveling to a three-day course, it's best to arrive the evening before.
To help determine your arrival and departure times, see:
Questions? Click Here to Ask Van...
CONTACT US
If you no longer wish to receive our email updates, click the unsubscribe link in the bottom-left corner of this email.
This is a supplement to our subscription based newsletter, Tharp's Thoughts.
800-385-4486 * 919-466-0043 * Fax 919-466-0408
|
|
|
|
|