Tharp's Thoughts Weekly Newsletter
-
Feature Article: June 2016 Market Update:
Strong Bull Normal Market Type, by Van K. Tharp, Ph.D.
-
Workshops: The Full 2016 Workshop Calendar is Complete Through the End of the Year
-
Trading Tip: SQN, System Quality Number Report, by Van K. Tharp, Ph.D.
-
Plan Your Late Summer and Fall Travel for
These Specialized Technical Workshops
 August: August:
Trading in Bear and/or Down Markets
Applying System Quality NumberSM Methods
September:
Forex Trading Systems and Live Forex Trading
Oct/Nov:
Day Trading Systems and Live Day Trading
Plus: Peak 101 & 202, Infinite Wealth, and Oneness have been added. To register see our workshop schedule below.
Feature Article

June 2016 Market Update:
Strong Bull Normal Market Type
by Van K. Tharp, Ph.D.
Click here to resolve formatting problems
I always say that people do not trade the markets; they trade their beliefs about the markets. In that same way, I'd like to point out that these updates reflect my beliefs. I find the market update information useful for my trading, so I do the work each month and am happy to share that information with my readers. If your beliefs are not similar to mine, however, then this information may not be useful to you. Thus, if you are inclined to go through some sort of intellectual exercise to prove one of my beliefs wrong, simply remember that everyone can usually find lots of evidence to support their beliefs and refute others. Simply know that I admit that these are my beliefs and that your beliefs might be different.
These monthly updates are in the first issue of Tharp's Thoughts each month which allows us to get the closing data from the previous month. These updates cover 1) the market type (first mentioned in the April 30, 2008 edition of Tharp's Thoughts), 2) the debt statistics for the US, 3) the five-week status on each of the major US stock market indices, 4) our four-star inflation-deflation model, and 5) tracking the US dollar. I also write a report on the strongest and weakest areas of the overall market as a separate SQN™ Report. Significant market changes may mean the SQN Report comes out more than once a month.
Part I: The Big Picture
So what are the markets telling us now?
Over the last 100 days, the S&P 500 is up 13.5% — so the period between early February and late June has been pretty good. The Market SQN score for the last 100 days shows a Strong Bull market. The other Market SQN periods we look at, however, are all reading sideways — 200 days, 50 days and 25 days. Over the last 200 days the S&P 500 is up 0.65%; over the last 50 days, it’s up 2.31%; and over the last 25 days it’s up 0.44%.
Debt Clock
The State of the United States |
Month Ending |
National Debt |
Federal Tax Revenue |
Federal Spending |
Trade Deficit |
Debt Per Family |
Unfunded Liabilities |
Taxpayers |
People supported by them |
July 31 2012 |
$15.93 trillion |
$2.364 trillion |
$3.632 trillion |
$810 billion |
$684,405 |
|
|
|
Dec 30 2012 |
$16.42 trillion |
$2.452 trillion |
$3.540 trillion |
$740.7 billion |
$732,086 |
|
|
|
July 31, 2013 |
$16.89
Trillion |
$2.73
trillion |
$3.535 trillion |
$703 billion |
$748,458 |
Unfunded Liabilities |
115.2 million |
109.9M
95.4% |
Dec 31, 2013 |
$17.27 trillion |
$2,82 trillion |
$3,480 trillion |
$692 billion |
$751,294 |
$127.2 trillion |
115.0 million |
108.5M
94.3% |
Aug 31, 2014 |
$17.70 trillion |
$2.97 trillion |
$3.53 trillion |
$706 billion |
$757,297 |
$118.0
trillion |
116.5 million |
104.5M
90.0% |
Dec 31, 2014 |
$18.04 trillion |
$3.08 trillion |
$3.57 trillion |
$713.2 billion |
$733,741 |
$92.5 trillion |
117.3 million |
104.4M
89.0% |
Jul 31, 2015 |
$18.32 trillion |
$3.15 trillion |
$3.65 trillion |
$723.4 billion |
$753,212 |
$97.2 trillion |
118.7 million |
105.0M
88.4% |
Aug 31, 2015 |
$18.37 trillion |
$3.16 trillion |
$3.66 trillion |
$729.7 billion |
$753,533 |
$97.5 trillion |
118.9 million |
104.9M 88.2% |
Sep 30, 2015 |
$18.41 trillion |
$3.18 trillion |
$3.68 trillion |
$726.6 billion |
$800,855 |
$97.7 trillion |
119.0 million |
105M
88.2% |
Oct 31, 2015 |
$18.43 trillion |
$3.26 trillion |
$3.70 trillion |
$736.9
billion |
$805,560 |
$98.8 trillion |
119.2 million |
105M
88.1% |
Nov 30, 2015 |
$18.71 trillion |
$3.29 trillion |
$3.72 trillion |
$732.4 billion |
$810,044 |
$100.3 trillion |
119.4 million |
105.1M
88.0% |
Dec 31, 2015 |
$18.51 trillion |
$3.30 trillion |
$3.74 trillion |
$731.1 billion |
$789,359 |
$100.7 trillion |
119.6 million |
105.1M
87.9% |
Jan 31, 2016 |
$18.96 trillion |
$3.31 trillion |
$3.76 trillion |
$732.1 billion |
$793,400 |
$101.0 trillion |
119.6
Million |
105.5M
88.0% |
Feb 29, 2016 |
$19.06 trillion |
$3.33 trillion |
$3.78 trillion |
$739.7 billion |
$796,710 |
$101.3 trillion |
119.6 million |
105.6M
88.2% |
Mar 31, 2016 |
$19.20 trillion |
$3.31 trillion |
$3.80 trillion |
$734.6 billion |
$792,131 |
$101.7 trillion |
119.7 million |
105.1
87.8% |
Apr 30, 2016 |
$19.26 trillion |
$3.32 trillion |
$3.82 trillion |
$747.3 billion |
$794,366 |
$101.9 trillion |
119.6 million |
104.8
87.9% |
May 31, 2016 |
$19.28 trillion |
$3.33 trillion |
$3.84 trillion |
$735.4 billion |
|
$102.3 trillion |
119.6 million |
104.7 87.5% |
Jun 30 2016 |
$19.29 trillion |
$3.34 trillion |
$3.86 trillion |
$730 billion |
$804,097 |
$102.7 trillion |
119.7 million |
104.6 87.4% |
This image from the US Debt Clock website is shown below where you can see all of the figures that they track. 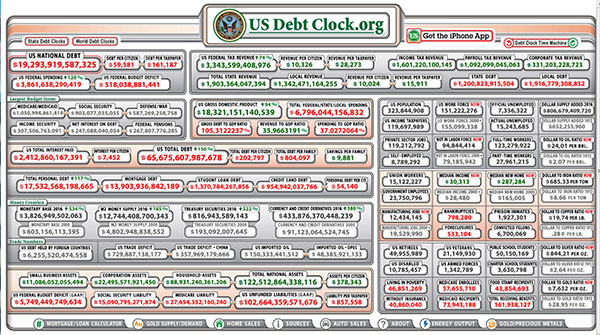
Click here for a larger image.
In late April 2016, usdebtclock.org says our official debt went over the $19 trillion mark and now we are at $19.29 trillion.
Incidentally, the website says there are 119.7 million taxpayers. It also says there are 161.93 million people receiving government support, however, I’m not sure how they determine that as some of the sections there are certainly duplicated. As a result, I add together US Retirees (49.96 million) food stamp recipients (43.85 million) and disabled people drawing social security (10.8 million). I don’t think there is any overlap here. Those groups total 104.6 million and that’s why I say that they constitute a group that’s 87.4% of the number of taxpayers. I could also include all government employees (23.8 million) as among those supported by taxpayers — but they do pay taxes. Remember about 10% of the taxpayers (11.97 million) pay most of the tax revenue.
Part II: The Current Stock Market Type Is Strong Bull Normal
My market type classification is not predictive but descriptive — rather than telling us what’s going to happen, it simply tells us what’s going on now. When you see a trend, you might say, well, right now it’s going down but you also know that in a few days the direction could change.
The Strong Bull market type at the end of June might be a fluke based on what happened in the last few days and what happened 100 days ago. For example, the market type for the 25 day period is Neutral Normal as it is for the 50-day and the 200 day period. But for some reason, the 100 day reads Strong Bull Normal — and the range change is up 13.54% over the last 100 days. The Strong Bull market type does agree with what we’re seeing in the SQN Report (see below) across the board — which also uses the 100 day period.
The graphs below include a chart of weekly price bars for the S&P 500 over the last year, the Market SQNSM score for 100 days, and the ATR percent volatility. In the S&P price chart below, the red bars are showing up as dark green for some strange reason. 100 days back goes to early Feb so you can see how the current market type is somewhat misleading in this particular case compared with other samples. 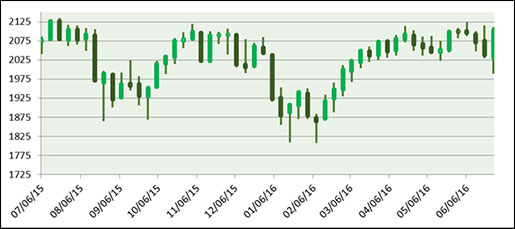
The chart below shows that the market has been in bear territory for most of the last year, and it’s a fluke in the price data (mostly due to the very beginning and very end of the 100 days period) that it’s suddenly showing strong bull at the very end of June. 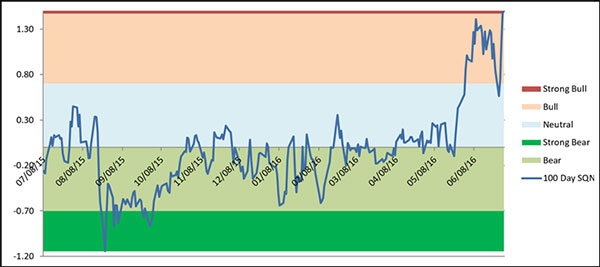
The third chart shows market volatility right on the borderline between quiet and normal for April, May and much of June but then finishing June in the normal range. 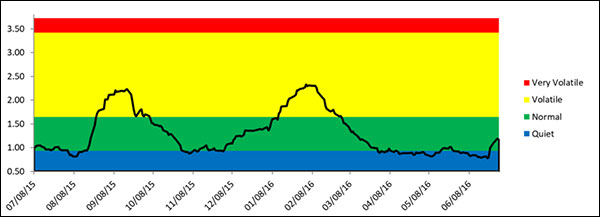
Below is a chart of the recent weekly changes in the three major US Indices. We now have two of our three major indices for the US up slightly for the year. The DOW is up 3.01%, the S&P 500 is up 2.89% (it’s up a lot over the last 100 days however) and NASDAQ 100 is down -3.39% for the new year. 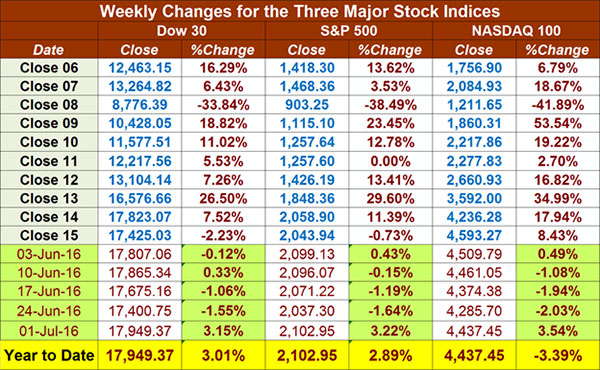
Part III: Our Four Star Inflation-Deflation Model
In the simplest terms, inflation means that stuff gets more expensive, and deflation means that stuff gets cheaper. There’s a correlation between the inflation rate and market levels, so understanding inflation and deflation can help traders understand some important big-picture processes.
See the tracking table below.
Date |
CCI> DBC |
XLB |
Gold |
XLF |
Total Score |
Dec ‘05 |
347.89 |
30.28 |
513 |
31.67 |
|
Dec ‘06 |
394.89 |
34.84 |
635.5 |
36.74 |
|
Dec ‘07 |
476.08 |
41.7 |
833.3 |
28.9 |
|
Dec ‘08 |
352.06 |
22.74 |
865 |
12.52 |
|
Dec ‘09 |
484.42 |
32.99 |
1,104.00 |
14.1 |
|
Dec ‘10 |
629.53 |
38.47 |
1,410.25 |
16 |
|
Dec ‘11 |
564.37 |
33.5 |
1,574.59 |
13 |
|
Dec ’12 CCI>DBC |
556.08
27.79 |
37.54 |
1,564.80 |
16.39 |
1 |
Dec ‘13 |
25.66 |
46.22 |
1201.50 |
21.86 |
-1.5 |
Dec ‘14 |
18.45 |
48.59 |
1199.25 |
24.73 |
-3.0 |
Jun ’15 |
18.00 |
48.39 |
1176.00 |
24.38 |
-1.0 |
Jul ’15 |
15.73 |
45.94 |
1098.40 |
25.18 |
-2.5 |
Aug ’15 |
15.69 |
43.36 |
1135.00 |
23.42 |
-2.5 |
Sep ‘15 |
15.15 |
39.95 |
1114.00 |
22.66 |
-2.0 |
Oct’ 15 |
15.20 |
45.28 |
1142.35 |
24.08 |
-1.5 |
Nov’ 15 |
14.19 |
45.57 |
1061.90 |
24.56 |
-2.0 |
Dec’ 15 |
13.36 |
43.42 |
1062.25 |
23.83 |
-2.0 |
Jan’ 16 |
12.78 |
38.77 |
1111.80 |
21.72 |
0.0 |
Feb ‘16 |
12.75 |
41.80 |
1234.90 |
21.09 |
0.0 |
Mar’ 16 |
13.29 |
44.81 |
1237.00 |
22.50 |
+2.0 |
Apr’ 16 |
14.58 |
47.10 |
1292.40 |
23.31 |
+2.0 |
May 16 |
14.71 |
46.94 |
1216.25 |
23.75 |
+3.0 |
Jun 16 |
15.35 |
46.34 |
1320.75 |
22.86 |
+3.5 |
Here are the model components and how the prices looked at the end of February compared with two months back and six months back.
Month |
DBC2 |
DBC6 |
XLB2 |
XLB6 |
Gold2 |
Gold6 |
XLF2 |
XLF6 |
Total Score |
|
Higher |
Higher |
Lower |
Higher |
Higher |
Higher |
Lower |
Lower |
|
Jun 16 |
|
+1 |
|
+1/2 |
|
+1 |
|
+1 |
+3.5 |
So with June at +3.5, we now have our highest inflationary score in a long time and we also have a streak of four inflationary months in a row. We are clearly seeing a major change in the economy from what we’ve had over the last several years. My guess is that this year will be an exciting time for making money especially since the average person is afraid of the market, no longer buying trading books, and is generally sitting on the sideline. That’s when the rest of us can make the most money.
Part IV: Tracking the Dollar
The US Dollar Index was falling throughout most of March and April and went as low as 92. It began the month of June at 96. When Brexit hit, it had a huge up day and since then has fallen slightly. While the US Dollar is known as a safe haven currency, its 100 day Market SQN score is bearish at -0.11. 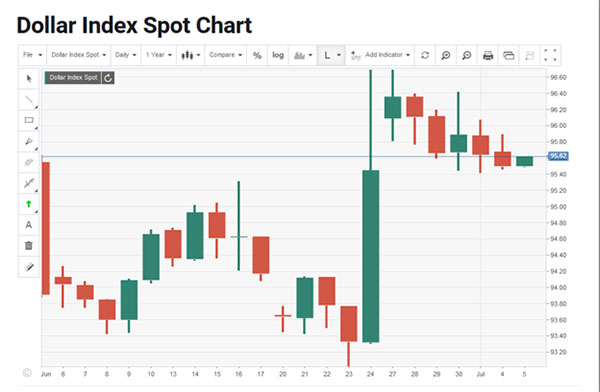
Conclusion
There was a dramatic reaction to Brexit - two big down days followed by three big up days but the market is back to about where it started.
There are some interesting potential pitfalls ahead of us in this election year. First, even though it looks like Hillary Clinton won’t be indicted, she still has some very big problems. In my opinion, she is probably the most corrupt presidential candidate we have ever had (and my opinion that she is corrupt began back when her husband was running for president). Do you remember the Hillary commodity trading account? Professional traders looked at those trades and stated they were impossible results — but it was a good way for her to get kickbacks. Well her behavior hasn’t changed at all over the years. If Clinton were somehow to be indicted while running for president, watch for the US stock markets tumble a lot — much worse than the Brexit reaction.
We also have a wildcard on the Republican side. My guess is that Trump started running for president primarily for publicity but then he found that he could actually win by making outlandish statements. He is a former democrat and a good friend of the Clintons, so he could be running to ensure that Hillary Clinton gets elected. But then again, he might just win.
Lastly, I’ve been reading over and over again about how this guru (e.g., George Soros) or that one is now very bearish on the market long term. I’m not sure what will happen this month but I’m excited about the prospects of the market turning into an immense opportunity to make money.
Trading books are not selling at all (that’s why I haven’t published another one in a while) and people are staying away from the market in droves. This market has been driven by corporate buybacks and by the Fed putting cash into the market. The individual investor is not in the market at all. He/she is scared … and at a time when some of the best money can be made, but isn’t that typical?
While we use market type just to tell us what is happening right now rather than predict, the fundamentals would suggest that we are due for a significant bear market in 2016. Watch volatility. The market is up big time over the last 100 days but up only slightly on the year. Anything is possible.
Are you scared of this market with the amazing opportunities to make big money just ahead of us? Then you need to work on your psychological issue (fear is not equal to happiness) and educate yourself so you can take advantage of the great opportunities ahead.
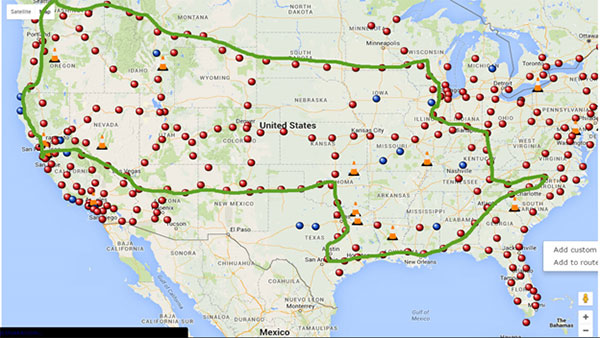
Starting July 19, I will be doing a 9,000 mile road trip in my Tesla. I’m spending 9 days at the University of Santa Cruz attending an NLP modeling workshop so we decided not to go up into Canada because then the trip would have ended in mid-September. Here is our planned route.
RJ Hixson may write the next update while I observe the state of America.
Until next month’s update, this is Van Tharp.
About the Author: Trading coach and author Van K. Tharp, Ph.D. is widely recognized for his best-selling books and outstanding Peak Performance Home Study Program—a highly regarded classic that is suitable for all levels of traders and investors. You can learn more about Van Tharp at www.vantharp.com. His new book, Trading Beyond The Matrix, is available now at matrix.vantharp.com.
Super Trader
We Basically Just Reduced the Price of the Super Trader Program By 25% And You Have Till The End of July to Get The Old Pricing
Interested traders have until July 31st to take advantage of a huge reduction in the price of the Super Trader program. In the old Super Trader program, students paid for three years of Super Trader 1 upfront, and then paid for at least one more year when they started Super Trader 2. Thus, the minimum cost of the program was $66,750. Now, however, students can finish the program in three years for a total investment of only $50,250. For motivated and committed traders looking to transform themselves and their trading, that’s a huge effective discount of $16,750.
If you have been considering joining the program but have been putting off your decision, you have until the end of July to seize your opportunity to act and save big. On August 1st, the price of the program will increase by several thousand dollars (but the ability to finish in three years will still be available.) The longer you wait, the higher the cost - in 2017, we will raise the price of the program tuition to $20,000 per year.
I recently wrote an article on the change in the structure of the program which you can read here.
If you'd like to see the most updated information on the new Super Trader structure click here to view it online, or click here to download a PDF of the new program overview.
Workshops
Combo Discounts available for all back-to-back workshops!
See our workshop page for details.
Trading Tip
June 2016 System
Report
The SQNSM Report
by Van K. Tharp, Ph.D.
Click here to resolve formatting problems
There are numerous ETFs that now track everything from countries, commodities, currencies and stock market indices to individual market sectors. ETFs provide a wonderfully easy way to discover what’s happening in the world markets. Consequently, I now apply a version of my System Quality NumberSM (SQNSM ) score to measure the relative performance of numerous markets in a world model.
The Market SQN score uses the daily percent change for input over a 100-day period. Typically, a Market SQN score over 1.47 is strongly bullish and a score below -0.7 is very weak. The following color codes help communicate the strengths and weaknesses of the ETFs in this report:
- Dark Green: ETFs with very strong SQNSM 100 scores > 1.47
- Light Green: ETFs with strong SQN 100 scores (0.70 to 1.47)
- Yellow: ETFs with slightly positive Market SQN scores (0 to 0.70). These are Neutral/Sideways
- Brown: ETFs with slightly negative Market SQN scores (0 to -0.7).
- Red: Very weak ETFs that earn negative Market SQN scores (< -0.7).
This is basically the same rating scale that we use for the Market SQNSM Score in the Market Update. The world market model spreadsheet report below contains most currently available ETFs; excluding inverse funds and leveraged funds. In short, it covers equity markets around the globe, major asset classes, equity market segments, industrial sectors, and major currencies.
World Market Summary — Equities & Currencies
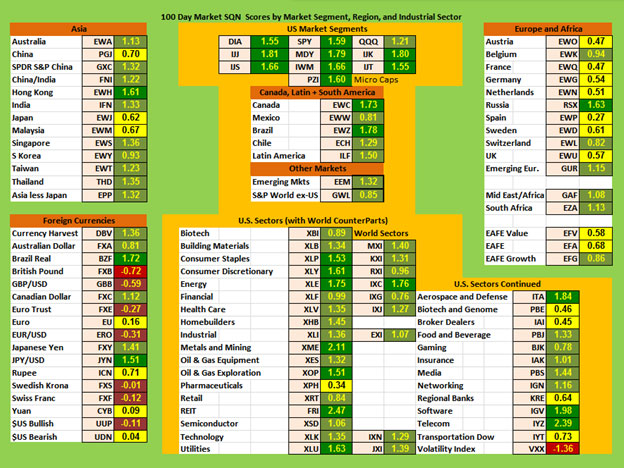
Each month, we look at the equities markets across the globe by segment, region, and sector. Suddenly at the end of June, the entire list of US market segments is green and all of them are dark green except QQQ. All of the equity markets in the Americas are also green with Canada and Brazil both being dark green. Wow, what a difference one month makes.
In our far left Asia region section of the model, Hong Kong is dark green and most of the other areas are light green. Then only exceptions are China, Japan, and Malaysia which are all yellow.
This month Europe was mostly yellow with three green areas. It would probably be stronger except for Brexit. There is one dark green country — Russia — and three light green countries Belgium, Switzerland, and emerging Europe.
The US sector view is quite positive compared with what we have seen recently — almost everything is green. There are just four yellow areas: Pharmaceuticals, Biotech and Genome, Broker Dealers, and Regional Banks. Only one area is brown … VXX (because volatility is going down). Three very strong sectors with Market SQN scores over 2.0 include Metals & Mining, REITs and Telecom.
There are four green currencies. These include the Australian Dollar, Brazilian Real, the Canadian Dollar, and the Japanese Yen. There’s only one red currency in the model - the British Pound which crashed after Brexit. There are four currencies which are down slightly — the Euro, the Swedish Krona, the Swiss Franc, and the US Dollar.
Commodities, Real Estate, Debt, Top and Bottom Lists
The next chart shows real estate, debt instruments, commodities and the top and bottom ETFs for the past 100 days.
The whole commodities section illustrates what the inflation-deflation model in the market update has been showing for the last four months — we are again in an inflationary environment. Commodities, Silver, Oil, Coal, and Steel are all dark green. Gold, Base Metals, Global Water, Timber, Agriculture, and Global Agribusiness are all light green. Natural Gas is yellow and only Livestock is brown.
Debt instruments are all green but that’s almost reversed from what it has been. Suddenly big money likes junk bonds and corporate debt.
The top ranking ETFs in the database are now all dark green with municipal bonds leading the pack. Four of the top ETFs are now over +3.0 compared with four being above only +2.0 last month. This month, all 15 of the top ETFs are above 2.46. This is one of the strongest top ETF lists that I’ve seen - but that could mean we are at a top as well. Long term corporate bonds are on top and most of the strength is in debt instruments. Real estate is also very strong. After Brexit, big money is scared.
In the bottom ranking list last month, there were nine red ETFs but this month only five are red - and only four of them are worse than -1.0. This month’s bottom list, however, is made up of different ETFs again. They reflect the London market, the Singapore market, Volatility, and the British Pound. 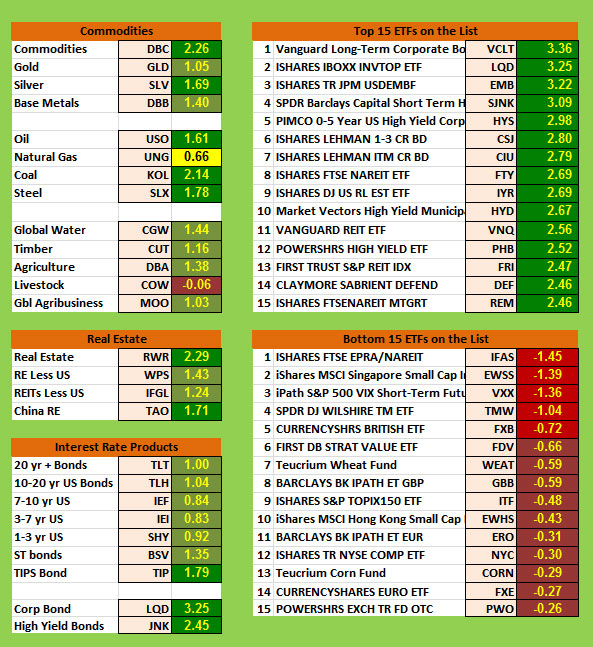
Summary
Now let’s look at the summary table which measures the percentage of ETFs in each of the strength categories.
Date |
Very
Bullish |
Bullish |
Neutral |
Bearish |
Very
Bearish |
2013 |
> 1.5 |
0.75 - 1.5 |
0 - 0.75 |
0 - -0.7 |
< - 0.7 |
Jan 31st, |
27.1% |
39.6% |
20.7% |
6.4% |
4.7% |
Feb 28th |
10.3% |
45.2% |
24.4% |
11.9% |
7.5% |
Mar 31st |
39.2% |
25.5% |
19.1% |
9.0% |
6.4% |
Apr 30th |
49.1% |
21.1% |
14.8% |
8.0% |
6.2% |
May 31st |
29,2% |
23.6% |
19.9% |
12.3% |
14.2% |
Jun 30th |
2.1% |
31.0% |
23.2% |
22.0% |
20.9% |
Jul 31st |
8.2% |
33.5% |
29.0% |
13.3% |
15.2% |
Aug 30th |
1% |
15% |
46.4% |
19.3% |
17.5% |
Sep 30th |
1% |
13.8% |
42.3% |
23.0% |
19.1% |
Nov 1st |
13.3% |
48.3% |
21.8% |
12.5% |
3.3% |
Dec 1st |
14.6% |
42.7% |
24.2% |
13.3% |
4.3% |
Dec 31st |
19.3.% |
45.5% |
22.0% |
11.3% |
2.9% |
2014 |
|
|
|
|
|
Jan 31st |
8.0% |
49.3% |
20.7% |
12.7% |
7.6% |
Feb 28th |
18.9% |
48.4% |
18.1% |
6.2% |
6.8% |
Mar 31st |
4.9% |
40.2% |
38.8% |
13.3% |
3.1% |
Apr 30th |
11.1% |
33.9% |
40.2% |
11.3% |
1.8% |
May 31st |
12.5% |
46.5% |
27.7% |
7.6% |
6.0% |
Jun 30th |
53.4% |
33.7% |
14.2% |
2.5% |
0.8% |
Aug 29th |
20.3% |
45.2% |
22.8% |
10.5% |
5.3% |
Sep 30th |
6.6% |
26.9% |
30.2% |
24.0% |
18.5% |
Oct 31st |
2.9% |
17.9% |
38.8% |
17.7% |
26.3% |
Nov 30th |
3.1% |
25.7% |
25.1% |
22.8% |
27.9% |
Dec 31st |
3.7% |
29.2% |
24.8% |
15.6% |
31.2% |
2015 |
|
|
|
|
|
Jan 31st |
7.2% |
9.4% |
35.1% |
25.5% |
27.3% |
Feb 28th |
6.4% |
41.1% |
34.5% |
11.5% |
10.9% |
Mar 31st |
2.3% |
24.0% |
46.4% |
19.7% |
12.9% |
April 30th |
1.6% |
13.6% |
69.4% |
15.0% |
5.7% |
June 30th |
1.4% |
15.8% |
48.5% |
29.0% |
10.7% |
July 30th |
0% |
7.2% |
49.7% |
39.0% |
9.4% |
Aug 31st |
0% |
0.4% |
7.6% |
49.7% |
42.3% |
Sept 30th |
0% |
2.7% |
7.6% |
42.7% |
39.8% |
Oct 31st |
1% |
6.0% |
19.5% |
51.3% |
22.2% |
Nov 30th |
0.8% |
3.1% |
38.0% |
42.1% |
16.0% |
Dec 31st |
1.4% |
1.6% |
16.8% |
56.1% |
24.2% |
2016 |
|
|
|
|
|
Jan 31st |
1.9% |
7.0% |
27.5% |
48.5% |
15.0% |
Feb 29th |
1.6% |
5.7% |
18.5% |
51.9% |
22.4% |
Mar 31st |
5.8% |
9.2% |
27.5% |
46.6% |
10.9% |
Apr 30th |
7.4% |
12.7% |
42.3% |
37.4% |
2.7% |
May 31st |
5.1% |
34.3% |
50.3% |
8.6% |
1.8% |
June 30th |
43.5% |
35.5% |
16.0% |
4.1% |
1.0% |
Six months ago 80.3% of the ETFs we track were either in bear territory or strong bear territory. Since December, 2015 that number went down to 40.1% in April and in June, both bear categories went down to 5.1%. What’s amazing is that the number of dark green (Very Bullish) ETFs now constitute 43.5% of the database. This is somewhat of an abnormality because 100 days ago the market was in very bearish territory and last week, many markets were up strongly after the initial Brexit drop. The market is not that strong at all short term or over the last 200 days.
Be careful to base your actions upon what is happening, not what you think might happen.
Until next month, this is Van Tharp. RJ may write next month’s SQN Report while I’m on my road trip.
The markets always offer opportunities, but to capture those opportunities, you MUST know what you are doing. If you want to trade these markets, you need to approach them as a trader, not a long-term investor. We’d like to help you learn how to trade professionally because trying to navigate the markets without an education is hazardous to your wealth. All the beliefs given in this update are my own. Though I find them useful, you may not. You can only trade your own beliefs about the markets.
Free Book
FREE Book!
TRADING BEYOND THE MATRIX
The Red Pill for Traders and Investors
We pay for the book, you pay for shipping.
ALL YOU HAVE TO DO IS CLICK HERE!
Eleven traders tell their stories about transforming their trading results and lives, in this 400 plus page book.
Below is a brief video on how powerful this book is to traders.

Swing Trading Systems E-Learning Course

Ken Long's systematic approach to swing trading with 5 distinct trading systems. This course has over 10 hours of instruction with significant follow-along documents included for students to download.
Review the videos as many times, and as often as you like, for one full year. Plus, you receive a bonus workshop at no extra charge—Dr. Van Tharp's Tharp Think Essentials!
If you are interested in both this video home study program (featuring mechanical, rule-based systems) and our new Advanced Adaptive Swing workshop (adaptive trading systems have rules and rule parameters that adjust to market conditions and price conditions rather than remaining constant) you benefit by buying both at the same time.
When you register for the workshop you can get a 22% discount on this home study.
The home study is not required to attend the workshop, however, an understanding of the systems in the the video home study may help a less experienced trader better understand the more advanced trading style which will be presented in the workshop. The systems, however, are totally different and the Advanced Adaptive Systems Workshop does not build upon the systems in the home study.
You can complete this course at your own pace, from the comfort of your own home or office, and access the materials as many times as you wish during your 1-year subscription period.
Take a look at this video from Ken to learn more about this course.

We have extensive information about the Swing Trading System e-learning course, including how to purchase...click the link below!
Learn More About The Swing E-Learning Course...
Matrix Contest
 Enter the Matrix Contest Enter the Matrix Contest
for a chance to win a free workshop!
We want to hear about the one most profound insight that you got from reading Van's new book, Trading Beyond the Matrix, and how it has impacted your life. If you would like to enter, send an email to [email protected].
If you haven't purchased Trading Beyond the Matrix yet, click here.
For more information about the contest, click here.
Ask Van...
Everything we do here at the Van Tharp Institute is focused on helping you improve as a trader and investor. Consequently, we love to get your feedback, both positive and negative!
Send comments or ask Van a question by clicking here.
Also, Click here to take our quick, 6-question survey.
Back to Top
Contact Us
Email us at [email protected]
The Van Tharp Institute does not support spamming in any way, shape or form. This is a subscription based newsletter.
To change your e-mail Address, e-mail us at [email protected].
To stop your subscription, click on the "unsubscribe" link at the bottom left—hand corner of this email.
How are we doing? Give us your feedback! Click here to take our quick survey.
Call us at: 800-385-4486 * 919-466-0043 * Fax 919-466-0408
SQN® and the System Quality Number® are registered trademarks of the Van Tharp Institute and the International Institute of Trading Mastery, Inc.
Be sure to check us out on Facebook and Twitter!
 
Van Tharp Home • Products • Workshops • Back Issues • Contact • About Van Tharp • Site Map ———————
Back to Top |

