Tharp's Thoughts Weekly Newsletter
-
Article: May 2016 Market Update:
Sideways Normal Market Type, by Van K. Tharp, Ph.D.
-
Workshops: SALE on Ken Long's Workshops This July!
-
Tip: May 2016 System Quality Number ® Report, by Van K. Tharp, Ph.D.
-
WOW
$1,000 Discount on Ken Long's July Workshops!
This $1,000 discount is limited to the first 10 people* to sign up before next week, June 10.
*There are now less than 10 seats left at the special price.
Expires Next Week, June 10th!

Systems Thinking for Traders • July 12-14
Advanced Adaptive Swing Trading • July 15-17
CLICK HERE to check out all of Ken Long’s VIDEOS on these new courses, including a NEW video.
When you act quickly, you can take these two advanced courses for $1,000 less than our early enrollment price. Our advanced systems workshops are priced at $3,995, or $3,295, with the early enrollment discount. The next 10 students who register will receive unheard of savings and pay only $2,295.
Dr. Tharp is excited about the two new workshops Dr. Long has developed! He wants as many people as possible to have a seat in the room alongside a growing list of Super Trader students who have already committed to taking these advanced courses.
Join this highly motivated, dynamic group of traders and be ready to learn from the best!
To find our more about what these workshops have to offer READ BELOW.
Feature Article
May 2016 Market Update:
Sideways Normal Market Type
by Van K. Tharp, Ph.D.
Click here to resolve formatting problems
I always say that people do not trade the markets; they trade their beliefs about the markets. In that same way, I'd like to point out that these updates reflect my beliefs. I find the market update information useful for my trading, so I do the work each month and am happy to share that information with my readers. If your beliefs are not similar to mine, however, then this information may not be useful to you. Thus, if you are inclined to go through some sort of intellectual exercise to prove one of my beliefs wrong, simply remember that everyone can usually find lots of evidence to support their beliefs and refute others. Simply know that I admit that these are my beliefs and that your beliefs might be different.
These monthly updates are in the first issue of Tharp's Thoughts each month which allows us to get the closing data from the previous month. These updates cover 1) the market type (first mentioned in the April 30, 2008 edition of Tharp's Thoughts), 2) the debt statistics for the US, 3) the five-week status on each of the major US stock market indices, 4) our four-star inflation-deflation model, and 5) tracking the US dollar. I also write a report on the strongest and weakest areas of the overall market as a separate SQN™ Report. Significant market charges may mean the SQN Report comes out more than once a month.
Part I: The Big Picture
So what are the markets telling us now?
The Market SQN score for the last 100 days is showing a sideways direction. In fact, all four measured periods show that the market has sideways Market SQN scores. On a percentage basis over the same measured time periods, the market is either slightly up or sideways. Over the last 200 days the S&P 500 is up 0.65%; over the last 100 days, it’s up 5.36%, over the last 50 days, it’s up 2.31%; and over the last 25 days it’s up 0.44%.
U.S. Debt Clock
The State of the United States |
Month Ending |
National Debt |
Federal Tax Revenue |
Federal Spending |
Trade Deficit |
Debt Per Family |
Unfunded Liabilities |
Taxpayers |
People supported by them |
July 31 2012 |
$15.93 trillion |
$2.364 trillion |
$3.632 trillion |
$810 billion |
$684,405 |
|
|
|
Dec 30 2012 |
$16.42 trillion |
$2.452 trillion |
$3.540 trillion |
$740.7 billion |
$732,086 |
|
|
|
July 31, 2013 |
$16.89
Trillion |
$2.73
trillion |
$3.535 trillion |
$703 billion |
$748,458 |
Unfunded Liabilities |
115.2 million |
109.9M
95.4% |
Dec 31, 2013 |
$17.27 trillion |
$2,82 trillion |
$3,480 trillion |
$692 billion |
$751,294 |
$127.2 trillion |
115.0 million |
108.5M
94.3% |
Aug 31, 2014 |
$17.70 trillion |
$2.97 trillion |
$3.53 trillion |
$706 billion |
$757,297 |
$118.0
trillion |
116.5 million |
104.5M
90.0% |
Dec 31, 2014 |
$18.04 trillion |
$3.08 trillion |
$3.57 trillion |
$713.2 billion |
$733,741 |
$92.5 trillion |
117.3 million |
104.4M
89.0% |
Jul 31, 2015 |
$18.32 trillion |
$3.15 trillion |
$3.65 trillion |
$723.4 billion |
$753,212 |
$97.2 trillion |
118.7 million |
105.0M
88.4% |
Aug 31, 2015 |
$18.37 trillion |
$3.16 trillion |
$3.66 trillion |
$729.7 billion |
$753,533 |
$97.5 trillion |
118.9 million |
104.9M 88.2% |
Sep 30, 2015 |
$18.41 trillion |
$3.18 trillion |
$3.68 trillion |
$726.6 billion |
$800,855 |
$97.7 trillion |
119.0 million |
105M
88.2% |
Oct 31, 2015 |
$18.43 trillion |
$3.26 trillion |
$3.70 trillion |
$736.9
billion |
$805,560 |
$98.8 trillion |
119.2 million |
105M
88.1% |
Nov 30, 2015 |
$18.71 trillion |
$3.29 trillion |
$3.72 trillion |
$732.4 billion |
$810,044 |
$100.3 trillion |
119.4 million |
105.1M
88.0% |
Dec 31, 2015 |
$18.51 trillion |
$3.30 trillion |
$3.74 trillion |
$731.1 billion |
$789,359 |
$100.7 trillion |
119.6 million |
105.1M
87.9% |
Jan 31, 2016 |
$18.96 trillion |
$3.31 trillion |
$3.76 trillion |
$732.1 billion |
$793,400 |
$101.0 trillion |
119.6
Million |
105.5M
88.0% |
Feb 29, 2016 |
$19.06 trillion |
$3.33 trillion |
$3.78 trillion |
$739.7 billion |
$796,710 |
$101.3 trillion |
119.6 million |
105.6M
88.2% |
Mar 31, 2016 |
$19.20 trillion |
$3.31 trillion |
$3.80 trillion |
$734.6 billion |
$792,131 |
$101.7 trillion |
119.7 million |
105.1
87.8% |
Apr 30, 2016 |
$19.26 trillion |
$3.32 trillion |
$3.82 trillion |
$747.3 billion |
$794,366 |
$101.9 trillion |
119.6 million |
104.8
87.9% |
|
|
|
|
|
Liability per taxpayer |
|
|
|
May 31, 2016 |
$19.28 trillion |
$3.33 trillion |
$3.84 trillion |
$735.4 billion |
$855,140 |
$102.3 trillion |
119.6 |
104.7 87.5% |
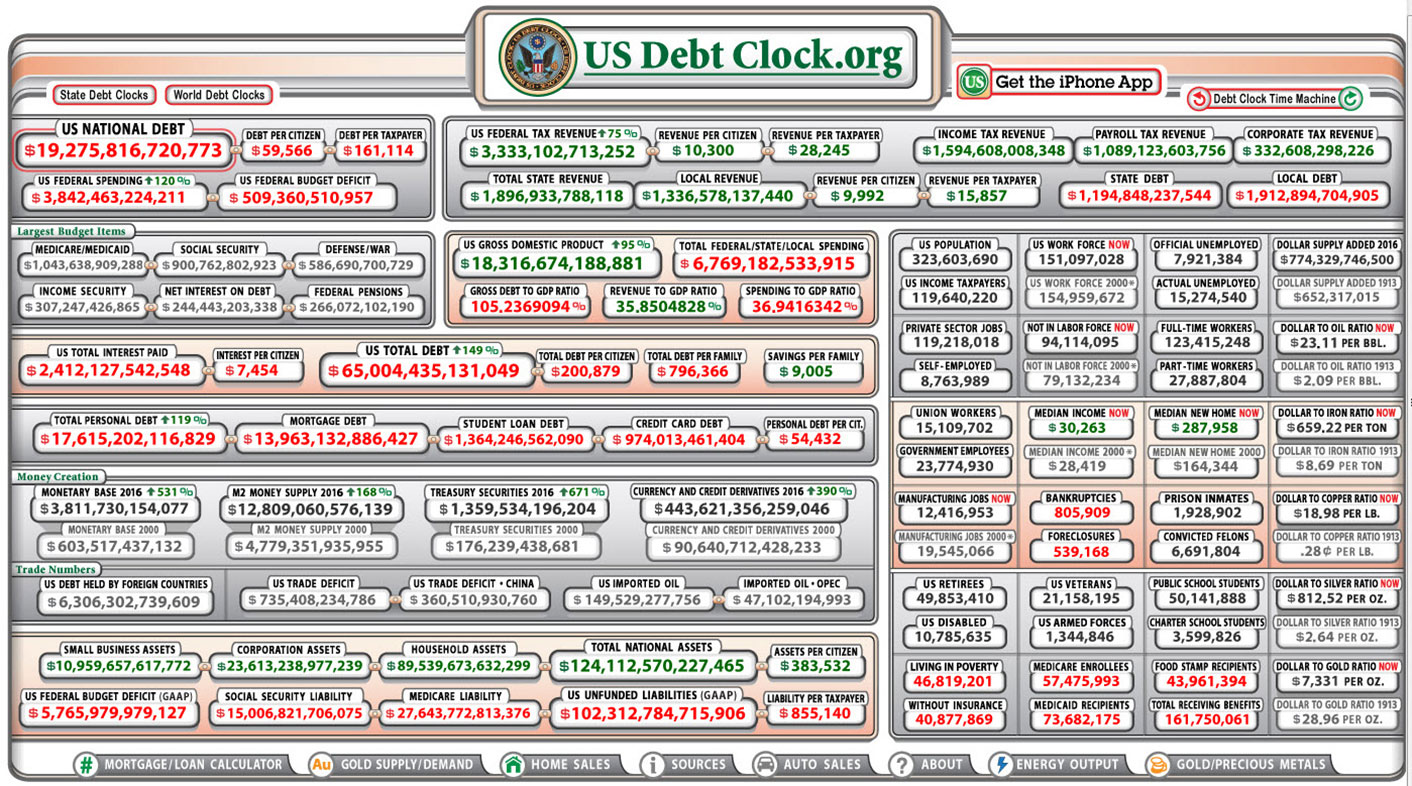
An image from the US Debt Clock website is shown below where you can see all of the figures that they track. They’ve changed their statistics somewhat. They no longer list the debt per family but they do list the assets per citizen ($383,582) and the liability per taxpayer ($855,140). Notice how the liability per taxpayer is even bigger than the liability per family. Apparently we have fewer taxpayers than families.
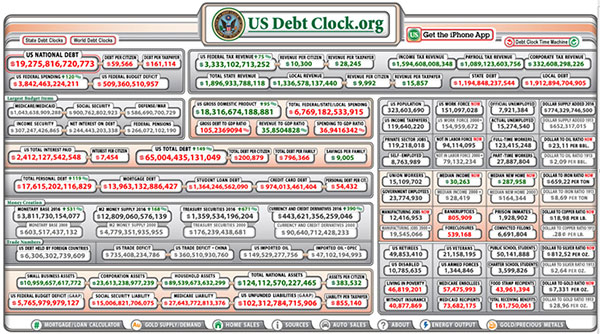
Click here for a larger view
In late April 2016, usdebtclock.org says our official debt went over the $19 trillion mark and now we are at $19.276 trillion.
Incidentally, the website says there are 119.6 million taxpayers. It also says there are 161.75 million people receiving government support, however, I’m not sure how they determine that as some of the sections there are certainly duplicated. As a result, I add together US Retirees (49.9 million) food stamp recipients (44.0 million) and disabled people drawing social security (10.8 million). I don’t think there is any overlap here. Those groups total 104.7 million and that’s why I say that they constitute a group that’s 87.4% of the number of taxpayers. I could also include all government employees (23.8 million) as among those supported by taxpayers, but they do pay taxes. Remember about 10% of the taxpayers (11.9 million) pay most of the tax revenue.
Part II: The Current Stock Market Type Is Sideways Normal
My market type classification is not predictive but descriptive — rather than telling us what’s going to happen, it simply tells us what’s going on now. It’s like looking at a trend. You can say, well, right now it’s going down, however, that doesn’t mean that in a few days the direction might change.
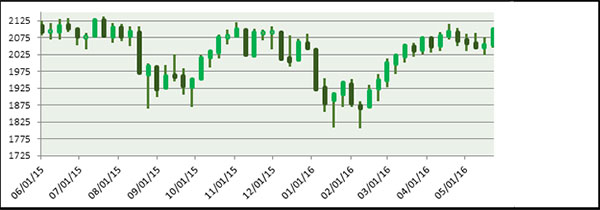
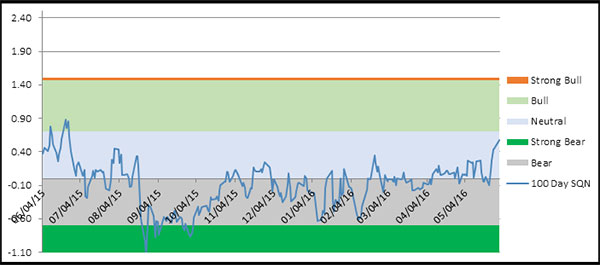
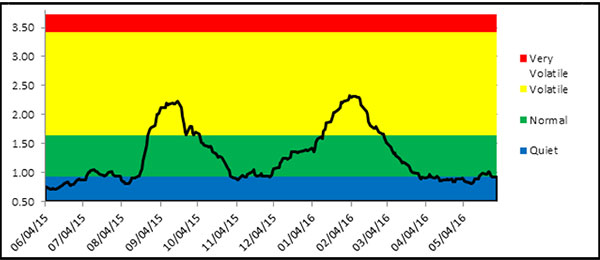
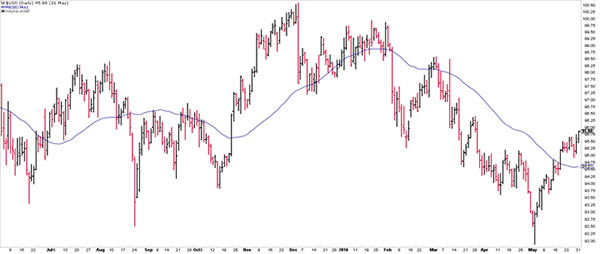
The graphs below include a chart of weekly bars for the S&P 500 over the last year, the Market SQN® score for 100 days, and the ATR percent volatility. In the S&P 500 Index chart below, for some strange reason, the red bars are showing up as dark green now.
The chart below shows that the market has been in bear territory for most of the last six months even though it has never really declined by a serious amount. In fact, it is now about as strong as its been in the last year… it was in bull territory about 11 months ago. Anyway, I’d expect the market to stay in limbo for some time but remember this bear to sideways market is in the S&P 500. Other markets are quite bullish. See the SQN report below. Right now the % range change shows the S&P 500 up 5.36% over the last 100 days.
The third chart shows market volatility moving down a few months ago and then traveling right on the borderline sitting between quiet and normal since then.
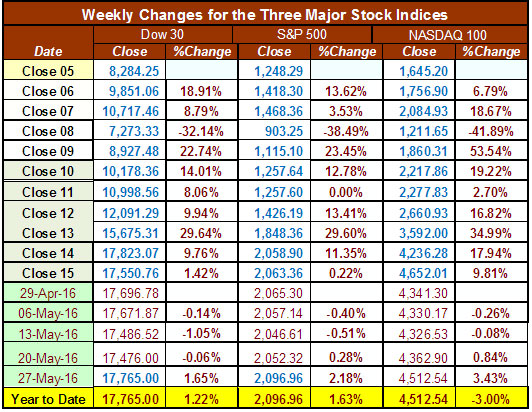
Below is a chart of the recent weekly changes in the three major US Indices. We now have two of our three major indices for the US up slightly for the year. The DOW is up 1.2%, the S&P 500 is up 1.63 (it’s just down slightly over the last 100 days) and NASDAQ 100 is down -3.00 for the new year.
Part III: Our Four Star Inflation-Deflation Model
In the simplest terms, inflation means that stuff gets more expensive, and deflation means that stuff gets cheaper. There’s a correlation between the inflation rate and market levels, so understanding inflation and deflation can help traders understand some important big-picture processes.
See the tracking table below.
Date |
CCI> DBC |
XLB |
Gold |
XLF |
Total Score |
Dec ‘05 |
347.89 |
30.28 |
513 |
31.67 |
|
Dec ‘06 |
394.89 |
34.84 |
635.5 |
36.74 |
|
Dec ‘07 |
476.08 |
41.7 |
833.3 |
28.9 |
|
Dec ‘08 |
352.06 |
22.74 |
865 |
12.52 |
|
Dec ‘09 |
484.42 |
32.99 |
1,104.00 |
14.1 |
|
Dec ‘10 |
629.53 |
38.47 |
1,410.25 |
16 |
|
Dec ‘11 |
564.37 |
33.5 |
1,574.59 |
13 |
|
Dec ’12 CCI>DBC |
556.08
27.79 |
37.54 |
1,564.80 |
16.39 |
1 |
Dec ‘13 |
25.66 |
46.22 |
1201.50 |
21.86 |
-1.5 |
Dec ‘14 |
18.45 |
48.59 |
1199.25 |
24.73 |
-3.0 |
Jun ’15 |
18.00 |
48.39 |
1176.00 |
24.38 |
-1.0 |
Jul ’15 |
15.73 |
45.94 |
1098.40 |
25.18 |
-2.5 |
Aug ’15 |
15.69 |
43.36 |
1135.00 |
23.42 |
-2.5 |
Sep ‘15 |
15.15 |
39.95 |
1114.00 |
22.66 |
-2.0 |
Oct’ 15 |
15.20 |
45.28 |
1142.35 |
24.08 |
-1.5 |
Nov’ 15 |
14.19 |
45.57 |
1061.90 |
24.56 |
-2.0 |
Dec’ 15 |
13.36 |
43.42 |
1062.25 |
23.83 |
-2.0 |
Jan’ 16 |
12.78 |
38.77 |
1111.80 |
21.72 |
0.0 |
Feb ‘16 |
12.75 |
41.80 |
1234.90 |
21.09 |
0.0 |
Mar’ 16 |
13.29 |
44.81 |
1237.00 |
22.50 |
+2.0 |
Apr’ 16 |
14.58 |
47.10 |
1292.40 |
23.31 |
+2.0 |
May 16 |
14.71 |
46.94 |
1216.25 |
23.75 |
+3.0 |
Here are the model components and how the prices looked at the end of May compared with two months back and six months back.
Month |
DBC2 |
DBC6 |
XLB2 |
XLB6 |
Gold2 |
Gold6 |
XLF2 |
XLF6 |
Total Score |
|
Higher |
Higher |
Higher |
Higher |
Lower |
Higher |
Higher |
Lower |
|
May 16 |
|
+1 |
|
+1 |
|
+1/2 |
|
+1/2 |
+3.0 |
So at +3.0 we have a streak of three inflationary months in a row and our highest inflationary reading in at least several years. My guess is the Federal Reserve will raise interest rates for the second time in June. What the Fed has done so far has had little impact on the economy.
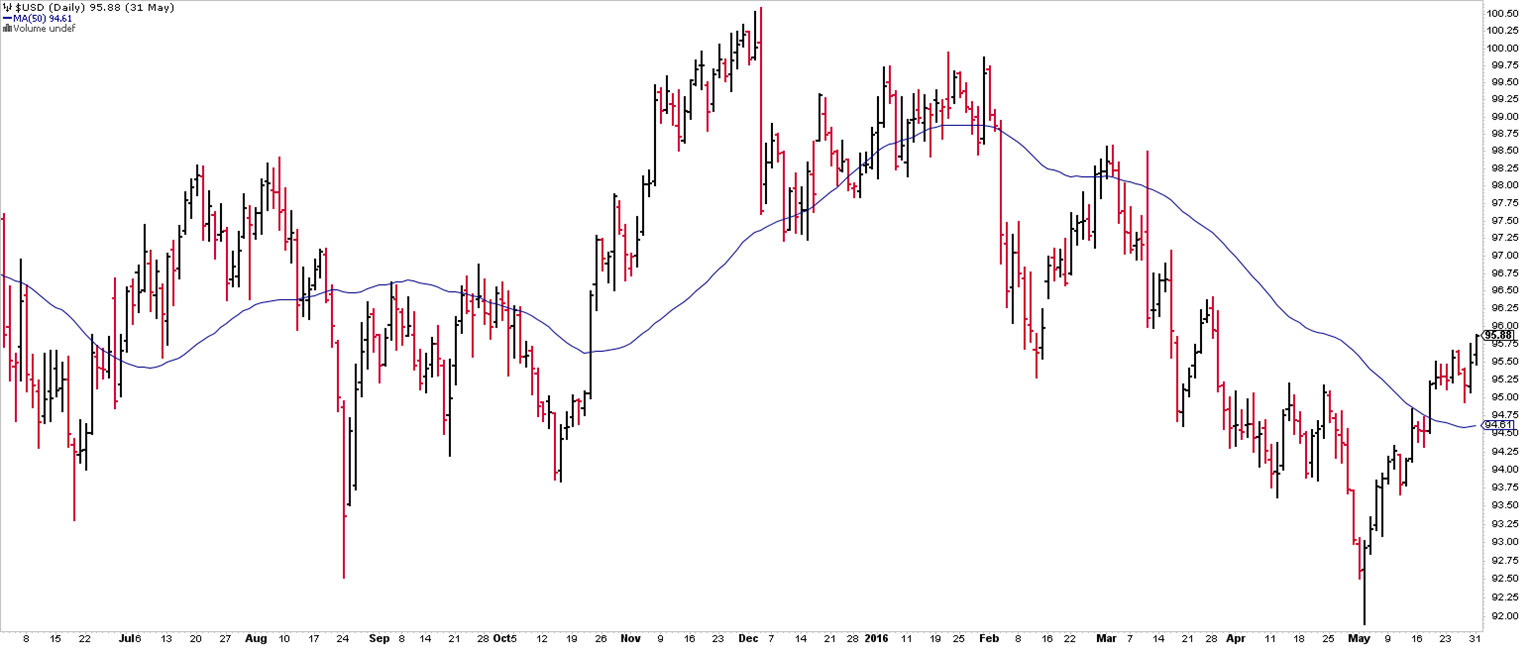
Part IV: Tracking the Dollar
The US Dollar Index was falling throughout most of March and April and went as low as 92. Now with the prospect of an interest rate hike in June it’s back up to 96. UUP was the weakest ETF in April among the 500 we track in the world market model. I guess that was a great sign to buy, however, I’m going to India for two weeks on June 8th, so you might want to invest in the Rupee now. (That’s just a joke, of course it is not advice!)
Click here for a larger view
Conclusion
The market spent almost all of 2015 in a neutral to down direction — that is — the market type was mostly sideways and quiet (volatility). So far, that has pretty much continued in 2016. These market types are about the hardest kinds in which to make money.
The S&P 500 is up 1.6% on the month, but November through May is typically the most bullish time of the year while June through October is the most bearish time. Today starts June. It’s an election year and the market usually goes up in election years … but then again, look at who the likely candidates are. The Fed will probably raise interest rates this month and that should positively impact the dollar and negatively impact the stock market.
Lastly, I’ve been reading over and over again about how this market guru (e.g., George Soros) or that one is now very bearish on the market long term. I’m not sure what will happen this month but the prospect of the market turning into an immense opportunity to make money is exciting.
Trading books have not been selling at all (that’s why I haven’t published another one) and people are staying away from the markets in droves. This market has been driven by corporate buybacks and by the Fed putting cash into the market. The individual investor is not in the market at all. He/she is scared … and at a time when some of the best money can be made, but isn’t that typical?
We do not use market type to predict, just to tell us what is happening right now but the fundamentals would suggest that we are due for a significant bear market in 2016. Watch volatility. The market is sideways to slightly up, but volatility is also climbing slightly. If it climbs a lot more, the bear market will most likely resume. If volatility continues to be quiet, then I’d expect either we continue in a sideways market or the market starts a slow climb to new highs.
My conclusion ... the market type right now is sideways normal. Right now, we are in a short-term rally. Who knows what it will be at the end of next month.
Are you scared of this market with the amazing opportunities to make big money just ahead of us? Then you need to work on your psychological issue (fear makes it very hard to make money trading) and educate yourself so you can take advantage of the great opportunities ahead.
Until next month’s update, this is Van Tharp.
About the Author: Trading coach and author Van K. Tharp, Ph.D. is widely recognized for his best-selling books and outstanding Peak Performance Home Study Program—a highly regarded classic that is suitable for all levels of traders and investors. You can learn more about Van Tharp at www.vantharp.com. His new book, Trading Beyond The Matrix, is available now at matrix.vantharp.com.
Workshops
July Workshops — $1,000 Discount Ends Next Friday
INFINITE WEALTH — July 8-10
Twelve Benefits You’ll Receive from the Infinite Wealth Course
- You’ll learn about the five-step method to becoming infinitely rich in much more detail. Moreover, you’ll develop a personalized plan for you.
- Become wealthy on the inside so that it will appear on the outside. You’ll develop a personal plan and learn how to overcome your personal roadblocks so that you can get started immediately.
- Learn several principles involved in becoming wealthy and learn how to make those principles ingrained in your body so that they become part of your behavior. That’s one of the real secrets to wealth. Not the knowledge but having the knowledge be a part of who you are.
- You don’t have any assets right now? We’ll also show you 15 steps to increase your income by 1000% within the next five years. And, you need very little to get started.
- You’ll learn "financial intelligence". You’ll learn to think like the rich instead of like the poor or the middle class. Even if you have money, it’s important to think like the rich or you could lose it all. That knowledge will include a simple strategy to get rid of all of your debt within 5 to 7 years, including your mortgage. How close to infinite wealth would you be if you didn’t have any debt?
- At the end of the course you’ll be able to access a wealth building state of mind that will help you achieve your dreams.
- We’ll help you determine your purpose in life and use that as motivation to do what is necessary to achieve Infinite Wealth.
After all of these years, you’ll finally understand the one simple decision you need to make to start moving toward the fast track and out of the rat race.
- You’ll learn to overcome years of conditioning by the school systems, by your banker and by your accountant.
- You’ll learn to rethink your finances. Some of you could be infinitely rich within a year.
- Learn the difference between working for money and money working for you. If you’re self-employed, you’re still working for money. This system is so tight that it actually explains many of the problems that most traders have— they’re self-employed and they are thinking with the mentality of the self-employed. Learn to think like a business owner.
- In the New Infinite Wealth Workshop, you learn how to develop resiliency so that when you achieve any sort of setback, you will bounce back easily and be able to continue on track toward infinite wealth.
- In addition, we will be emphasizing the psychological tools to make sure you can follow the steps we are going to give you.
LEARN MORE...
SYSTEMS THINKING FOR TRADERS: How to Use Systems Thinking to Improve Your Trade Craft — July 12-14
How will you benefit from attending this Systems Thinking Workshop?
- Learn to plan your trading business and plan your trades more effectively for achieving the results you are trying to generate.
- Improve the probabilities for your success in trading
- Find out what key questions to ask in order to challenge your established market beliefs, logic, and mental structures for trading.
- Create a series of useful tactical checklists for daily and weekly use so you don’t miss common crucial items and keep your trading efficiency very high.
Gain invaluable lessons from practicing systems thinking.
- Identify the few critical states in price action and how to plan how to take advantage of those when you find them.
- Develop your situational awareness skills by simply paying attention to what’s happening in order to evolve your strategy as well as exploit new opportunities.
- Understand how to construct trade scenarios in order to anticipate possible outcomes and reduce the chances for a “surprise”.
- Clarify your objectives and understand how your long term plans, your big picture process, and expecting the unexpected, all support you getting to those objectives.
- Feel more confident in your trading regardless of what the markets are doing.
- Improve your decision making processes for faster execution with results more aligned with your goals.
- Ultimately – feel better about your trading and improve your returns.
These are all things that are the natural outcomes of a systems thinking orientation as applied to trading. These are the things that the members of the tortoise community of practice and the chatroom have been doing to improve their trading on explicit systems developed by Ken and through the community collaboration.
This new three-day workshop will not only have extensive pre-work that will give you a head start on the material, but Ken will have dozens of practical exercise for the class which he has already field tested within his trading group. All of the exercises and three days of presentations will focus on helping you realize how important this mindset is for your own trading and developing your systems thinking orientation and how to capitalize on this important factor.
LEARN MORE...
ADVANCED ADAPTIVE SWING TRADING — July 15-17
In this new three-day workshop, Dr. Ken Long will present a series of advanced, adaptive trading systems that work well in the swing period holding time-frame – from two days to two weeks.
Adaptive trading systems have rules and rule parameters that adjust to market conditions and price conditions rather than remaining constant.
They both mechanical systems and adaptive systems work well, they just work differently. Mechanical rules are more easily understood, are easier to program, and they are easier to execute. Mechanical rule-based systems typically do not adjust to changing market conditions and therefore are out of the market at times when the condition criteria are unmet. These are the kind of systems detailed in the Swing Trading Elearning Course.
Adaptive rules require a better understanding by the trader of price action, of self and of the market. These systems can also take more time to monitor and to execute.
LEARN MORE...
Click Here To Learn More
Combo Discounts available for all back-to-back workshops!
See our workshop page for details.
Trading Tip
May 2016 System Quality Number® Report
The SQN® Report
by Van K. Tharp, Ph.D.
Click here to resolve formatting problems
There are numerous ETFs that now track everything from countries, commodities, currencies and stock market indices to individual market sectors. ETFs provide a wonderfully easy way to discover what’s happening in the world markets. Consequently, I now apply a version of my System Quality Number® (SQN®) score to measure the relative performance of numerous markets in a world model.
The Market SQN score uses the daily percent change for input over a 100-day period. Typically, a Market SQN score over 1.47 is strongly bullish and a score below -0.7 is very weak. The following color codes help communicate the strengths and weaknesses of the ETFs in this report:
- Dark Green: ETFs with very strong SQN® 100 scores > 1.47
- Light Green: ETFs with strong SQN 100 scores (0.70 to 1.47).
- Yellow: ETFs with slightly positive Market SQN scores (0 to 0.70). These are Neutral/Sideways
- Brown: ETFs with slightly negative Market SQN scores (0 to -0.7).
- Red: Very weak ETFs that earn negative Market SQN scores (< -0.7).
This is basically the same rating scale that we use for the Market SQN® Score in the Market Update. The world market model spreadsheet report below contains most currently available ETFs; excluding inverse funds and leveraged funds. In short, it covers equity markets around the globe, major asset classes, equity market segments, industrial sectors, and major currencies.
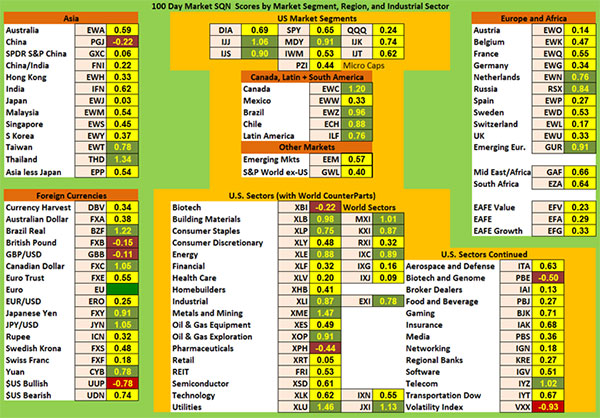
World Market Summary — Equities & Currencies
Each month, we look at the equities markets across the globe by segment, region, and sector.
May looks much better than many previous months and although the dollar went up during the month, the long term trend has been down which is producing some of this positive effect because everything in the model is priced in the dollar. In the US and in Europe, everything is now green and yellow. Wow!
A little over half of the US major market segments are yellow this month and the rest are light green or slightly bullish. Money is starting to move into equities again. And except for Mexico, all of the other Americas are green, including Canada.
In our far left Asia region section of the model, both Taiwan and Thailand are green but most countries are yellow. The only brown (slightly bearish) is China.
Last month Europe was basically half yellow, half brown. This month it is mostly yellow with three green areas: the Netherlands, Russia and Emerging Europe. Interestingly, the latter two are green probably because oil is going up.
The US sector view is quite positive compared with what we have seen recently. Like the major US indexes, the sectors are mostly yellow and green. There are three brown areas and one red. The brown areas are Biotech, Pharmaceuticals, and Biotech and Genome. The red area is Volatility… it is going down. The green sectors include Building Materials, Consumer Staples, Energy, Industrial, Metals and Mining, Oil and Gas Exploration, Utilities, and Telecom.
There are now five green currencies. These include the Brazilian Real, the Canadian Dollar, the Japanese Yen, and the Chinese Yuan. The British Pound is brown and the US Dollar is still red (even though it was in an uptrend in May). I’m going to India in June so this might be a good time to go long the Rupee (remember the Tharp effect, lol).
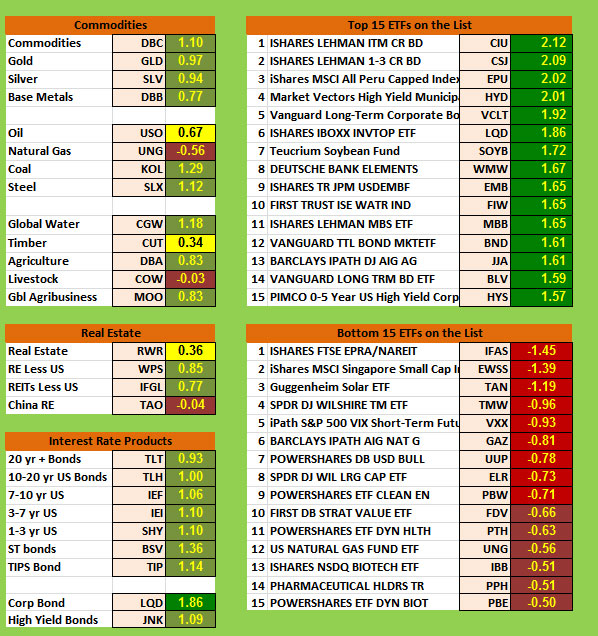
Commodities, Real Estate, Debt, Top and Bottom Lists
The next chart shows real estate, debt instruments, commodities and the top and bottom Market SQN scores for ETFs over the past 100 days.
Again, my comments about this section must be viewed within the context of a falling dollar. Commodities, as a whole, have moved to light green. Commodities, gold, silver, base metals, coal, steel, global water, agriculture and global agribusiness are now all light green. Only natural gas and livestock are brown, while oil and timber are yellow.
The top ranking ETFs in the database are now all dark green, with municipal bonds leading the pack. Four of the top ETFs are now over +2.0 compared with eight last month. Bonds still dominate (despite the potential of interest rate hikes), but some commodities are now in the top 15. Gold, Junior Gold minors, and the Yen have moved out.
The bottom ranking ETFs were all red two months ago, but this month only nine of them are red. And only three of those are worse than -1.0, however, they are not the same three as last month.
Summary
Now let’s look at the summary table which measures the percentage of ETFs in each of the strength categories.
Date |
Very
Bullish |
Bullish |
Neutral |
Bearish |
Very
Bearish |
2013 |
> 1.5 |
0.75 - 1.5 |
0 - 0.75 |
0 - -0.7 |
< - 0.7 |
Jan 31st, |
27.1% |
39.6% |
20.7% |
6.4% |
4.7% |
Feb 28th |
10.3% |
45.2% |
24.4% |
11.9% |
7.5% |
Mar 31st |
39.2% |
25.5% |
19.1% |
9.0% |
6.4% |
Apr 30th |
49.1% |
21.1% |
14.8% |
8.0% |
6.2% |
May 31st |
29,2% |
23.6% |
19.9% |
12.3% |
14.2% |
Jun 30th |
2.1% |
31.0% |
23.2% |
22.0% |
20.9% |
Jul 31st |
8.2% |
33.5% |
29.0% |
13.3% |
15.2% |
Aug 30th |
1% |
15% |
46.4% |
19.3% |
17.5% |
Sep 30th |
1% |
13.8% |
42.3% |
23.0% |
19.1% |
Nov 1st |
13.3% |
48.3% |
21.8% |
12.5% |
3.3% |
Dec 1st |
14.6% |
42.7% |
24.2% |
13.3% |
4.3% |
Dec 31st |
19.3.% |
45.5% |
22.0% |
11.3% |
2.9% |
2014 |
|
|
|
|
|
Jan 31st |
8.0% |
49.3% |
20.7% |
12.7% |
7.6% |
Feb 28th |
18.9% |
48.4% |
18.1% |
6.2% |
6.8% |
Mar 31st |
4.9% |
40.2% |
38.8% |
13.3% |
3.1% |
Apr 30th |
11.1% |
33.9% |
40.2% |
11.3% |
1.8% |
May 31st |
12.5% |
46.5% |
27.7% |
7.6% |
6.0% |
Jun 30th |
53.4% |
33.7% |
14.2% |
2.5% |
0.8% |
Aug 29th |
20.3% |
45.2% |
22.8% |
10.5% |
5.3% |
Sep 30th |
6.6% |
26.9% |
30.2% |
24.0% |
18.5% |
Oct 31st |
2.9% |
17.9% |
38.8% |
17.7% |
26.3% |
Nov 30th |
3.1% |
25.7% |
25.1% |
22.8% |
27.9% |
Dec 31st |
3.7% |
29.2% |
24.8% |
15.6% |
31.2% |
2015 |
|
|
|
|
|
Jan 31st |
7.2% |
9.4% |
35.1% |
25.5% |
27.3% |
Feb 28th |
6.4% |
41.1% |
34.5% |
11.5% |
10.9% |
Mar 31st |
2.3% |
24.0% |
46.4% |
19.7% |
12.9% |
April 30th |
1.6% |
13.6% |
69.4% |
15.0% |
5.7% |
June 30th |
1.4% |
15.8% |
48.5% |
29.0% |
10.7% |
July 30th |
0% |
7.2% |
49.7% |
39.0% |
9.4% |
Aug 31st |
0% |
0.4% |
7.6% |
49.7% |
42.3% |
Sept 30th |
0% |
2.7% |
7.6% |
42.7% |
39.8% |
Oct 31st |
1% |
6.0% |
19.5% |
51.3% |
22.2% |
Nov 30th |
0.8% |
3.1% |
38.0% |
42.1% |
16.0% |
Dec 31st |
1.4% |
1.6% |
16.8% |
56.1% |
24.2% |
2016 |
|
|
|
|
|
Jan 31st |
1.9% |
7.0% |
27.5% |
48.5% |
15.0% |
Feb 29th |
1.6% |
5.7% |
18.5% |
51.9% |
22.4% |
Mar 31st |
5.8% |
9.2% |
27.5% |
46.6% |
10.9% |
Apr 30th |
7.4% |
12.7% |
42.3% |
37.4% |
2.7% |
May 31st |
5.1% |
34.3% |
50.3% |
8.6% |
1.8% |
Seven months ago 92% of the ETFs we track were either in bear or strong bear territory. That number was 78.3% five months ago, 74.3% two months ago, and it moved down to 40.1% in April. In May, we are now at 10.4%.
We are in a sideways market, but the world model picture looks much stronger because of what might be called a crash in the US Dollar. Volatility is still quiet so this market is not that dangerous — yet.
Be careful to base your actions upon what is happening, not what you think might happen.
Until next month, this is Van Tharp.
The markets always offer opportunities, but to capture those opportunities, you MUST know what you are doing. If you want to trade these markets, you need to approach them as a trader, not a long-term investor. We’d like to help you learn how to trade professionally because trying to navigate the markets without an education is hazardous to your wealth. All the beliefs given in this update are my own. Though I find them useful, you may not. You can only trade your own beliefs about the markets.
Free Book
FREE Book!
TRADING BEYOND THE MATRIX
The Red Pill for Traders and Investors
We pay for the book, you pay for shipping.
ALL YOU HAVE TO DO IS CLICK HERE!
Eleven traders tell their stories about transforming their trading results and lives, in this 400 plus page book.
Below is a brief video on how powerful this book is to traders.

Swing Trading Systems E-Learning Course

Ken Long's systematic approach to swing trading with 5 distinct trading systems. This course has over 10 hours of instruction with significant follow-along documents included for students to download.
Review the videos as many times, and as often as you like, for one full year. Plus, you receive a bonus workshop at no extra charge—Dr. Van Tharp's Tharp Think Essentials!
If you are interested in both this video home study program (featuring mechanical, rule-based systems) and our new Advanced Adaptive Swing workshop (adaptive trading systems have rules and rule parameters that adjust to market conditions and price conditions rather than remaining constant) you benefit by buying both at the same time.
When you register for the workshop you can get a 22% discount on this home study.
The home study is not required to attend the workshop, however, an understanding of the systems in the the video home study may help a less experienced trader better understand the more advanced trading style which will be presented in the workshop. The systems, however, are totally different and the Advanced Adaptive Systems Workshop does not build upon the systems in the home study.
You can complete this course at your own pace, from the comfort of your own home or office, and access the materials as many times as you wish during your 1-year subscription period.
Take a look at this video from Ken to learn more about this course.

We have extensive information about the Swing Trading System e-learning course, including how to purchase...click the link below!
Learn More About The Swing E-Learning Course...
Matrix Contest
 Enter the Matrix Contest Enter the Matrix Contest
for a chance to win a free workshop!
We want to hear about the one most profound insight that you got from reading Van's new book, Trading Beyond the Matrix, and how it has impacted your life. If you would like to enter, send an email to [email protected].
If you haven't purchased Trading Beyond the Matrix yet, click here.
For more information about the contest, click here.
Ask Van...
Everything we do here at the Van Tharp Institute is focused on helping you improve as a trader and investor. Consequently, we love to get your feedback, both positive and negative!
Send comments or ask Van a question by clicking here.
Also, Click here to take our quick, 6-question survey.
Back to Top
Contact Us
Email us at [email protected]
The Van Tharp Institute does not support spamming in any way, shape or form. This is a subscription based newsletter.
To change your e-mail Address, e-mail us at [email protected].
To stop your subscription, click on the "unsubscribe" link at the bottom left—hand corner of this email.
How are we doing? Give us your feedback! Click here to take our quick survey.
Call us at: 800-385-4486 * 919-466-0043 * Fax 919-466-0408
SQN® and the System Quality Number® are registered trademarks of the Van Tharp Institute and the International Institute of Trading Mastery, Inc.
Be sure to check us out on Facebook and Twitter!
 
Van Tharp Home • Products • Workshops • Back Issues • Contact • About Van Tharp • Site Map ———————
Back to Top |

