Tharp's Thoughts Weekly Newsletter
-
Article: March 2016 Market Update:
Bear Quiet Market Type
by Van K. Tharp, Ph.D.
-
Workshops: New workshops are coming in July. Two have never been offered before!
-
-
Tip: March 2016 System Quality Number ® Report by Van K. Tharp, Ph.D.
-
$700 Discounts EXPIRE TODAY!
on Our April Peak Performance Workshops!
Come experience for yourself why Peak Performance 101 changes the lives of so many traders...year after year! It has been Van Tharp's signature workshop for decades.
Click here to review our no-risk guarantee on workshops.

April 15-17
Peak Performance 101
The Peak Performance 101 Workshop has helped thousands of traders
improve their trading and it can help improve yours as well.
The video below gives you a quick overview about Peak Performance 101

Do you know how to take your trading to the next level?
Imagine learning ways to perform at a peak level consistently and how those abilities could help boost your bottom line! Then, if you add the compounding effects of better consistency over time, you might grasp the huge returns this course offers — both to your equity and to your mental state.
Dr. Tharp has spent the last twenty-five years plus researching the top traders in the world and how they operate. At Peak Performance 101, you will learn the critical factors these top traders and investors share in common — their real secrets to success, their practices, their mental models and strategies. Put these concepts into daily practice when you return home and see major improvements in your trading results.
Workshop Objectives
Students will learn and begin to understand each of these objectives after attending Peak Performance 101:
- How great traders approach their craft and learn a daily procedure that resembles what they do.
- How you create your own experience in the market and how you are responsible for the results that you get.
- Become more aware of some of your own psychological issues that affect your performance as a trader/investor.
- Learn about expectancy, position sizing strategies and the power of big R-multiples through a simulation game. This game is also designed to help you observe your emotions in a setting in which only a small amount is at stake compared with what you will face in the market.
- Learn some of the variables that affect your emotions and how you can gain control over them.
- Learn to overcome self-sabotage through exercises done in the class.
- Students will get guidance on how to develop an ongoing program to work on themselves using the Super Trader Program as a model.
- Students will leave with a plan to make the maximum use of the workshop.
- Participants in this course will get to meet and network with some really great people who a lot in common with each other.
April 19-22
Peak Performance 202 is one of our most significant
breakthrough workshops. You'll learn how to reinvent yourself as a trader, gain greater control of your life, and broaden your perspective on what is possible. Step out of your comfort zone. In Peak Performance 202, you’ll learn how to make a declaration for a trading vision that might seem all but impossible now. You’ll learn how it IS possible, and how you can take the first steps toward a new you, and success that’s beyond your current scope of understanding. This workshop is that powerful.
May 17-19
Peak Performance 203 - The Happiness Workshop Dr. Tharp has now discovered how to help people through these self-sabotage issues at the deepest level. And the basic concept is simple: When you are not doing what brings you joy, you are committing self-sabotage. Imagine moving toward being happier and happier, and at the same time becoming more and more successful as a trader. Well, that’s the core concept behind Peak Performance 203 Workshop: Avoiding Self-Sabotage by Following Your Bliss.
May 21-23
New! Modeling Great Trading Through Mental Strategies (Peak 204) The material presented in this new, advanced workshop is poised to make a dramatic impact on your life. While in attendance, you will gain understanding about how you are the central character in your story, and how you really create this story, and see how you can ultimately play an active role in shaping your own life. By thoroughly exploring how each of us uses mental strategies and the sequencing of thoughts, you will have the groundwork to continue to hone your skills throughout the workshop, and beyond.
Click Here to Register NOW!
Feature Article
March 2016 Market Update:
Bear Quiet Market Type
by Van K. Tharp, Ph.D.
Click here to resolve formatting problems
I always say that people do not trade the markets; they trade their beliefs about the markets. In that same way, I'd like to point out that these updates reflect my beliefs. I find the market update information useful for my trading, so I do the work each month and am happy to share that information with my readers. If your beliefs are not similar to mine, however, then this information may not be useful to you. Thus, if you are inclined to go through some sort of intellectual exercise to prove one of my beliefs wrong, simply remember that everyone can usually find lots of evidence to support their beliefs and refute others. Simply know that I admit that these are my beliefs and that your beliefs might be different.
These monthly updates are in the first issue of Tharp's Thoughts each month which allows us to get the closing data from the previous month. These updates cover 1) the market type (first mentioned in the April 30, 2008 edition of Tharp's Thoughts), 2) the debt statistics for the US, 3) the five-week status on each of the major US stock market indices, 4) our four star inflation-deflation model, and 5) tracking the US dollar. I also write a report on the strongest and weakest areas of the overall market as a separate SQN™ Report. Significant market charges may mean the SQN Report comes out more than once a month.
Part I: The Big Picture
So what are the markets telling us now?
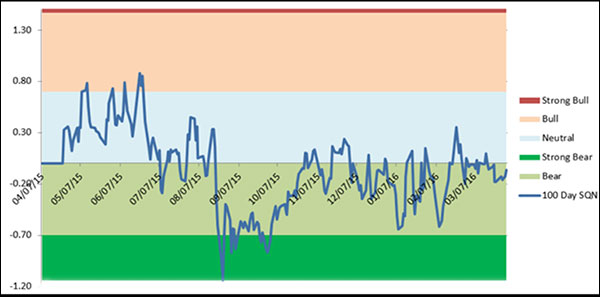
Over the last 100 days, the S&P 500 is down 1.3%. The Market SQN score for the 100 day period was in bearish territory for 16 out of 22 days during the month of March. The remainder measured as a sideways market. This was despite the fact that the S&P was down on only 7 of the 22 trading days of the month. Why do we have this difference? 100 days ago, we had just had a huge rally but our current rally has still not taken us to the levels of early November. Even with the bearish Market SQN score, we have come nowhere near a 20% drop — which is the official designation of a bear market. For market volatility, the S&P 500 was in the volatile range in the first day of March, normal throughout most of the month, and then it became quiet on the 30th.
Debt Clock
The State of the United States |
Month Ending |
National Debt |
Federal Tax Revenue |
Federal Spending |
Trade Deficit |
Debt Per Family |
Unfunded Liabilities |
Taxpayers |
People supported by them |
July 31 2012 |
$15.93 trillion |
$2.364 trillion |
$3.632 trillion |
$810 billion |
$684,405 |
|
|
|
Dec 30 2012 |
$16.42 trillion |
$2.452 trillion |
$3.540 trillion |
$740.7 billion |
$732,086 |
|
|
|
July 31, 2013 |
$16.89
Trillion |
$2.73
trillion |
$3.535 trillion |
$703 billion |
$748,458 |
Unfunded Liabilities |
115.2 million |
109.9M
95.4% |
Dec 31, 2013 |
$17.27 trillion |
$2,82 trillion |
$3,480 trillion |
$692 billion |
$751,294 |
$127.2 trillion |
115.0 million |
108.5M
94.3% |
Aug 31, 2014 |
$17.70 trillion |
$2.97 trillion |
$3.53 trillion |
$706 billion |
$757,297 |
$118.0
trillion |
116.5 million |
104.5M
90.0% |
Dec 31, 2014 |
$18.04 trillion |
$3.08 trillion |
$3.57 trillion |
$713.2 billion |
$733,741 |
$92.5 trillion |
117.3 million |
104.4M
89.0% |
Jul 31, 2015 |
$18.32 trillion |
$3.15 trillion |
$3.65 trillion |
$723.4 billion |
$753,212 |
$97.2 trillion |
118.7 million |
105.0M
88.4% |
Aug 31, 2015 |
$18.37 trillion |
$3.16 trillion |
$3.66 trillion |
$729.7 billion |
$753,533 |
$97.5 trillion |
118.9 million |
104.9M 88.2% |
Sep 30, 2015 |
$18.41 trillion |
$3.18 trillion |
$3.68 trillion |
$726.6 billion |
$800,855 |
$97.7 trillion |
119.0 million |
105M
88.2% |
Oct 31, 2015 |
$18.43 trillion |
$3.26 trillion |
$3.70 trillion |
$736.9
billion |
$805,560 |
$98.8 trillion |
119.2 million |
105M
88.1% |
Nov 30, 2015 |
$18.71 trillion |
$3.29 trillion |
$3.72 trillion |
$732.4 billion |
$810,044 |
$100.3 trillion |
119.4 million |
105.1M
88.0% |
Dec 31, 2015 |
$18.51 trillion |
$3.30 trillion |
$3.74 trillion |
$731.1 billion |
$789,359 |
$100.7 trillion |
119.6 million |
105.1M
87.9% |
Jan 31, 2016 |
$18.96 trillion |
$3.31 trillion |
$3.76 trillion |
$732.1 billion |
$793,400 |
$101.0 trillion |
119.6
Million |
105.5M
88.0% |
Feb 29, 2016 |
$19.06 trillion |
$3.33 trillion |
$3.78 trillion |
$739.7 billion |
$796,710 |
$101.3 trillion |
119.6 million |
105.6M
88.2% |
Mar 31, 2016 |
$19.20 trillion |
$3.31 trillion |
$3.80 trillion |
$734.6 billion |
$792,131 |
$101.7 trillion |
119.7 million |
105.1
87.8% |
In 2016, usdebtclock.org says our official debt has gone over the $19 trillion mark, now at $19.20 trillion. We are in an election year, but don’t ever expect a reasonable politician who will actually address the real issues. There is too much corruption in government. And by the way, politics is a game where the candidates argue about non-relative issues and stir up the public, however, anyone who campaigns on real reform — such as starting a plan to eliminate deficit spending (much less the debt) is considered to be too far out there to be a legitimate candidate. That’s why I tend to consider politics as a joke. And the voting choice this year might be between Hillary Clinton and Donald Trump — come on.
Let’s look at this year’s top three candidates for a moment — Donald Trump — a former democrat who decided to run for publicity and feels he can say anything — including that he’d reduce our deficit by $19 trillion during his term. Ted Cruz — who has impeccable credentials, is liked by no one in congress, and probably cannot be trusted at all. Hillary Clinton who (in my opinion) is one of the most corrupt politicians around — and I’ve thought so for many, many years. She was given $675,000 for three speeches to Goldman Sachs in 2013. That’s interesting, my speaking fee is about $20,000 per day, and I was paid zero by major Wall Street firms during that time. What could Hillary be telling them that is worth that much?
Part II: The Current Stock Market Type Is Bear Quiet
My market type classification is not predictive but descriptive — rather than telling us what’s going to happen, it simply tells us what’s going on now. It’s like looking at a trend. You can say, well, right now it’s going down, however, that doesn’t mean that in a few days the direction might change.
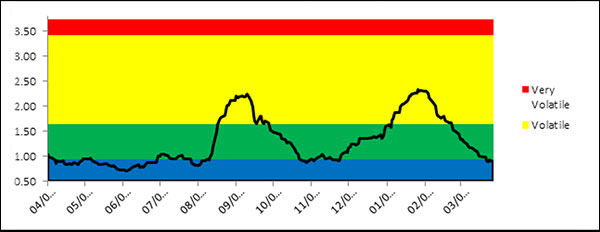
The graphs below include a chart of weekly bars for the S&P 500 over the last year, the Market SQN® score for 100 days, and the ATR percent volatility.
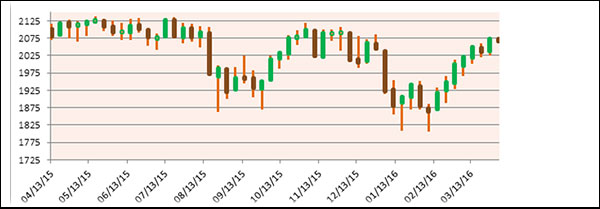
The chart below shows that the market has been in bear territory for most of the last six months even though it has never really declined by a serious amount. Because of the prior recovery in October (a little more than 100 days ago) I expected the market might stay in bear territory in March, which it did. But right now, the market is pretty much in limbo.
The third chart shows that this market is starting to look much less ominous as we have had a huge decline in volatility over the month of March.
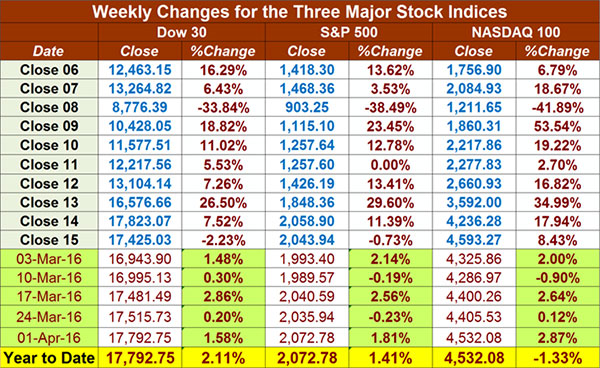
Below is a chart of the recent weekly changes in the three major US Indices. We now have two of our three major indices for the US up slightly for the year. The DOW is up 2.11%, the S&P500 is up 1.41%, and NASDAQ 100 is down -1.33% for the new year.
Part III: Our Four Star Inflation-Deflation Model
In the simplest terms, inflation means that stuff gets more expensive, and deflation means that stuff gets cheaper. There’s a correlation between the inflation rate and market levels, so understanding inflation and deflation can help traders understand some important big-picture processes.
See the tracking table below.
Date |
CCI> DBC |
XLB |
Gold |
XLF |
Total Score |
Dec ‘05 |
347.89 |
30.28 |
513 |
31.67 |
|
Dec ‘06 |
394.89 |
34.84 |
635.5 |
36.74 |
|
Dec ‘07 |
476.08 |
41.7 |
833.3 |
28.9 |
|
Dec ‘08 |
352.06 |
22.74 |
865 |
12.52 |
|
Dec ‘09 |
484.42 |
32.99 |
1,104.00 |
14.1 |
|
Dec ‘10 |
629.53 |
38.47 |
1,410.25 |
16 |
|
Dec ‘11 |
564.37 |
33.5 |
1,574.59 |
13 |
|
Dec ’12 CCI>DBC |
556.08
27.79 |
37.54 |
1,564.80 |
16.39 |
1 |
Dec ‘13 |
25.66 |
46.22 |
1201.50 |
21.86 |
-1.5 |
Dec ‘14 |
18.45 |
48.59 |
1199.25 |
24.73 |
-3.0 |
Jun ’15 |
18.00 |
48.39 |
1176.00 |
24.38 |
-1.0 |
Jul ’15 |
15.73 |
45.94 |
1098.40 |
25.18 |
-2.5 |
Aug ’15 |
15.69 |
43.36 |
1135.00 |
23.42 |
-2.5 |
Sep ‘15 |
15.15 |
39.95 |
1114.00 |
22.66 |
-2.0 |
Oct’ 15 |
15.20 |
45.28 |
1142.35 |
24.08 |
-1.5 |
Nov’ 15 |
14.19 |
45.57 |
1061.90 |
24.56 |
-2.0 |
Dec’ 15 |
13.36 |
43.42 |
1062.25 |
23.83 |
-2.0 |
Jan’ 16 |
12.78 |
38.77 |
1111.80 |
21.72 |
0.0 |
Feb ‘16 |
12.75 |
41.80 |
1234.90 |
21.09 |
0.0 |
Mar’ 16 |
13.29 |
44.81 |
1237.00 |
22.50 |
+2.0 |
Here are the model components and how the prices looked at the end of February compared with two months back and six months back.
Month |
DBC2 |
DBC6 |
XLB2 |
XLB6 |
Gold2 |
Gold6 |
XLF2 |
XLF6 |
Total Score |
|
Higher |
Lower |
Higher |
Higher |
Higher |
Higher |
Higher |
Lower |
|
Mar 16 |
|
-1/2 |
|
+1 |
|
+1 |
|
+1/2 |
2.0 |
So at +2.0 we have our first sign of inflation in some time. The Federal Reserve has started to raise interest rates, but they are also very cautious right now and what they’ve done so far has had little impact on the economy.
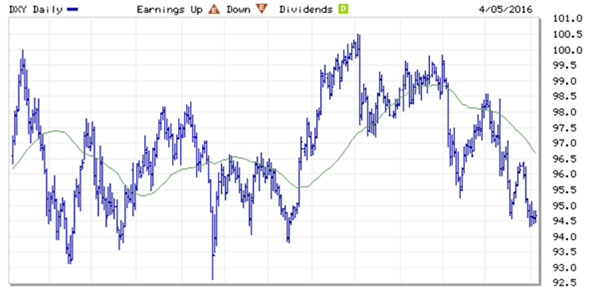
Part IV: Tracking the Dollar
The US Dollar Index was falling throughout most of March and is now around 95. When I arrived in Sydney in early March, the Aussie Dollar was about 0.76 but by the time I left they were asking about .80. That’s the Tharp travel impact for you.
Conclusion
The market spent almost all of 2015 in a neutral to down direction — that is the market type was mostly sideways and quiet (volatility). Those market types are about the hardest kinds in which to make money.
The US dollar (because the Fed started to raise interest rates) has remained strong but it’s not what I’d expect for a country with rising interest rates. And although our debt continues to grow at unsustainable rates, we suddenly have a one month sign of inflation which has been rare over the last few years. Europe is not in good shape. We have a major bear market in commodities with energy in a major decline. The economy in China is in bad shape and their equity markets are in a major bear phase.
While we do not use market type to predict, just to tell us what is happening right now, the fundamentals would suggest that we are due for a significant bear market in 2016. Watch volatility. If it starts to climb, the bear market will resume. If volatility continues to be quiet, then I’d expect either a sideways market to continue or a slow climb to new highs.
My conclusion ... the market type right now is bear quiet. This is a very rare market type — so it will likely not last very long. Right now we are in a short-term rally. Who knows what it will be at the end of next month. Can you make money in this climate? If yes, then do what you do.
Until next month’s update, this is Van Tharp.
About the Author: Trading coach and author Van K. Tharp, Ph.D. is widely recognized for his best-selling books and outstanding Peak Performance Home Study Program—a highly regarded classic that is suitable for all levels of traders and investors. You can learn more about Van Tharp at www.vantharp.com. His new book, Trading Beyond The Matrix, is available now at matrix.vantharp.com.
Workshops
Combo Discounts available for all back-to-back workshops!
See our workshop page for details.
Trading Video
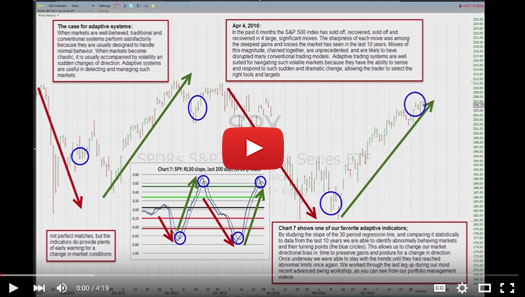
NEW Trading Video From Ken Long
How have your trading systems been performing in the last nine months? Dr. Ken Long describes some unique conditions that have made this market challenging for a number of trading systems. Over time, Ken has been evolving some of his systems and the ways he trades to be more adaptive to market conditions. He introduces the idea of adaptive systems in this four minute video and alerts everyone to a possible market signal.
Trading Tip
March 2016 System Quality Number® Report
The SQN® Report
by Van K. Tharp, Ph.D.
Click here to resolve formatting problems
There are numerous ETFs that now track everything from countries, commodities, currencies and stock market indices to individual market sectors. ETFs provide a wonderfully easy way to discover what’s happening in the world markets. Consequently, I now apply a version of my System Quality Number® (SQN®) score to measure the relative performance of numerous markets in a world model.
The Market SQN score uses the daily percent change for input over a 100-day period. Typically, a Market SQN score over 1.47 is strongly bullish and a score below -0.7 is very weak. The following color codes help communicate the strengths and weaknesses of the ETFs in this report:
- Dark Green: ETFs with very strong SQN® 100 scores > 1.47
- Light Green: ETFs with strong SQN 100 scores (0.70 to 1.47).
- Yellow: ETFs with slightly positive Market SQN scores (0 to 0.70). These are Neutral/Sideways
- Brown: ETFs with slightly negative Market SQN scores (0 to -0.7).
- Red: Very weak ETFs that earn negative Market SQN scores (< -0.7).
This is basically the same rating scale that we use for the Market SQN® Score in the Market Update. The world market model spreadsheet report below contains most currently available ETFs; excluding inverse funds and leveraged funds. In short, it covers equity markets around the globe, major asset classes, equity market segments, industrial sectors, and major currencies.
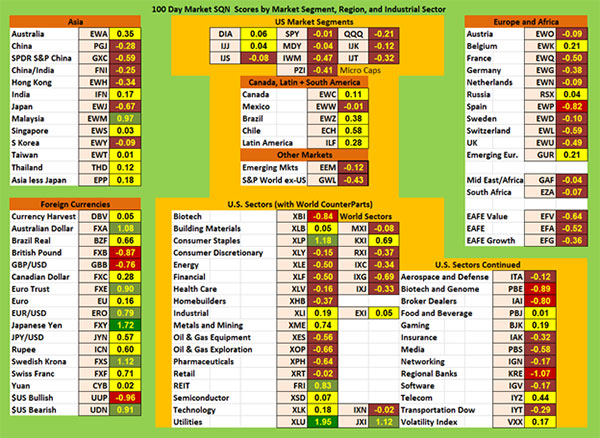
World Market Summary — Equities & Currencies
Each month, we look at the equities markets across the globe by segment, region, and sector. March looks a little stronger than last month.
All of the US major market segments are brown and negative except for the large cap value DIA at 0.06 and the mid-cap value IJJ at 0.04. The rest of the Americas are also all yellow except for Mexico. That’s better than last month.
In our far left section of the model (Asia and Australia), Australia, India, Singapore, Taiwan, and Thailand are all yellow. Malaysia is actually light green.
Europe is mostly brown with three yellow countries and one red. The yellows (neutral) are Belgium, Russia, and Emerging Europe. Spain is red. Again this is an improvement over last month.
The US sector view is quite mixed. There are two light greens and one dark green area. So money is really going into utilities (XLU) and the light greens are consumer staples and REITS. There are nine yellow sectors, fifteen brown sectors, and three red sectors which balance out the greens. The reds are Biotech and Genomes, Broker Dealers (the price of the company you trade through - be sure it's solid), and Regional Banks.
The Japanese Yen is the strongest currency despite their negative interest rates. The Aussie Dollar (as I predicted last month due to the Tharp travel effect) is also light green at 1.08 — the third strongest on the chart. The Euro versus the US Dollar, the Swedish Krona and the inverse of the US Dollar are all light green. The British Pound and the US Dollar are both red. I travel to India in June, so watch the Rupee — which is currently yellow.
Commodities, Real Estate, Debt, Top and Bottom Lists
The next chart shows real estate, debt instruments, commodities and the top and bottom ETFs for the past 100 days.
Commodities are still red and brown but with five exceptions — Gold is now light green. In the March Update article above, I mentioned our inflation-deflation model showed inflationary signs in March. Silver, Base Metals, Steel, and Livestock are all yellow. Everything else is either brown or red. Oil, Natural Gas, and Commodities, in general, are still red.
In addition, US real estate is now yellow and Chinese real estate is brown.
Junk bonds are brown, but all other bonds are either dark green or light green. Interestingly, inflation protected bonds are the strongest. And shorter term bonds are stronger than longer term bonds. Again, people are fleeing into defensive investments, but bonds tend to go down when interest rates go up.
The top ranking ETFs in the database are now all dark green, with municipal bonds leading the pack. Six of the ETFs are now over +2.0 compared with just one last month.
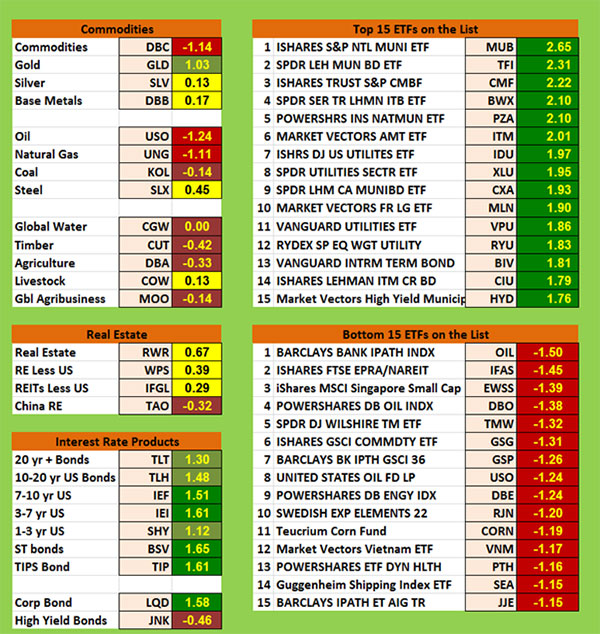
The bottom list are all red, but the worst score is only -1.50. Last month Natural Gas was below -2.0. There are a lot of energy funds in the bottom 15.
Summary
Now let’s look at the summary table which measures the percentage of ETFs in each of the strength categories.
Date |
Very
Bullish |
Bullish |
Neutral |
Bearish |
Very
Bearish |
2013 |
> 1.5 |
0.75 - 1.5 |
0 - 0.75 |
0 - -0.7 |
< - 0.7 |
Jan 31st, |
27.1% |
39.6% |
20.7% |
6.4% |
4.7% |
Feb 28th |
10.3% |
45.2% |
24.4% |
11.9% |
7.5% |
Mar 31st |
39.2% |
25.5% |
19.1% |
9.0% |
6.4% |
Apr 30th |
49.1% |
21.1% |
14.8% |
8.0% |
6.2% |
May 31st |
29,2% |
23.6% |
19.9% |
12.3% |
14.2% |
Jun 30th |
2.1% |
31.0% |
23.2% |
22.0% |
20.9% |
Jul 31st |
8.2% |
33.5% |
29.0% |
13.3% |
15.2% |
Aug 30th |
1% |
15% |
46.4% |
19.3% |
17.5% |
Sep 30th |
1% |
13.8% |
42.3% |
23.0% |
19.1% |
Nov 1st |
13.3% |
48.3% |
21.8% |
12.5% |
3.3% |
Dec 1st |
14.6% |
42.7% |
24.2% |
13.3% |
4.3% |
Dec 31st |
19.3.% |
45.5% |
22.0% |
11.3% |
2.9% |
2014 |
|
|
|
|
|
Jan 31st |
8.0% |
49.3% |
20.7% |
12.7% |
7.6% |
Feb 28th |
18.9% |
48.4% |
18.1% |
6.2% |
6.8% |
Mar 31st |
4.9% |
40.2% |
38.8% |
13.3% |
3.1% |
Apr 30th |
11.1% |
33.9% |
40.2% |
11.3% |
1.8% |
May 31st |
12.5% |
46.5% |
27.7% |
7.6% |
6.0% |
Jun 30th |
53.4% |
33.7% |
14.2% |
2.5% |
0.8% |
Aug 29th |
20.3% |
45.2% |
22.8% |
10.5% |
5.3% |
Sep 30th |
6.6% |
26.9% |
30.2% |
24.0% |
18.5% |
Oct 31st |
2.9% |
17.9% |
38.8% |
17.7% |
26.3% |
Nov 30th |
3.1% |
25.7% |
25.1% |
22.8% |
27.9% |
Dec 31st |
3.7% |
29.2% |
24.8% |
15.6% |
31.2% |
2015 |
|
|
|
|
|
Jan 31st |
7.2% |
9.4% |
35.1% |
25.5% |
27.3% |
Feb 28th |
6.4% |
41.1% |
34.5% |
11.5% |
10.9% |
Mar 31st |
2.3% |
24.0% |
46.4% |
19.7% |
12.9% |
April 30th |
1.6% |
13.6% |
69.4% |
15.0% |
5.7% |
June 30th |
1.4% |
15.8% |
48.5% |
29.0% |
10.7% |
July 30th |
0% |
7.2% |
49.7% |
39.0% |
9.4% |
Aug 31st |
0% |
0.4% |
7.6% |
49.7% |
42.3% |
Sept 30th |
0% |
2.7% |
7.6% |
42.7% |
39.8% |
Oct 31st |
1% |
6.0% |
19.5% |
51.3% |
22.2% |
Nov 30th |
0.8% |
3.1% |
38.0% |
42.1% |
16.0% |
Dec 31st |
1.4% |
1.6% |
16.8% |
56.1% |
24.2% |
2016 |
|
|
|
|
|
Jan 31st |
1.9% |
7.0% |
27.5% |
48.5% |
15.0% |
Feb 29th |
1.6% |
5.7% |
18.5% |
51.9% |
22.4% |
Mar 31st |
5.8% |
9.2% |
27.5% |
46.6% |
10.9% |
Five months ago 92% of the ETFs we track are either in bear territory or strong bear territory. That number was 78.3% three months ago, 74.3% last month, and this month it has moved down to 57.5%. We are in a mild bear market which could get worse. Watch volatility.
Be careful to base your actions upon what is happening, not what you think might happen.
Until next month, this is Van Tharp.
The markets always offer opportunities, but to capture those opportunities, you MUST know what you are doing. If you want to trade these markets, you need to approach them as a trader, not a long-term investor. We’d like to help you learn how to trade professionally because trying to navigate the markets without an education is hazardous to your wealth. All the beliefs given in this update are my own. Though I find them useful, you may not. You can only trade your own beliefs about the markets.
Free Book FREE Book!
TRADING BEYOND THE MATRIX
The Red Pill for Traders and Investors
We pay for the book, you pay for shipping.
ALL YOU HAVE TO DO IS CLICK HERE!
Eleven traders tell their stories about transforming their trading results and lives, in this 400 plus page book.
Below is a brief video on how powerful this book is to traders.

Swing Trading Systems E-Learning Course

Ken Long's systematic approach to swing trading with 5 distinct trading systems. This course has over 10 hours of instruction with significant follow-along documents included for students to download.
Review the videos as many times, and as often as you like, for one full year. Plus, you receive a bonus workshop at no extra charge—Dr. Van Tharp's Tharp Think Essentials!
If you are interested in both this video home study program (featuring mechanical, rule-based systems) and our new Advanced Adaptive Swing workshop (adaptive trading systems have rules and rule parameters that adjust to market conditions and price conditions rather than remaining constant) you benefit by buying both at the same time.
When you register for the workshop you can get a 22% discount on this home study.
The home study is not required to attend the workshop, however, an understanding of the systems in the the video home study may help a less experienced trader better understand the more advanced trading style which will be presented in the workshop. The systems, however, are totally different and the Advanced Apative Systems Workshop does not build upon the systems in the home study.
You can complete this course at your own pace, from the comfort of your own home or office, and access the materials as many times as you wish during your 1-year subscription period.
Take a look at this video from Ken to learn more about this course.

We have extensive information about the Swing Trading System e-learning course, including how to purchase...click the link below!
Learn More About The Swing E-Learning Course...
Matrix Contest
 Enter the Matrix Contest Enter the Matrix Contest
for a chance to win a free workshop!
We want to hear about the one most profound insight that you got from reading Van's new book, Trading Beyond the Matrix, and how it has impacted your life. If you would like to enter, send an email to [email protected].
If you haven't purchased Trading Beyond the Matrix yet, click here.
For more information about the contest, click here.
Ask Van...
Everything we do here at the Van Tharp Institute is focused on helping you improve as a trader and investor. Consequently, we love to get your feedback, both positive and negative!
Send comments or ask Van a question by clicking here.
Also, Click here to take our quick, 6-question survey.
Back to Top
Contact Us
Email us at [email protected]
The Van Tharp Institute does not support spamming in any way, shape or form. This is a subscription based newsletter.
To change your e-mail Address, e-mail us at [email protected].
To stop your subscription, click on the "unsubscribe" link at the bottom left—hand corner of this email.
How are we doing? Give us your feedback! Click here to take our quick survey.
Call us at: 800-385-4486 * 919-466-0043 * Fax 919-466-0408
SQN® and the System Quality Number® are registered trademarks of the Van Tharp Institute and the International Institute of Trading Mastery, Inc.
Be sure to check us out on Facebook and Twitter!
 
Back to Top |

