Tharp's Thoughts Weekly Newsletter
-
Article: Financial Decisions by Ivan Obolensky
-
Workshops: Van Tharp Returns to Australia! Prices On Two Workshops Reduced!
-
Tip: Did the Market Just Flash a Classic Double Bottom with Divergence?
by D. R. Barton, Jr.
-
Sydney, Australia Events Are Fast Approaching!
March 11-21!
Dr. Van Tharp is presenting three essential trading workshops in March.
He teaches in Australia only once each year.
Register now while early enrollment discounts are still available.
Plus, see our recently reduced pricing on two of the events!

Australian Dollar to US Dollar Exchange Rate Relief!
We are REDUCING prices on two workshops in Sydney next month.
We have dropped the price by more than $800 (AUD) on Peak Performance 101 and Blueprint for Trading Success to help offset the current exchange rate.
Learn more...
Feature Article
Financial Decisions
by Ivan Obolensky
Click here to resolve formatting problems
Nevsky Capital is a Hedge Fund that has returned some 1,216% since its inception in 2000. To put this return in perspective, if you invested $100,000 when it opened its doors, today that investment would be worth over a million dollars.
The fund has over 1.5 billion dollars under management.
In spite of this success, Nevsky Capital just returned all money to investors1. How come?
A “Hedge Fund” is a managed pool of money that invests in whatever the manager thinks will create a substantial return.
For instance, they might use your cash investment as collateral to borrow five times that amount. If the fund invests in something that pays 10%, the return on the capital invested is 50%, or five times more, less the cost of borrowing (cost of capital). Hedge funds invest in almost any financial product from ordinary stocks to the most sophisticated and arcane derivatives. These are relatively recent investment vehicles.
The first hedge fund was started by Alfred Jones in 1948. While working as an editorial writer for Fortune magazine, he decided to manage money instead. He started with $100,000 of which he personally contributed $40,000. His objective was to reduce the risk in holding long term stock investments by short selling (betting that a specific stock would go down in price). This strategy offset large declines in the portfolio value which made returns less volatile and more consistent.2
Today there are many hedge funds, but recently, a number of funds have closed their doors.
Nevsky Capital cites the rising cost of capital and the uncertain investment environment the fund managers see going forward. Its letter to investors (see footnote) is instructive. By reviewing some basics and their reasoning behind the decision, perhaps we can learn something about today’s economic climate.
“Cost of Capital” is a fundamental concept. For an investment to be worthwhile, the return must be greater than the cost required to make it. When we buy a house and don’t pay cash, we borrow from the bank often at a fixed rate of interest. The interest paid is the cost of capital. Twenty years ago mortgage interest was around 10%. Buying a million-dollar home with twenty percent down meant paying $80,000 per year (almost $7,000 per month) on interest alone. Today at 3%, the interest would be $24,000 or only $2,000 per month. Many more people can afford larger mortgages and bigger homes because the cost of capital is lower. That interest rates remained low for so long has had an enormous impact across all strata of society in terms of quality of life and living standards. Many more people can afford to own their homes rather than rent.
Another economic term is “Opportunity Cost”. It is the cost of choosing the next best alternative. As an example, suppose you are a farmer and must choose between planting carrots or potatoes. Your choice is mutually exclusive, you can only choose one, not both. You have to forego other alternatives. Let us suppose that carrots are selling today for three dollars a bushel and one dollar a bushel for potatoes. You can expect to sell 1,500 bushels of either one. At three dollars, the carrots are expected to return $4,500 while potatoes will return only $1,500. You decide to go with carrots. The opportunity cost, if you planted potatoes and prices stayed the same, is the difference between the two: $3,000 dollars.
The term implies there is an opportunity available compared to what you could be doing with your time, or your money. If you choose the lesser alternative, it will cost you. This also applies in a more abstract sense.
If a friend says he or she wants you to go out with them when normally you would stay home and watch TV, you might consider it an opportunity because of the pleasure you would experience when compared to the same old same old. The opportunity cost of staying home is the potential pleasure and satisfaction you would not experience if you decided not to accept.
As with much economic theory, it sounds neat and logical. In reality, one can never know the opportunity cost until after the fact. At the time we must choose, calculating the opportunity cost is often simply our best guess as to which path leads to the most desirable outcome. We never have the benefit of hindsight. All we have are our own ideas about possible futures. This adds complications. Much of the structure of markets is due to this one fact.
Going back to our example, suppose every farmer in your area also decides to plant carrots having looked at the same numbers. At harvest time, the price of carrots drops to one dollar a bushel while potatoes are few and far between. Potatoes rise to three dollars a bushel. Many other farmers wished they had planted potatoes, but you were smarter and thankfully did something different. You considered the idea that others might also want to plant carrots which would drop the price at harvest and in anticipation, made the decision to pre-sell your entire crop of carrots to a wholesaler before you planted at the then price of 3 dollars. This is called a “forward contract”, or simply a “forward”. The agreement was for you to supply 1,500 bushels of carrots at harvest time. In exchange, the wholesaler wrote you a check for $4,500 today. You are happy. You wisely hedged the sale price of your crop by offsetting it with a forward and were successful. This is the original meaning of the term “hedge” in hedge fund. The first of its kind hedged, or limited, the downside risk inherent in the investments it held.
If carrots were a major commodity such as gold, oil, or steel, then there might be many such agreements; so many in fact that it would be worthwhile creating a set of standardized contracts that could be traded continuously. Thus was born the concept of an exchange whose function is/was to match buyer with seller and seller with buyer. This is the fundamental beneath all futures and commodity markets which now encompass many different products including financial instruments such as government debt and baskets of stocks such as the S&P 500.
The example also points out another element in the money, economics, and the financial arena: the importance of what others are doing and thinking of doing.
If you were the only carrot producer, then what other participants did would hardly matter, but we are rarely the only players and thus, we have to constantly make choices based on what we know and just as importantly, what we think others know and will do.
This process applies even to a simple activity such as hosting a party. If you want to have guests, you have to invite them and they have to accept. Each invitation when it arrives implies an opportunity cost to the receiver. The potential guest has to decide between accepting or doing something else. Not knowing that there is another party happening the same day can crimp your plans. Successful party people scope out what else is scheduled on their party day. This is called “discovery”.
Price discovery is also a fundamental part of markets. What is the current price of an item and is it correct? This concept has important ramifications.
If store A is selling the same product for half the price compared to store B, which store has the correct price?
From a buyer perspective, it is simple: the lower one is correct. The seller’s point of view may be different. What if the sales person in store A mislabeled the product? By the time management of store A discovers the error, the store has sold hundreds of items and lost thousands of dollars on every sale. They are out of business even while they outsold their competition. In spite of many buyers getting a good deal, think about the following: is it possible that the consumer was actually harmed because of this pricing error? There is now only one option: store B - which may now raise prices simply because it can. Maybe the pricing mistake wasn’t such a good deal for the consumer after all.
In a slightly different scenario, imagine that store A slashed their prices deliberately, having enough reserves to cover the costs. Over time it drives store B and many other stores out of business. This allows store A to eventually raise prices. Imagine A stands for Amazon. Is that a possibility?
In our carrot-potato example, the correct current price of carrots and potatoes was key to the decision process of what to plant and how to hedge. Price discovery is vital for markets and all decision makers. It presupposes transparency. But what if there is a growing trend in the opposite direction, toward deliberate opaqueness?
With these basics in mind, let’s review Nevsky Capital’s decision. To be successful in their approach they required the following:
- Access to transparent and accurate macro and company specific financial data.
- Logical decision processes by global policy makers.
- Clear information on the positions of other players in the markets to get an
accurate picture of pricing (price discovery).
- Markets that move in different directions at different times.
- Manageable risk procedures for long-tail risk.
[Note about long-tail risk: Most readers are familiar with the normal bell-shaped curve. The curve is most obvious in observational measurements. If one measured the length of a steel rod a thousand times to a certain level of accuracy (say to the nearest .001 of an inch) and plotted all these observations, the graph of them would bunch around a central point with some observations higher and some lower. The graph would assume the classic bell shape. Mathematicians, such as Gauss and Adrain, developed formulas that duplicated the observed curves precisely. Most of elementary statistics has to do with using the characteristics of this curve to make probability decisions. Unfortunately, markets are not so simple. Real market data shows that the tails on both the upside and the downside are much longer and thicker than those of the normal curve implying that there are many more large events (crashes and blow-offs) than would be expected using the normal curve. This concept is referred to as Fat Tail or Long Tail risk: the possibility of a large unpredicted good or bad event.]
Nevsky Capital pointed out in its announcement that it was unable follow its procedures. Some of the reasons it listed were:
- China is the world’s 2nd largest economy with India becoming the 3rd in the next ten years. China has reported GDP growth of 7.1% and India reported theirs at 7.4%. Their numbers, whether deliberately or otherwise, are inaccurate and probably much smaller, but the main point is that they are wrong. To base investment decisions on obviously incorrect information is not a wise course. Even if one adds a fudge factor, what are the real numbers? Further, if those numbers are wrong, what else is?
- Since the Global Financial Crisis in 2008, there has been a growing trend for corporations to withhold information rather than be forthcoming. Much of this inclination is the result of the possibility of having this information proved wrong in the eyes of courts and regulators. In the corporate world of today, less disclosure is better business. Unfortunately, this behavior heightens the likelihood of headline risk or unpredicted disasters that are not anticipated in terms of earnings and other key metrics.
- In addition, politics has entered the economic arena and political expediency usually wins out over sound logic in the short-term. Unfortunately, the “short-term” can continue for quite a long period in the context of the economy.
- Active investment management has been shunned in favor of index investing simply because no manager can survive the periodic under-performance that active-management can yield, hence the move toward investing only in indexes which has in effect reduced the diversity of investors, methodologies, and volume.
- Past regulation changes have made High Frequency Trading possible and this has affected liquidity and precipitated price movements that seem to have no logical basis. (See Computer Games). Logical correlations between asset classes are also becoming difficult to discern for investors dealing with fundamental data.
- The US Federal Reserve may have to raise rates more quickly than anticipated causing other interest rates to follow at a pace much faster than the market currently believes, as reflected in the current level of prices.
They concluded as follows:
“In summary, all of the above factors now mean that it is more difficult than ever before for us to accurately forecast macroeconomic and corporate variables. This pushes up our cost of capital and substantially increases the risk of us suffering substantial capital loss on individual positions either because of forecast error or simply because we got caught up in an erroneous market trend, which could then persist for far longer than we could take the pain. This has made what we enjoy most — the thrill of analyzing economic data releases and company accounts — no longer enjoyable. It is therefore time to accept that what we have done has worked brilliantly for twenty years but does not work anymore and move on. We are confident our process will eventually work again — for the laws of economics will never be repealed — but for now they are suspended and may be for some time; an indefinite period involving indeterminate levels of risk during which we think it would be wrong for us to be the steward of your money.”3
If one of the better money managers in the world feels this way, how should we feel in comparison?
Ultimately each of us must weigh the opportunity costs and do the best we can with the information we have both economically and intellectually. We will always have to make decisions based on incomplete information however we choose. It is important to be aware of what others are doing and thinking of doing, perhaps now more than ever. It is also essential that each of us do our research and that we demand and get accurate information, not just financial, in order to make the best decision possible.
Times may be tough in the markets, but they don’t last forever. In the meantime, we have to make decisions regardless. Knowing the current state of the game helps.
Copyright © 2016 Ivan Obolensky http://www.dynamicdoingness.com
Ivan recently joined Dr. Tharp's Super Trader Program and we look forward to publishing more of his insightful articles.
-
Durden T. (2015) Why $1.5 Billion Nevsky Capital Is Shutting Down: The Full Letter, Zero Hedge. Retrieved January 6, 2016 from http://www.zerohedge.com/news/2016-01-05/why-15-billion-nevsky-capital-shutting-down-full-letter.
- McWhinney, J. E. (2005) A Brief History of Hedge Funds. Retrieved January 6, 2016 from http://www.investopedia.com/articles/mutualfund/05/hedgefundhist.asp.
- N.A. (2015, December) Nevsky Fund Quarterly Performance, page 3. Retrieved January 6, 2016 from https://www.scribd.com/fullscreen/294654490?access_key=key-xfqKH8QC2LsXN87EW4uk&allow_share=true&escape=false&show_recommendations=false&view_mode=scroll
|
Workshops
Combo Discounts available for all back-to-back workshops!
See our workshop page for details.
Free Book We're Giving You a FREE Book!
TRADING BEYOND THE MATRIX
The Red Pill for Traders and Investors
We pay for the book, you pay for shipping.
ALL YOU HAVE TO DO IS CLICK HERE!
Below is a brief video on how powerful this book is to traders.

Trading Tip

Did the Market Just Flash a Classic Double Bottom with Divergence?
by D. R. Barton, Jr.
Click here to resolve formatting problems
“Things are not always what they seem; the first appearance deceives many; the intelligence of a few perceives what has been carefully hidden.”
—Plato’s Phaedrus
Many of the long-suffering readers of these articles know that I’m a bit of a numbers guy. My education and early career were in chemical engineering and I was with DuPont for 15 years before I took early retirement to turn my attention full-time to the financial markets.
So it’s with a bit of trepidation and more than a little self-loathing that I’ll admit that in my heart-of-hearts, I don’t believe that we just had a classic and beautiful double bottom in the S&P 500.
First to the chart:
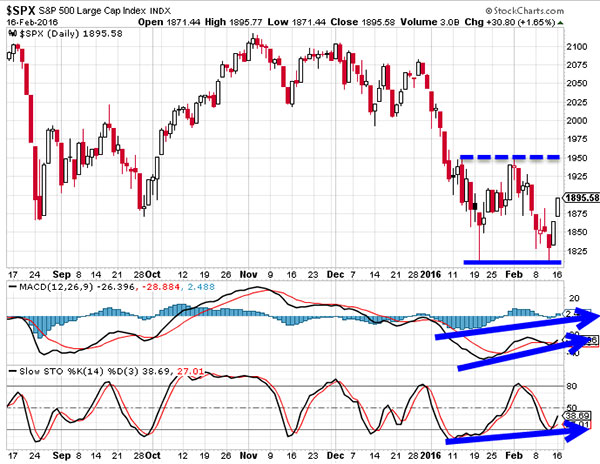
I don’t have to write much on the chart because the double bottom (lows on 1/20, 2/11) and the corresponding divergence can be seen so clearly. While the chart above uses two classic momentum indicators: the MACD, the MACD difference line (the histogram that was Alexander Elder’s favorite divergence tool) and the slow stochastic, we could put any number of momentum indicators on the chart. Every indicator that I’ve seen, however, shows divergence in this double bottom pattern.
A Little Classic Technical Analysis
For decades, I’ve been teaching that the new speed of markets has allowed traders to go long after a strong close within a day or two of the bottom. Unless you’re trading for a pop of a few days instead of a few weeks or months, however, I’d say in this case right now that you would be wise to follow the advice of Edwards and Magee. The authors of the classic book Technical Analysis of Stock Trends rightfully inform us that this set-up is not a true double bottom until price has broken the dotted line above. Traders and investors are best advised to wait for the confirming break of the neckline in the chart above. Here’s why…
A Sea Change in Fundamentals Since Mid-2015
I’ll write an entire article on this topic in the near future but for now, suffice it to say that multiple forces are keeping equities markets down. In addition, there doesn’t appear to be a quick fix.
Let’s summarize the areas of concern:
- Slowing growth in China. While this has been a suspected problem for years, the world’s second largest economy is finally showing tangible signs and (gasp!) government numbers that are reflecting the reality of an economic slowdown. Throw in the little talked about problem with China’s foreign-exchange reserves (an issue that is driving near-term decisions in everything from Yuan devaluations to increased sales of U.S. Treasury holdings) and this is an economy that is going to get worse — many believe much worse — before it gets better. China has been a huge growth engine supporting the economies of many trading partners over past decade, which leads to the next concern…
- The ongoing economic growth and debt servicing problem in emerging market countries. The strength of the US Dollar only exacerbates this problem because the debt is more expensive to repay and…
- The deflationary effects caused by the price drop in oil and commodities. Many emerging market economies depend on raw material sales or intermediate processing so depressed profit margins are severely effecting those economies.
- And finally — central bank interventions are experiencing diminishing returns and/or negative effects. The age of the omnipotence of central banks is winding down. We can see this in the huge change from bad economic news pushing up stock markets (as traders believed this meant more/prolonged QE) to bad economic news pushing markets down. Traders are now going back to judging the health of individual and global economies.
That quick brain dump basically says I don’t expect a longer term recovery in equities like we saw in August of 2015 or in October of 2014. Look instead for a battle between the bears and bulls at these lower levels for a while longer… and — you have to be on guard for violent rips to the upside. The biggest up days in the market happen during down markets … but more data on that next week.
Until then, please let me know your thoughts and opinions on the article. Send your comments to drbarton “at” vantharp.com — I always enjoy hearing from you!
Great Trading,
D. R.
About the Author: A passion for the systematic approach to the markets and lifelong love of teaching and learning have propelled D.R. Barton, Jr. to the top of the investment and trading arena. He is a regularly featured analyst on Fox Business’ Varney & Co. TV show (catch him most Thursdays between 12:30 and 12:45), on Bloomberg Radio Taking Stock and MarketWatch’s Money Life Show. He is also a frequent guest analyst on CNBC’s Closing Bell, WTOP News Radio in Washington, D.C., and has been a guest on China Central Television — America and Canada’s Business News Network. His articles have appeared on SmartMoney.com MarketWatch.com and Financial Advisor magazine. You may contact D.R. at "drbarton" at "vantharp.com".
Swing Trading Systems E-Learning Course
 The new Swing Trading Systems home study course is now available! Learn with Dr. Ken Long as he teaches his Swing Trading Systems Workshop via streaming video! The new Swing Trading Systems home study course is now available! Learn with Dr. Ken Long as he teaches his Swing Trading Systems Workshop via streaming video!
This new e-learning course includes Ken Long's Swing Trading Workshop, 5 swing trading systems and a bonus workshop featuring Van Tharp on Tharp Think principles. The course also includes extensive downloadable files to support your learning.
You can complete this course at your own pace, from the comfort of your own home or office, and access the materials as many times as you wish during your 1 year subscription period.
Take a look at this video from Ken to learn more about this course.

We have extensive information about the Swing Trading System e-learning course, including how to purchase...click the link below!
Learn More About The Swing E-Learning Course...
Matrix Contest
 Enter the Matrix Contest Enter the Matrix Contest
for a chance to win a free workshop!
We want to hear about the one most profound insight that you got from reading Van's new book, Trading Beyond the Matrix, and how it has impacted your life. If you would like to enter, send an email to [email protected].
If you haven't purchased Trading Beyond the Matrix yet, click here.
For more information about the contest, click here.
Ask Van...
Everything we do here at the Van Tharp Institute is focused on helping you improve as a trader and investor. Consequently, we love to get your feedback, both positive and negative!
Send comments or ask Van a question by clicking here.
Also, Click here to take our quick, 6-question survey.
Back to Top
Contact Us
Email us at [email protected]
The Van Tharp Institute does not support spamming in any way, shape or form. This is a subscription based newsletter.
To change your e-mail Address, e-mail us at [email protected].
To stop your subscription, click on the "unsubscribe" link at the bottom left—hand corner of this email.
How are we doing? Give us your feedback! Click here to take our quick survey.
Call us at: 800-385-4486 * 919-466-0043 * Fax 919-466-0408
SQN® and the System Quality Number® are registered trademarks of the Van Tharp Institute and the International Institute of Trading Mastery, Inc.
Be sure to check us out on Facebook and Twitter!
 
Back to Top |
|
February 17, 2016 #772

Our Mission
Van's Top-Twelve Favorite Trading Books
Van's Favorite Non-Trading Books
Viewing on-line eliminates spacing, and formatting problems that you may experience in your email program.
Ongoing Contest: Learn how you could win a $50 coupon and a grand prize of a free workshop!
www.youtube.com/vantharp
How are we doing?
Give us your feedback!
Click here to take our quick survey.
From our reader survey...
"I think the newsletter is
extremely generous and it is a resource I utilize constantly.
I have saved every single one
since I first subscribed."
Trouble viewing this issue?
View Online. »
Van Tharp You Tube Channel
Tharp Concepts Explained...
-
Trading Psychology
-
System Development
-
Risk and R—Multiples
-
Position Sizing
-
Expectancy
-
Business Planning
Learn the concepts...
Trouble viewing this issue?
View Online. »


Check out our home study materials, e-learning courses, and best-selling books.
Click here for products and pricing
What Kind of Trader
Are You? Click below
to take the test.
Tharp Trader Test
Back to Top

Introduction to Position Sizing™ Strategies
E-Learning Course
Perfect for auditory/visual learners who learn more effectively from an instructional format that is full of interactive features!
Only $149
Learn More
Buy Now
SQN® and the System Quality Number® are registered trademarks
of the Van Tharp Institute
|