Tharp's Thoughts Weekly Newsletter
-
Article: A Small-Risk Trading System When the Light Is Green, by Gabriel Grammatidis
-
-
Tip: One Chart and Two Numbers to Help Us Understand Oil’s Impact on Stocks,
by D. R. Barton, Jr.
-
$700 Early Registration
ENDS TODAY!
Forex Trading and Forex Live
February 19-23!

Learn to Trade Three Forex Trading Systems with an Edge
Join us for this three-day workshop, and leave prepared to use three different trading systems in the currency markets (and in other markets too). Professional Forex Trader and Super Trader graduate Gabriel Grammatidis, teaches these systems which have proven profitable in live market trading over the last few years.
Have you ever attended a trading workshop that taught a lot of methodology, and then you found that you had trouble trading the system at home because you had so little experience with it? Gabriel has had that experience, and wants the traders at his workshop to be able to trade the systems when they get back home so he takes a slightly different approach.
Students in his course come away with a solid understanding of the trading process because they practice the setups, entries, and exits in groups with other students in the class. Gabriel makes extensive use of a trading simulator (live history replay) with which actual trades are traded in class as if “live.” So, you leave the workshop already having a good idea on how to trade the systems.
After a thorough review of each system, he slowly walks you through a number of trades on each system that has multiple time frame charts—basically the same screen setup that Gabriel uses to identify setups, entries and exits. All of these trades use recorded historical data run on a software system that reproduces the price charts from the date and time in the live market. You will be able to watch the setups happen as he explains how to get ready for and make the entry, and then how to get ready for and make the exit. After walking the class through several simulations, Gabriel involves the students in the decision process for pattern detection, entry and exits as the acquire competence.
When you get home, you’ll already have a good sense of trading each system—which means you’ll have a running start. And just to be sure, Gabriel provides everyone with pages of additional example trades to take home and study.
Plus, you also have the option to continue with your training in two days of live Forex trading so you can trade the systems live!
Learn more...
Feature Article
A Small-Risk Trading System When the Light Is Green
by Gabriel Grammatidis
Click here to resolve formatting problems
In the first two articles of this series (Busted Breakout Profit by Hunting for Other Peoples’ Stops! and A Trading System For the Crowd that Needs to be Right Sometimes), I described how I have used my beliefs about the markets and about market participant behavior to design my System 1 and System 2 trading systems. Whereas those two systems are based on multi-candle pattern recognition setups, my 3rd System, 3-Timeframes-Moving-Averages (called 3TMA for short) is quite different. System 3 has a more technical approach rather than the more visual approach of S1 and S2. As you can scan a wide universe of potential trades, this system gives you the most opportunity and flexibility in trading different time-frames concurrently.
System 1 and System 2 are fascinating through their unique set of beliefs, market edges and the “psychological footprints” that can be seen on the chart. Still, S3 is the one that the majority of my workshop attendees are actually attracted to the most. For many, this is the first system they start trading after the workshop. I guess the main reason is that once you have found a very strong and smooth trend fulfilling the setup criteria, this system is the easiest one to trade. You have a lot of trading opportunities and it can make good money in a very short time. It requires, however, the most discretion of the three systems to pinpoint the exact entry into the trade. Underestimating this requirement of the system can lead to some initial frustration before achieving consistent profitability.
General Description
The main idea behind System 3 is that a very strong and smooth trend reduces your probability of making a mistake trading in the trend direction. This is where the most consistent money is made. Why is this so? Well, once you jump into a flowing river, where you jump in does not really matter much — the current will bring you along in its direction anyway. In this system, you should also be prepared to enter several times by scaling-in — in a cautious and controlled manner. Here the main goal is to take every entry signal presented to you with a focus on minimizing your risks. At the workshop, we talk about several different ways to enter into these type of trends.
The basis of the rule-set is a multi-timeframe filtering technique that detects strong and smooth trends (that are not yet overdone). The trends are selected by comparing several criteria in three time-frames simultaneously. Whereas the trade is taken in the mid-frame, the high-frame and the low-frame are important as well. Once the filtering technique gives you a “green light modus”, you are allowed to stalk entries. If you prefer programming over visual inspection, you can put together an opportunity detection system (based on the ruleset given) that spots potential trades for you. My detection system scans a wide universe of asset classes and charts, from 1min to 240min, and I usually get multiple trade opportunities every day.
The system works equally well for any FX pair, other liquid instruments and asset classes. It can be traded in any time-frame going both long or short. Actually, you can trade this system easily on a very short time-frame once volatility is going well. The system offers a set of clear rules with a precise entry level and initial stop to control your risk.
Main Beliefs
The main belief is that you should trade a strong and smooth trend in trend direction until the trend is over. To be able to trade this system, it should be well ingrained in your belief-set that trends continue much longer than you might ever expect.
You might wonder — this seems really easy — isn’t the trading crowd attracted to these same trends as well? Yes they are, however, trading with the trend can be a scary thing as often (seemingly always scary to some) the trend looks overdone. As a result, the market keeps drawing in countertrend traders who try to short what they see as tops. Remember this trend really looks like it has gone much too far to many people. If you enter when they have to exit with a loss, the crowd will actually help drive the market in your direction.
It is the unfortunate logic of the market that in a strong trend you actually do not have clear entry signals. This makes traders question their entry signals a lot, not take them. Then they experience losing opportunities as the trend continues. This can be a very painful experience which compels novices, at some point, to chase the market and enter. In many situations, this is the point where you should have already exited (based on the rules) with a likely profit.
Low-risk idea behind the system
Once a sufficiently-established strong and smooth trend has been identified, the biggest edge remains in detecting as many low-risk ideas as possible. You can easily get sucked into overtrading, however, and that could possibly lead you to take high-risk trades. An immediate stop-out will trigger fear of entering again and you might then be trapped in the pain of experiencing a losing trade. You should definitely not trade in such a state. Better wait for low-risk ideas that are fun to watch how they develop. In the workshop, a number of different low-risk entry ideas will be taught that allow you to enter with a tight stop. When things go well, you should actually scale in by adding additional size to build a position, allowing you to benefit from the trend as much as possible. The system rules will tell you once the trend is overdone and it is better left alone.
I use this system regularly during times of good trends or increased volatility (such as during major news events). One of those days happened on October 15th, 2014 when there was “panic in the streets” due to a major news announcement. This also happened to be one of the days of a Live Trading workshop (that followed right after the Forex Trading Systems workshop). That day had ideal market conditions for this system. Actually, the two days of that Live Trading workshop generated a total of 19 trades, +22R, and a win rate of just less than 90% (see many of the details in my previous article Rich Man’s Panic). Although this type of market condition does not happen every day, it is also not that unusual.
___
Do the kinds of trades generated by system 1, 2 and 3 sound fun to you? The reasoning, beliefs and trade ideas of the three systems are quite different from each other, and still, they are all fun in their individual way. If you know the beliefs, market edges and low-risk ideas that form the basis for every good system, you will approach the markets in a much more relaxed and easy-going way. As you fully understand “your trading game” and know how the markets are functioning, you greatly increase your probability of success. Most of all, you will have “fun” trading — independent of winning or losing. If you do not enjoy yourself trading, then you are probably not trading the right systems – ones that fit you.
Good trading,
Gabriel Grammatidis
About the Author: Gabriel Grammatidis is a successful full-time trader and graduate of the Super Trader program. He has extensive experience trading Forex and shares his knowledge at his Forex and Live Forex Trading workshops, held regularly at VTI.
Learn more about the flexibility that Forex offers you by watching a video segment from the workshop (What is the reality of Forex trading?).
You can see some practical example videos of the system trades on Gabriel’s website,IntuFX.com.
For more information on how to develop a system based on a set of beliefs see my last article in the Traders´ magazine (How to develop your trading system).
Gabriel can be reached at gabriel "at" vantharp.com.
|
Workshops
Combo Discounts available for all back-to-back workshops!
See our workshop page for details.
Free Book We're Giving You a FREE Book!
TRADING BEYOND THE MATRIX
The Red Pill for Traders and Investors
We pay for the book, you pay for shipping.
ALL YOU HAVE TO DO IS CLICK HERE!
Below is a brief video on how powerful this book is to traders.

Trading Tip

One Chart and Two Numbers
to Help Us Understand Oil’s Impact on Stocks
by D. R. Barton, Jr.
Click here to resolve formatting problems
It’s hard for traders and investors to keep their eyes off of oil prices. Indeed, the correlation between oil and stocks has been much discussed, and active traders know that stocks have followed oil price action for some time now.
With all this talk about the correlation between these two traditionally mildly correlated assets, is there any real proof that their correlation has, in fact, increased? Let’s go to the charts to find out! Below, you’ll see a chart that shows the price of crude oil on the top chart, the S&P 500 price in the middle chart, and the correlation coefficient of the two in the bottom chart:
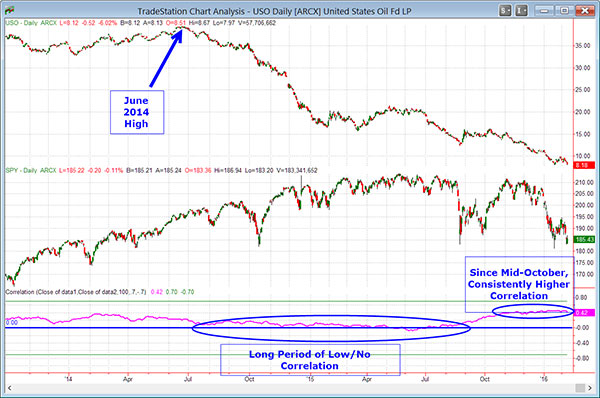
First, here’s a quick correlation refresher. If the correlation coefficient is 1.0, the two instruments are perfectly correlated (move in the same direction all the time). A correlation coefficient of 0 means they have no correlation and a -1.0 figure means they are inversely correlated or move in opposite directions.
The chart above definitely shows that the correlation between the price of oil and the S&P 500 has grown substantially since last summer. In fact, from July of 2014 until August of 2015, stocks and oil had practically no correlation. Since then, we can clearly see that the movements of the two assets are much more closely related.
And if the way oil prices are leading stocks these days is not enough to catch our attention, let’s look at two numbers that may show us why this is happening.
Two Numbers that Show the Big Effect Energy Stock Earnings Have on the Broader Market
We’ve already seen year-over-year (YoY) declines in earnings for the second and third quarters of 2015. Fourth quarter earnings seem to show more of the same. With 63% of companies reporting through Friday (2/5/16), earnings report stalwart Factset shows a near certainty that we’ll get another YoY decline for the fourth quarter of 2016. This will mark the first time of three straight quarterly declines since the first three quarters of 2009.
Factset provides an earnings number they call blended results. This number allows full-quarter equivalents to be tracked throughout the reporting period. It combines the actual results so far with analysts’ projections for companies that have not yet reported. For 4Q, 2015, Factset’s blended result is a decline of -3.8%. That’s a pretty big negative number.
But here’s the real kicker: when we exclude the Energy sector, the blended earnings decline for the S&P 500 disappears — all non-energy sector stocks show a positive 2.2% YoY gain. That’s a huge change from an overall -3.8% number!
I would propose that pundits looking for reasons why stock index prices have tracked so closely with oil prices over the past few months — look no further than the impact dropping oil prices are having on energy sector earnings! Then we can see how tough it is to have a positive earnings quarter when the energy sector is getting slammed. So when oil prices slide, the stock market sees it immediately as bad news, and vice versa.
Morgan Stanley and the International Energy Agency both put out sustained low-price forecasts for the first half of 2016 (Morgan Stanley actually lowered their first half target price 50%!). With those types of projections, it’s easy to envision many more months where the price of stocks is closely tied to the price of crude.
Your thoughts and comments are always welcome — please send them to drbarton “at” vantharp.com
Great Trading,
D. R.
About the Author: A passion for the systematic approach to the markets and lifelong love of teaching and learning have propelled D.R. Barton, Jr. to the top of the investment and trading arena. He is a regularly featured analyst on Fox Business’ Varney & Co. TV show (catch him most Thursdays between 12:30 and 12:45), on Bloomberg Radio Taking Stock and MarketWatch’s Money Life Show. He is also a frequent guest analyst on CNBC’s Closing Bell, WTOP News Radio in Washington, D.C., and has been a guest on China Central Television — America and Canada’s Business News Network. His articles have appeared on SmartMoney.com MarketWatch.com and Financial Advisor magazine. You may contact D.R. at "drbarton" at "vantharp.com".
Swing Trading Systems E-Learning Course
 The new Swing Trading Systems home study course is now available! Learn with Dr. Ken Long as he teaches his Swing Trading Systems Workshop via streaming video! The new Swing Trading Systems home study course is now available! Learn with Dr. Ken Long as he teaches his Swing Trading Systems Workshop via streaming video!
This new e-learning course includes Ken Long's Swing Trading Workshop, 5 swing trading systems and a bonus workshop featuring Van Tharp on Tharp Think principles. The course also includes extensive downloadable files to support your learning.
You can complete this course at your own pace, from the comfort of your own home or office, and access the materials as many times as you wish during your 1 year subscription period.
Take a look at this video from Ken to learn more about this course.

We have extensive information about the Swing Trading System e-learning course, including how to purchase...click the link below!
Learn More About The Swing E-Learning Course...
Matrix Contest
 Enter the Matrix Contest Enter the Matrix Contest
for a chance to win a free workshop!
We want to hear about the one most profound insight that you got from reading Van's new book, Trading Beyond the Matrix, and how it has impacted your life. If you would like to enter, send an email to [email protected].
If you haven't purchased Trading Beyond the Matrix yet, click here.
For more information about the contest, click here.
Ask Van...
Everything we do here at the Van Tharp Institute is focused on helping you improve as a trader and investor. Consequently, we love to get your feedback, both positive and negative!
Send comments or ask Van a question by clicking here.
Also, Click here to take our quick, 6-question survey.
Back to Top
Contact Us
Email us at [email protected]
The Van Tharp Institute does not support spamming in any way, shape or form. This is a subscription based newsletter.
To change your e-mail Address, e-mail us at [email protected].
To stop your subscription, click on the "unsubscribe" link at the bottom left—hand corner of this email.
How are we doing? Give us your feedback! Click here to take our quick survey.
Call us at: 800-385-4486 * 919-466-0043 * Fax 919-466-0408
SQN® and the System Quality Number® are registered trademarks of the Van Tharp Institute and the International Institute of Trading Mastery, Inc.
Be sure to check us out on Facebook and Twitter!
 
Back to Top |
|
February 10, 2016 #771

Our Mission
Van's Top-Twelve Favorite Trading Books
Van's Favorite Non-Trading Books
Viewing on-line eliminates spacing, and formatting problems that you may experience in your email program.
Ongoing Contest: Learn how you could win a $50 coupon and a grand prize of a free workshop!
www.youtube.com/vantharp
How are we doing?
Give us your feedback!
Click here to take our quick survey.
From our reader survey...
"I think the newsletter is
extremely generous and it is a resource I utilize constantly.
I have saved every single one
since I first subscribed."
Trouble viewing this issue?
View Online. »
Van Tharp You Tube Channel
Tharp Concepts Explained...
-
Trading Psychology
-
System Development
-
Risk and R—Multiples
-
Position Sizing
-
Expectancy
-
Business Planning
Learn the concepts...
Trouble viewing this issue?
View Online. »


Check out our home study materials, e-learning courses, and best-selling books.
Click here for products and pricing
What Kind of Trader
Are You? Click below
to take the test.
Tharp Trader Test
Back to Top

Introduction to Position Sizing™ Strategies
E-Learning Course
Perfect for auditory/visual learners who learn more effectively from an instructional format that is full of interactive features!
Only $149
Learn More
Buy Now
SQN® and the System Quality Number® are registered trademarks
of the Van Tharp Institute
|
