Tharp's Thoughts Weekly Newsletter
-
Article: Computer Games by Ivan Obolensky
-
Workshops: $500 Discount When Attending Back-to-Back in Nov
-
-
Tip: The Halloween Indicator — One That Just Keeps Working 2 by D. R. Barton, Jr.
-
Market got you down?
Get your trading back on track with these
3 trading workshops this November!
Day Trading, Live Day Trading,
and Trading in a Bear Market and Down Markets
$700 EARLY ENROLLMENT DISCOUNT ENDS NEXT WEEK!
Day Trading and Live Day Trading with Instructor Ken Long
Learn two complimentary trading systems (and trade them on a simulator in class!) that are great performers in volatile market conditions like we are experiencing right now!
In this three day workshop, Dr. Ken Long lectures on the first day about his general approach to intraday trading and about two specific day trading systems — the Frog and RLCO. You will learn the "why" behind each system and the rules for each. Over the next two days, you put your knowledge to work learning these trading systems the best way possible — actually trading them. Ken will review a series of case studies with you and then you make trades in a simulator — using historical price data. You’ll get plenty of practice so that before you get back home, you have already made numerous trades.
After three action-packed days of instruction and hands-on trading, you can opt to stay an additional two days and trade these systems live! See how these systems trade in real-time in the live markets with a successful, experienced coach in the room guiding you the entire way.
In the Workshops Section below, watch Ken’s latest video which highlights
recent day trades taken by Ken and other traders in his chat room.
Trading in a Bear Market and Down Markets with Instructor Mark McDowell
Learn how to identify, prepare for, trade during, and profit from the next big bear market—or from any smaller market that’s heading down.
This workshop helps you learn how to think about trading broad bear markets and trading an asset class, sector or even one symbol that is moving down in bear mode. For a major bear market, think equities in 2008-2009. For a down move, think oil in 2014-2015. Imagine having had some ways you could have effectively traded those periods. Major bear markets don’t come that often but “lesser” down moves can be found almost anytime – including during bull markets. Start using the information from this workshop when you return back home — and also be prepared for the next big bear market.
| • |
|
Study in depth the concept of a bear market. |
| • |
|
Learn what a bear market truly is and learn several ways to define and measure the bear market type. |
| • |
|
Know when a bear market type might be starting and how to know when it might end. |
| • |
|
Learn 5 trading strategies suited for bear market conditions. |
| • |
|
Learn how options can be especially useful for bear market types. |
To register or to see the full workshop schedule, click here.
Feature Article
Computer Games
by Ivan Obolensky
Click here to resolve formatting problems
Not many understand what High-Frequency Trading (HFT) is, and how it evolved, simply because it has grown quietly behind the scenes out of the public eye. That is, at least until several computer glitches and flash-crashes put it in the public spotlight.
High-Frequency Trades are initiated by computer programs that operate at speeds of a millionth of a second. With over half the trades on most stock exchanges being generated in this way, understanding the impact of this type of trading is important because it affects us all directly or indirectly, one way or another.1
The first thing to know is that High-Frequency Trading is big business.
For example, Virtu Financial, a High-Frequency Trading group, in its 2014 Initial Public Offering, noted that during the five-year period since 2009 it showed trading profits on 1,277 out of the 1,278 days it traded. The group lost money on only one day in a five-year period and reported revenues of almost 500 million dollars for the first half of 2015. This is an impressive performance.2
HFTs, like Virtu, have become huge players in markets all over the world. HFTs accounted for 60-70% of the New York Stock Exchange volume in 2009.
To understand what High-Frequency Trading is, how it works, and why HFTs can generate such huge profits, it is necessary to review some history of the U.S. stock market and get some context.
Originally stock markets were conducted at physical locations by members of an exchange, such as at the New York Stock Exchange (NYSE). There, specialists would handle incoming trade orders for specific stocks. For instance, there was a specialist who handled only the buy and sell orders for IBM shares. Their purpose was to ensure an orderly market. If everyone was selling, the specialist was required to buy. If everyone was buying, he had to sell to them. He became known as a market-maker. The specialist made sure there was a market regardless of whether the price was going up or down. Specialists had to make money during normal market periods to compensate for occasional adverse market moves. This was done by creating a ‘spread’. As an example, suppose a stock last traded at $10.00. The specialist would offer 100 shares for sale at $10.25 and be willing to buy 100 shares at $9.75. The spread (50 cents) was the difference between the two prices. By offsetting buy and sell orders as they came in, the specialist would pocket the 50 cents. If he bought and sold 100,000 shares that day, the specialist would make around $50,000.
Besides the spread (the difference in the buy price and the sell price), specialists had other advantages. The first was being on the floor itself and being able to observe the ebb and flow of market prices. Second, specialists maintained a book of all existing orders above and below the current market price of a stock. If he knew that there were massive orders to buy above the current price, the specialist could accumulate shares in his own account in order to sell them at a profit when the price moved in that direction. The specialist had inside knowledge of future order flow by monitoring his book. Lastly, specialists controlled the size of the spread, that is whether the difference between the buy and sell price was 25 cents, or a dollar. The width he set was based on his perception of the amount of risk in the market at any given time.3
The above description was the typical functioning of markets before the 1970s and the dawn of the computer age. Many outside of this privileged network felt that the entire system was a monopoly hiding in plain view and were determined to force the exchanges to become open to all. Over time they were successful.
Several things happened to change the existing system.
The first was that the demand for stocks and other financial instruments (such as options on individual stocks) increased as the 70s turned into the 80s, and the US economy expanded. The NYSE handled only the shares of large corporations. Everything else was traded either on the American Stock Exchange, or through a system called the National Association of Security Dealers which operated over the telephone. (These exchanges merged and eventually formed NASDAQ.) The number of market-makers and broker-dealers (broker-dealers are those who trade shares on behalf of the public) multiplied as demand for financial products grew.
Eventually, the transaction volume increased to such an extent that some sort of automation became necessary. Computers started to be used to record orders and display transactions in real time. As computer usage became more mainstream and user-friendly, traders began to notice that there were price differences between the options market, the stock market and the futures markets where there shouldn’t be any. These could be taken advantage of, provided an order was put in fast enough to sell one and buy the other. Computers were programmed to automate many of the orders so as to profit from these price discrepancies. This was the start of computerized trading, or what became known as program trading. It was not yet fully automated.
The stock market crash in 1987 was blamed on program trading. In addition, many investors were left high and dry because they couldn’t reach their broker to place an order, let alone execute a trade even if they did so. The volume at the time of the crash was so huge, many of the fledgling electronic systems and manual order systems broke down. With much regulatory scrutiny, markets were retooled and an electronic order entry system became a requirement to ensure transactions could take place regardless of the volume. All market-makers and broker-dealers were connected to the system.
With so much data now available, and with so many market-makers having to show the prices they were offering to buy, or sell on the shares they traded, there were often price differences from one dealer to another for the exact same stock. Once again, electronic traders began to take advantage of these disparities and with better computers overall, found “free” money readily available.
Investors also returned to the markets eventually after the 1987 crash. Trading volume picked up and there was more activity than ever, particularly with mutual funds. Institutions such as Fidelity, pension fund managers, and other large asset managers became the big players.
With the rise of mutual funds came much larger order sizes — buy and sell orders for millions of shares in large blocks. These institutions and the managers who transacted this large order flow did not want to pay high commissions set by broker-dealers or the wide spreads set by specialists and market-makers, nor did they want other traders to discover they were taking a large position in say, Microsoft, and have others profit from the inevitable move higher that occurred from all their buying. Institutions needed a place to trade off the exchanges and away from public view. Computing power had by this time increased to a point that it was possible to create Electronic Communication Networks, or ECNs. ECNs were strictly electronic and matched buyers and sellers. They did away with the middleman, the market-maker as well as the broker-dealer that charged them high commissions.
This was the start of what is called “Dark Pools”. A pool is really just a market. A “Lit Pool” is where all trades and quotes are open to view. A “Dark Pool” is where transactions take place with no public viewing. Prices were posted on exchanges, but only after the fact, and sometimes at better prices than a public investor could possibly receive. The first of these exchanges was Instinet, followed by Island. Both of these ECNs began to transact business without a middleman, reducing costs for institutional traders.
Many considered this unfair practice and clamored for an investigation by regulators.
As a result, in 1996, the NASDAQ was accused of price fixing. Regulators felt that to ensure investors received fair prices, broker-dealers must post all competing quotes (offers to buy or sell) and choose the one that gave the customer the best price. This required a great deal more computerization to ensure that these quotes could be made available to all who bought and sold for the public. Additionally the ECNs, which were the exclusive province of institutional traders, had to make their quotes visible as well. No more Dark Pools.
This was a game changer — institutions could no longer hide their order flow.
Further, by demanding the interconnection of all the sources of quotes in a common computer language, regulators made truly electronic trading possible. The purpose of the rule-making was to give the consumer better pricing and of course, that worked. The new rules also had another consequence: electronic platforms became mandatory. This benefitted established Electronic Communication Networks (ECNs) but those who ran the ECNs had a big problem: how to make money from all these trades if there was no market-maker, no middleman, no spread?The answer was to make a mini-spread for every transaction that occurred. The thinking went this way:
If a market-maker put up a quote to buy or sell, it was providing liquidity to the system (more opportunity for a transaction to occur when it was needed). This was good because it allowed someone to trade. The liquidity-maker should be compensated for this. On the other hand, if someone purchased or sold a stock, the buyer/seller was taking away liquidity because the quote disappeared when it was filled and denied those that wanted to transact an opportunity. Liquidity was reduced. This was bad. They should have to pay for taking liquidity away.
Those who ran the ECNs decided to charge liquidity-takers 0.003 cents to accept an offer to buy or sell and rebate the liquidity-maker who made the offer 0.0028 cents for each share traded. (The ECN pocketed the 0.0002 difference.) Although the fee was small, it validated those who put up quotes (offers to buy or sell) and penalized those who accepted them. It also set the stage for what was to come. The solution for those who owned and ran the ECNs, the exchanges that eventually merged with them, and the traders that profited from using them, was simple: create more volume. They did not have to wait long. The rise of the frenzied trading of the dot-com stocks took care of that.
In part 2 of this article we will discuss two events by 2000 that greatly influenced the market’s infrastructure and functioning to this day.
Copyright © 2015 Ivan Obolensky http://www.dynamicdoingness.com
Ivan recently joined Dr. Tharp's Super Trader Program and we look forward to publishing more of his insightful articles.
| |
1. |
Patterson, S. (2012) Dark Pools, the Rise of the Machine Traders and the Rigging of the U.S. Stock Market. New York, N.Y.: Crown Business |
| |
2. |
A. (2015). Virtu Financial, Inc. Form 10-Q Quarterly Report. Retrieved September 11, 2015 from files.shareholder.com/downloads/AMDA-2PR09O/687627359x0xS1104659-15-60023/1592386/filing.pdf |
| |
3. |
Harris, L. (2003). Trading and Exchanges: Market Microstructure for Practitioners. New York, N.Y.: Oxford University Press, USA. |
Workshops
Combo Discounts available for all back-to-back workshops!
See our workshop page for details.
Free Book We're Giving You a FREE Book!
TRADING BEYOND THE MATRIX
The Red Pill for Traders and Investors
We pay for the book, you pay for shipping.
ALL YOU HAVE TO DO IS CLICK HERE!
Below is a brief video on how powerful this book is to traders.

Trading Tip

The Halloween Indicator —
One That Just Keeps Working Part 2
by D. R. Barton, Jr.
Click here to resolve formatting problems
Last week, I felt compelled to rant about something I don’t like much at all — pumpkin flavored everything, and to rave about something I do like a whole bunch — the Halloween Indicator. We continue with both themes this week.
First, let’s get back to that pumpkin flavored stuff and then we’ll dig into some new research on the Halloween indicator.
If you’re new to this rant, you need to go back and read last week’s column that can be found here. A few of you were kind enough to send in your pumpkin flavored abominations (I might add it was only a very few - come on people, our national security could be compromised by this pumpkin flavored craze!) I learned of Jet-Puffed pumpkin flavored marshmallows, pumpkin scented hand lotion, pumpkin Pringles (yuk) and yes, there’s even a pumpkin flavored vodka (thanks Dave W!).
And that brings me to this week’s related pet peeve: we are not talking about the flavor of pumpkin. Let’s face it, nobody wants anything pumpkin flavored. The only people who eat unseasoned gourds and squash are livestock and vegans. What people buy in the billions of dollars every year about this time is pumpkin PIE flavored items.
My mom made a great pumpkin pie. So did both of my grandmas and my wife makes a killer-tasty, homemade crust pumpkin pie several times a year. I love pumpkin pie — but I don’t want that flavor in my beer or my M&Ms or anything else. Feel free to disagree…
Now let’s get to a fall tradition that is useful — the Halloween Indicator…
The Halloween Indicator: It Just Keeps Working
Last week we looked at an academic paper by Bouman and Jacobsen that examined quite of bit of data and found statistically significant support for the Halloween effect. Today, let’s consider two more pieces of research to complete the picture.
First up, Hirsch and Hirsch report in The Stock Trader’s Almanac that since 1950, the “Best Six Months” (November through April) period has been up 78% of the time. Even more impressive, according to Hirsch and Hirsch, the average gain for “Best Six Months” over that period has been 7.6% in the Dow Industrials while the “Worst Six Months” have posted an average gain of only 0.3%.
Saving The Best for Last
Just in October of 2014, Jacobsen and Zhang expanded Jacobsen’s original work from 2001 and published an impressive and far-reaching academic paper. With updated and broader data, they found that the “Best Six Months” had statistically significant outperformance in 108 out of 109 active stock markets in the world! (The lone exception? An island country in the middle of the Indian Ocean called Mauritius.)
Here’s their summary chart that shows the vast outperformance for the “Best Six Months” vs. buy and hold:
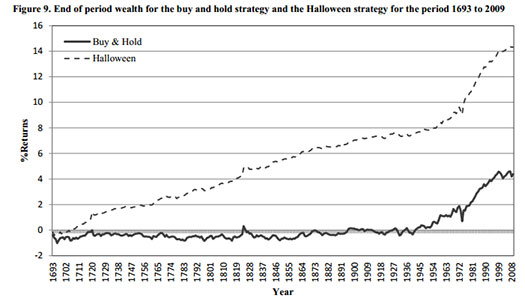
That is a stunning outperformance! Not only is the historical performance jaw dropping but the authors also show the outperformance of the six best vs six worst months has grown stronger over the last few decades. The graph below shows the size of the Halloween effect (difference between 6-month returns November-April and May-October) for 31 ten-year periods from the 109 pooled countries between 1693 and 2011:
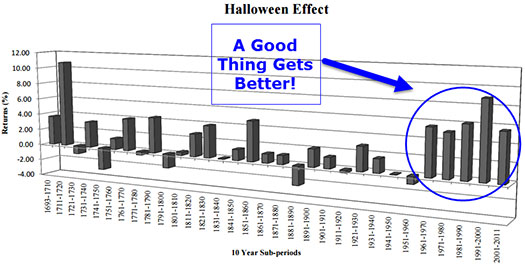
I’ve researched seasonal tendencies like the January Effect (the penchant for small cap stocks to outperform large cap stocks in January) and many others. All of them have shown dwindling effectiveness as more people find out about them and try to exploit them earlier, etc. But that’s just not the case for the Halloween Effect! Like a fine wine, it seems to be getting better with age.
One final note — some folks wrote in and observed that the Six Best Months has worked over the past few years but that the May through October period has been strong recently also. Actually, despite one of the strongest and longest bull markets of this century between March of 2009 and August 2015, the Six Worst Months vastly underperformed in 2010, 2011 and 2012 and 2015 (4 out of 6 in this strong bull market — dang this thing’s good!).
Next week we’ll dig into more detail from a charting perspective to see just how powerful this indicator is
I always love hearing your thoughts and comments (and this week the most outrageous pumpkin-flavored something you’ve seen). Send them all to drbarton “@” vantharp.com.
Great Trading,
D. R.
About the Author: A passion for the systematic approach to the markets and lifelong love of teaching and learning have propelled D.R. Barton, Jr. to the top of the investment and trading arena. He is a regularly featured analyst on Fox Business’ Varney & Co. TV show (catch him most Thursdays between 12:30 and 12:45), on Bloomberg Radio Taking Stock and MarketWatch’s Money Life Show. He is also a frequent guest analyst on CNBC’s Closing Bell, WTOP News Radio in Washington, D.C., and has been a guest on China Central Television — America and Canada’s Business News Network. His articles have appeared on SmartMoney.com MarketWatch.com and Financial Advisor magazine. You may contact D.R. at "drbarton" at "vantharp.com".
NEW! Swing Trading Systems E-Learning Course
 We are excited to announce that our new Swing Trading Systems home study course is now available! Learn with Dr. Ken Long as he teaches his Swing Trading Systems Workshop via streaming video! We are excited to announce that our new Swing Trading Systems home study course is now available! Learn with Dr. Ken Long as he teaches his Swing Trading Systems Workshop via streaming video!
This new e-learning course includes Ken Long's Swing Trading Workshop, 5 swing trading systems and a bonus workshop featuring Van Tharp on Tharp Think principles. The course also includes extensive downloadable files to support your learning.
You can complete this course at your own pace, from the comfort of your own home or office, and access the materials as many times as you wish during your 1 year subscription period.
Take a look at this video from Ken to learn more about this course.

We have extensive information about the Swing Trading System e-learning course, including how to purchase...click the link below!
Learn More About This Swing Workshop....
In this six minute video, Ken analyzes several trades from the relatively quiet session on Monday, October 12. He opens with a swing trade that started last week on XIV talking about the entry, initial stop, target, and progress of the trade so far. That swing trade offers the opportunity trade XIV intraday with some confidence in the long bias. Ken provides two tradeable intraday scenarios for the XIV move during the Monday session and the position sizing ramifications for each. Ken then discusses a second trade where one of the traders in the chat room went short USO and earned a couple of R for the effort. 
Matrix Contest
 Enter the Matrix Contest Enter the Matrix Contest
for a chance to win a free workshop!
We want to hear about the one most profound insight that you got from reading Van's new book, Trading Beyond the Matrix, and how it has impacted your life. If you would like to enter, send an email to [email protected].
If you haven't purchased Trading Beyond the Matrix yet, click here.
For more information about the contest, click here.
Ask Van...
Everything we do here at the Van Tharp Institute is focused on helping you improve as a trader and investor. Consequently, we love to get your feedback, both positive and negative!
Send comments or ask Van a question by clicking here.
Also, Click here to take our quick, 6-question survey.
Back to Top
Contact Us
Email us at [email protected]
The Van Tharp Institute does not support spamming in any way, shape or form. This is a subscription based newsletter.
To change your e-mail Address, e-mail us at [email protected].
To stop your subscription, click on the "unsubscribe" link at the bottom left—hand corner of this email.
How are we doing? Give us your feedback! Click here to take our quick survey.
Call us at: 800-385-4486 * 919-466-0043 * Fax 919-466-0408
SQN® and the System Quality Number® are registered trademarks of the Van Tharp Institute and the International Institute of Trading Mastery, Inc.
Be sure to check us out on Facebook and Twitter!
 
Back to Top |
|
October 21, 2015 #756

Our Mission
Van's Top-Twelve Favorite Trading Books
Van's Favorite Non-Trading Books
Viewing on-line eliminates spacing, and formatting problems that you may experience in your email program.
Ongoing Contest: Learn how you could win a $50 coupon and a grand prize of a free workshop!
www.youtube.com/vantharp
How are we doing?
Give us your feedback!
Click here to take our quick survey.
From our reader survey...
"I think the newsletter is
extremely generous and it is a resource I utilize constantly.
I have saved every single one
since I first subscribed."
Trouble viewing this issue?
View Online. »
Van Tharp You Tube Channel
Tharp Concepts Explained...
-
Trading Psychology
-
System Development
-
Risk and R—Multiples
-
Position Sizing
-
Expectancy
-
Business Planning
Learn the concepts...
Trouble viewing this issue?
View Online. »


Check out our home study materials, e-learning courses, and best-selling books.
Click here for products and pricing
What Kind of Trader
Are You? Click below
to take the test.
Tharp Trader Test
Back to Top

Introduction to Position Sizing™ Strategies
E-Learning Course
Perfect for auditory/visual learners who learn more effectively from an instructional format that is full of interactive features!
Only $149
Learn More
Buy Now
SQN® and the System Quality Number® are registered trademarks
of the Van Tharp Institute
|