Tharp's Thoughts Weekly Newsletter
-
Article: Market Type is Bear Volatile by Van K. Tharp, Ph.D.
-
Workshops: Early Registration Discount Ends Today For Forex!
-
Tip: August 2015 SQN ® Report by Van K. Tharp, Ph.D.
-
$700 Discount Expires TODAY!
FOREX and FOREX LIVE TRADING workshops
with Gabriel Grammatidis
Last Day to Get the Best Price for the September 11-13 Course!
If the volatility in the equity markets in the last two weeks has you concerned about your abilities to trade profitably and you’d like plenty of trading opportunities that fit your schedule, it may be time to get serious about learning to trade Forex.
The best trading opportunities at the moment are in currencies. With Forex, you can trade, invest or hedge. You can hold trending positions for months, scalp small pip intraday moves, and trade everything else in-between. This level of flexibility is matched with excellent market conditions.
One example — during all of the huge volatility in the equity markets over the last week, the very liquid EURUSD moved up 6% from 1.1000 to 1.1700. It made this move in a nice, consistent and steady way as you can see in the 60 min chart below.
Three of my systems (taught in the workshop) have identified multiple trades in multiple pairs. Here are a few examples from just one pair, the EURUSD:
| |
• |
The excellent Forex trading environment presented us with multiple long opportunities EURUSD on the 15min time-frame. |
| |
• |
Once the Busted pattern (System 1) had triggered, a good number of System 3 opportunities (3TMA) also followed along the way up for EURUSD (see individual opportunities with a blue arrow and a rectangle indicating entry and stop levels). |
| |
• |
For this follow up, I can only point out examples from one pair but the systems have found numerous additional opportunities in other pairs as well. |
Join us in Berlin, Germany for our next Forex Trading Systems Workshop and walk out the door with three individual forex trading systems! We typically hold workshops in Europe just once each year, and Berlin has proven to be a great central location for many of our European clients to attend. Register soon while you still qualify for the $700 early enrollment discount. After you have learned these systems in the first workshop, you may also consider staying for two additional days, September 14-15, to trade the systems LIVE with Gabriel.
If you missed it Monday, see full message on recent volatility, including a chart, by clicking here.
In this 2 minute video we present a quick look into the
Forex Workshop.

LEARN MORE about FOREX and FOREX LIVE
If you would like to learn more about FOREX trading, but you're unable to attend in Germany, Gabriel will also teach these systems in Cary, NC in February, 2016!
Feature Article
August 2015 Market Update:
Market Type is Bear Volatile
by Van K. Tharp, Ph.D.
Click here to resolve formatting problems
I always say that people do not trade the markets; they trade their beliefs about the markets. In that same way, I'd like to point out that these updates reflect my beliefs. If my beliefs and your beliefs are not the same, you may not find them useful. I find the market update information useful for my trading, so I do the work each month and am happy to share that information with my readers.
However, if your beliefs are not similar to mine, then this information may not be useful to you. Thus, if you are inclined to do some sort of intellectual exercise to prove one of my beliefs wrong, simply remember that everyone can usually find lots of evidence to support their beliefs and refute others. Just simply know that I admit that these are my beliefs and that your beliefs might be different.
These monthly updates are in the first issue of Tharp's Thoughts each month. This allows us to get the closing month's data. These updates cover 1) the market type (first mentioned in the April 30, 2008 edition of Tharp's Thoughts), 2) the five week status on each of the major US stock market indices, 3) our four star inflation-deflation model plus John Williams' statistics, and 4) tracking the dollar. I will now report on the strongest and weakest areas of the overall market as a separate SQN™ Report. And that may come out twice a month if there are significant market charges.
Part I: The Big Picture
US equities have gone down 5.7% from where they were 100 days ago. Last month, they had gone up 2.92% in the previous 100 days. In the last 100 days now, there have been five new all-time high closes, the last one being 71 days ago. The S&P 500 made no new high closes in June or July or August. This market is no longer very deceptive; it is quite clearly a bear market now.
Debt Clock
The State of the United States |
Month Ending |
National Debt |
Federal Tax Revenue |
Federal Spending |
Trade Deficit |
Debt Per Family |
Unfunded Liabilities |
Taxpayers |
People supported by them |
July 31 2012 |
$15.93 trillion |
$2.364 trillion |
$3.632 trillion |
$810 billion |
$684,405 |
|
|
|
Dec 30 2012 |
$16.42 trillion |
$2.452 trillion |
$3.540 trillion |
$740.7 billion |
$732,086 |
|
|
|
July 31, 2013 |
$16.89
Trillion |
$2.73
trillion |
$3.535 trillion |
$703 billion |
$748,458 |
Unfunded Liabilities |
115.2 million |
109.9M
95.4% |
Dec 31, 2013 |
$17.27 trillion |
$2,82 trillion |
$3,480 trillion |
$692 billion |
$751,294 |
$127.2 trillion |
115.0 million |
108.5M
94.3% |
Aug 31, 2014 |
$17.70 trillion |
$2.97 trillion |
$3.53 trillion |
$706 billion |
$757,297 |
$118.0
trillion |
116.5 million |
104.5M
90.0% |
Sep 30, 2014 |
$17.77 trillion |
$2.98 trillion |
$3.53 trillion |
$707 billion |
$730,321 |
$116.3
trillion |
116.7 million |
104.9M
90.0% |
Oct 31, 2014 |
$17.9 trillion |
$3.05 trillion |
$3.53 trillion |
$703.5 billion |
$729,784 |
$115.4 trillion |
116.9 million |
105.1M
89.9% |
Nov 29, 2014 |
$18.0 trillion |
$3.07 trillion |
$3.55 trillion |
$710.8 billion |
$729,477 |
$115.7 trillion |
117.1 million |
105.1M
89.7% |
Dec 31, 2014 |
$18.04 trillion |
$3.08 trillion |
$3.57 trillion |
$713.2 billion |
$733,741 |
$92.5 trillion |
117.3 million |
104.4M
89.0% |
Jan 31, 2015 |
$18.10 trillion |
$3.11 trillion |
$3.59 trillion |
$318.7 billion |
$732,620 |
$94.1 trillion |
117.5 million |
105.7M
90.0% |
Feb 28, 2015 |
$18.14 trillion |
$3.13 trillion |
$3.60 trillion |
$725.0 billion |
$732,054 |
$95.3 trillion |
117.7 million |
|
Mar 31, 2015 |
$18.17 trillion |
$3.15 trillion |
$3.63 trillion |
$723.3 billion |
$757,614 |
$95.7 trillion |
117.8 million |
105.4M
89.5% |
April 30, 2015 |
$18.21 trillion |
$3.11 trillion |
$3.61 trillion |
$720.3 billion |
$759,875 |
$96.0 trillion |
118.1 million |
105.3M
89.1% |
May 29, 2015 |
$18.25 trillion |
$3.12 trillion |
$3.62 trillion |
$720.3 billion |
$761,889 |
$96.5 trillion |
118.3 million |
107.1M
90.5% |
Jun 30, 2015 |
$18.29 trillion |
$3.14 trillion |
$3.63 trillion |
$728.4 billion |
$752,894 |
$97.0 trillion |
118.5 million |
105.1M
88.7% |
Jul 31, 2015 |
$18.32 trillion |
$3.15 trillion |
$3.65 trillion |
$723.4 billion |
$753,212 |
$97.2 trillion |
118.7 million |
105.0M
88.4% |
Aug 31, 2015 |
$18.37 trillion |
$3.16 trillion |
$3.66 trillion |
$729.7 billion |
$753,533 |
$97.5 trillion |
118.9 million |
104.9M 88.2% |
In the last three months, our official debt has gone up by $120 billion. Furthermore, the tendency for the government to manipulate our unfunded debt amount seems to have tapered off as our debt has steadily increased and is now at the highest it’s ever been.
Incidentally, usdebtclock.org says there are 118.5 million taxpayers and that 160 million people receive government support. I’m not sure how they determine that recipient figure as some of their groups seem duplicated. Because of this, I add together US Retirees (48.8 million) food stamp recipients (45.3 million) and disabled people drawing social security (10.8 million). I don’t think there is any overlap here. These groups total 104.9 million and that’s why I say that they consist of 88.2% of the taxpayers. I could also include all government employees (23.7 million) as among those supported by taxpayers — but they do pay taxes too. As you think about these numbers remember another important group — the top 10% of the taxpayers (11.9 million) who pay most of the tax revenue.
Part II: The Current Stock Market Type Is Bear Volatile
My market type classification is not predictive but rather descriptive – rather than telling us what’s going to happen, it simply tells us what’s going on now.
I look at the Market SQN score for the last 100 days for the S&P 500 as my major indicator of market type. But we also look at the Market SQN® score for 25, 50 and 200 days. Right now the 200-day and 100-day market types are both Bear Volatile. The 50-day market type is Strong Bear Volatile and the 25 day is Bear Normal. Calling the current volatility “normal” might be misleading but for the 25 day volatility measurement, I use a very short term ATR percentage which went to very volatile last week and has come back to normal for the moment. My guess is that in another few days or sooner, the short term measurement will be volatile or very volatile again.
The graphs below include a chart of weekly bars for the S&P 500 over the last year, the Market SQN® score for 100 days, and the ATR% (20 day) volatility.
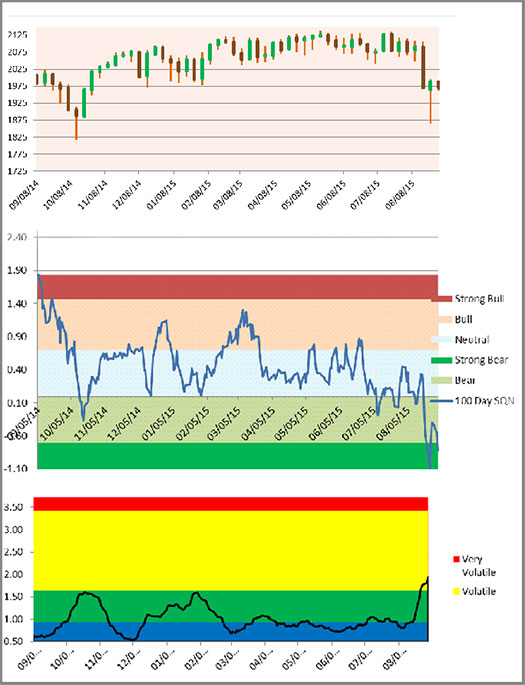
For a larger image CLICK HERE.
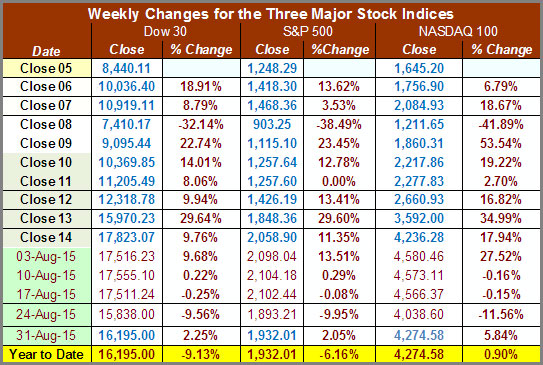
Below is a chart of the weekly changes in the three major US Indices. All three indices were up on the year effective last month. On Friday, August 28th the Dow was down 9%, the S&P 500 6%, and the NASDAQ 100 was up 1%. As of the open on Sept. 1, however, the NASDAQ 100 was down on the year.
Part III: Our Four Star Inflation-Deflation Model
In the simplest terms, inflation means that stuff gets more expensive, and deflation means that stuff gets cheaper. There’s a correlation between the inflation rate and market levels, so understanding inflation and deflation can help traders understand some important big-picture processes.
See the tracking table below.
Date |
CCI> DBC |
XLB |
Gold |
XLF |
Total Score |
Dec ‘05 |
347.89 |
30.28 |
513 |
31.67 |
|
Dec ‘06 |
394.89 |
34.84 |
635.5 |
36.74 |
|
Dec ‘07 |
476.08 |
41.7 |
833.3 |
28.9 |
|
Dec ‘08 |
352.06 |
22.74 |
865 |
12.52 |
|
Dec ‘09 |
484.42 |
32.99 |
1,104.00 |
14.1 |
|
Dec ‘10 |
629.53 |
38.47 |
1,410.25 |
16 |
|
Dec ‘11 |
564.37 |
33.5 |
1,574.59 |
13 |
|
Dec ’12 CCI>DBC |
556.08
27.79 |
37.54 |
1,564.80 |
16.39 |
1 |
May ‘14 |
26.03 |
49.08 |
1250.50 |
22.29 |
+0.0 |
June ‘14 |
26.58 |
49.64 |
1315.00 |
22.74 |
+2.0 |
Jul ‘14 |
25.32 |
48.65 |
1285.25 |
22.41 |
+1.0 |
Aug ‘14 |
25.03 |
50.53 |
1285.75 |
23.36 |
-2.0 |
Sep ‘14 |
23.22 |
49.59 |
1209.10 |
23.17 |
-2.0 |
Oct ‘14 |
22.31 |
48.40 |
1164.25 |
23.84 |
-2.5 |
Nov’ 14 |
20.42 |
49.16 |
1182.75 |
24.40 |
-2.5 |
Dec ‘14 |
18.45 |
48.59 |
1199.25 |
24.73 |
-3.0 |
Jan ‘15 |
17.40 |
47.69 |
1260.25 |
23.01 |
-3.0 |
Feb ‘15 |
18.17 |
51.49 |
1213.70 |
24.35 |
-1.0 |
Mar’15 |
17.01 |
48.78 |
1187.00 |
24.11 |
-3.0 |
Apr’ 15 |
18.29 |
50.42 |
1180.25 |
24.13 |
-1.5 |
May 15 |
17.71 |
50.61 |
1190.50 |
24.60 |
+0.5 |
Jun’ 15 |
18.00 |
48.39 |
1176.00 |
24.38 |
-1.0 |
Jul’ 15 |
15.73 |
45.94 |
1098.40 |
25.18 |
-2.5 |
Aug’ 15 |
15.69 |
43.36 |
1135.00 |
23.42 |
-2.5 |
Here are the model components and how the prices looked at the end of August compared with two months back and six months back.
Month |
DBC2 |
DBC6 |
XLB2 |
XLB6 |
Gold2 |
Gold6 |
XLF2 |
XLF6 |
Total Score |
|
Lower |
Lower |
Lower |
Lower |
Lower |
Lower |
Lower |
Lower |
|
Aug. 15 |
|
-1 |
|
-1 |
|
-1 |
|
+1/2 |
- 2 1/2 |
Notice that 11 out of the last 12 months have shown deflation. It’s interesting that in such an economic climate as this, we still get rumblings about the Fed (from their conference at Jackson Hole, WY last week) raising interest rates as soon as next month. But I’m not sure that’s really going to happen. Other countries are continuing to try to export their deflation to the US by devaluating their currencies.
Part IV: Tracking the Dollar
The dollar is stronger compared to where it was 200 days ago and weaker compared to where it was 100 days ago. Overall, we have both a down market in stocks and a relatively weak dollar. The strong uptrend in the US dollar definitely seems to be over and right now it seems to be in a wide trading range from 98 to 93. What’s next? I have no idea as this letter is not about prediction, just what is happening.
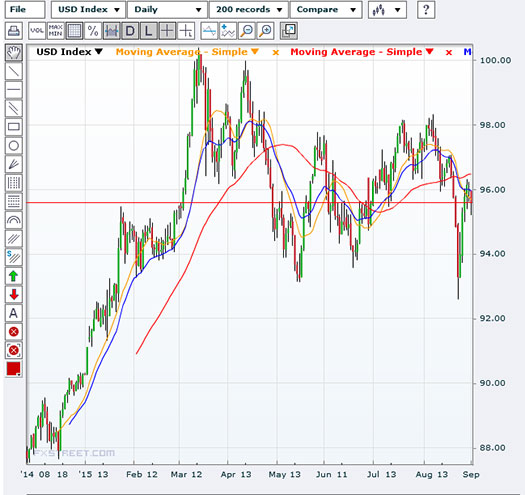
For a larger image CLICK HERE.
Conclusion
I provided the following quote in last month’s market update —
A famous trading guru once said that quiet markets are followed by volatile markets. And even I am willing to say that. So these sideways quiet markets will give way to chaos at some time in the future and that will present some great trading opportunities.
I could not have remotely guessed that a volatile market was only two weeks away and that we’d be in a Bear Volatile market type within a month’s time. For an idea about how fast the shift to volatile conditions has happened, here’s a price chart for the volatility ETF VXX with 60 minute bars for the last three weeks.
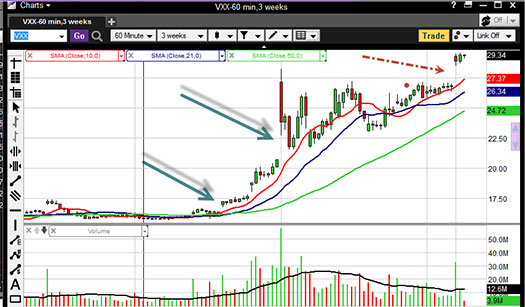
For a larger image CLICK HERE.
Since the bear really started two weeks ago, VXX has gone crazy. There have been three clear breakouts, indicated by arrows, with the latest on September 1st. During the last two weeks VXX has nearly doubled from 15.48 to 29.34. I’ve been using this to hedge our retirement portfolio — but my position hasn’t been nearly big enough given what has happened.
The market type could be Bear Volatile for some time to come but really, that’s just a possibility, not a prediction.
Ironically, not many people have come to our Bear Market Workshops in the last year. Perhaps that will change for the next workshop scheduled for November — or perhaps people won’t attend it heavily until the end of the bear market. That would reflect normal crowd psychology. For example, at our stock market trading workshop in March of 2000, we had 71 people in attendance — the most attendees for any workshop we’ve ever had.
Until next month’s update, this is Van Tharp.
About the Author: Trading coach and author Van K. Tharp, Ph.D. is widely recognized for his best-selling books and outstanding Peak Performance Home Study Program—a highly regarded classic that is suitable for all levels of traders and investors. You can learn more about Van Tharp at www.vantharp.com. His new book, Trading Beyond The Matrix, is available now at matrix.vantharp.com.
Workshops
Combo Discounts available for all back-to-back workshops!
See our workshop page for details.
Trading Tip
August 2015 SQN® Report
by Van K. Tharp, Ph.D.
Click here to resolve formatting problems
There are numerous ETFs that now track everything from countries, commodities, currencies and stock market indices to individual market sectors. ETFs provide a wonderfully easy way to discover what’s happening in the world markets. Consequently, I now apply a version of my System Quality Number® (SQN®) score to measure the relative performance of numerous markets in a world model.
The Market SQN score uses the daily percent change for input over a 100-day period. Typically, a Market SQN score over 1.47 is strongly bullish and a score below -0.7 is very weak. The following color codes help communicate the strengths and weaknesses of the ETFs in this report:
| |
• |
Dark Green: ETFs with very strong SQN® 100 scores > 1.47 |
| |
• |
Light Green: ETFs with strong SQN 100 scores (0.70 to 1.47). |
| |
• |
Yellow: ETFs with slightly positive Market SQN scores (0 to 0.70). These are Neutral/Sideways |
| |
• |
Brown: ETFs with slightly negative Market SQN scores (0 to -0.7). |
| |
• |
Red: Very weak ETFs that earn negative Market SQN scores (< -0.7).
|
This is basically the same ratings that we use for the Market SQN® Score. The world market model spreadsheet report below contains most currently available ETFs; including inverse funds, but excluding leveraged funds. In short, it covers the geographic world, the major asset classes, the equity market segments, the industrial sectors and the major currencies.
World Market Summary – Equities & Currencies
Each month, we look at the equities markets across the globe by segment, region and sector. This month we see a dramatic change across the board. The entire world is a sea of red and brown with a few yellows sprinkled in here and there. This will actually be a much shorter report than normal because everything is so bearish. There is little to say about each sector except that it’s bearish, however, this is rather exciting because good traders can make a lot of money now that there is a clear market direction.
This month the markets in the Americas are totally red and brown. In the US, the large caps are brown. Growth is brown and just about everything else is red.
In Asia everything is red except for Japan which is brown. This is truly a global downturn. Europe is mostly brown with two sectors being red — Emerging Europe and Germany.
The US sector view shows all red and brown with a few yellow areas — meaning weak and not (yet at least) impacted as hard by the downturn. The yellow sectors include Biotech, Insurance, Regional Banks, and Volatility (VXX has been one of the bottom five sectors for a long time). The worst sectors (below -1.0) include Building Materials, Energy, Metals and Mining, and Oil and Gas Exploration. These were all weak sectors before.
In currencies, the British pound vs the US Dollar is the strongest currency pair and it is the only green area on the entire display. The British Pound by itself, however, is just yellow. Other yellow currencies include the Euro, the Swedish Krona, the Swiss Franc, and the US Dollar bearish. The US Dollar is no longer dominating the currencies as it had for a long time and is actually brown now. The Yuan went from the strongest currency to red.
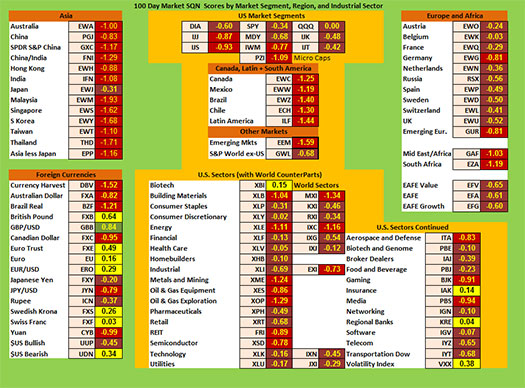
For a larger image CLICK HERE.
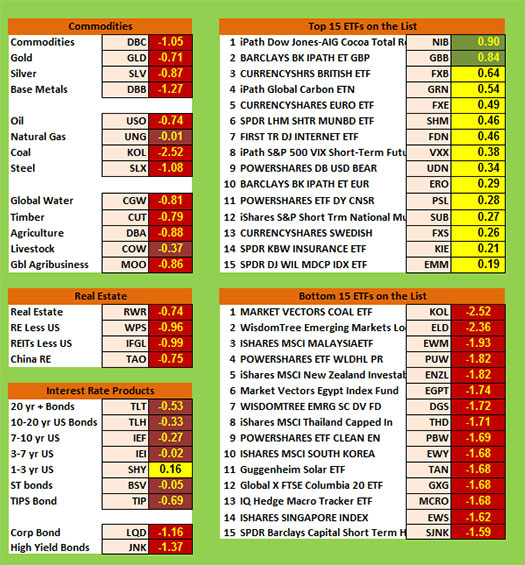
Commodities, Real Estate, Debt, Top and Bottom Lists
The next chart shows real estate, debt instruments, commodities and the top and bottom ETFs for the past 100 days.
Commodities, like everything else are all red and brown. Natural gas and livestock are brown and everything else is red. Coal is very, very weak. And gold and silver have gone back to red. Last month’s yellow commodity sectors — natural gas and global water are brown and red.
US real estate and real estate across the globe now looks weak, with everything being red.
Debt has not been a place for big money to escape. It’s brown except for very short term bonds which are yellow. Junk bonds and corporate bonds are both red. The market seems to be expecting higher interest rates.
As a group, the top ranking ETFs in the database are the weakest I’ve seen (I started doing these SQN report after 2008-9 bear market). The top 15 ETF list doesn’t have one Market SQN score above .90. And only two of them are green — the British Pound versus the US dollar and Cocoa. All the other top ETFs are yellow — which I’ve never seen before.
The bottom list includes two sectors with SQN scores below -2.0 (Coal and Emerging Markets long term debt). But everything (again) is below negative 1.5. Last month all the weakest were below negative 1.0.
Summary
Now let’s look at the summary table which measures the percentage of ETFs in each of the strength categories.
Date |
Very
Bullish |
Bullish |
Neutral |
Bearish |
Very
Bearish |
2013 |
> 1.5 |
0.75 - 1.5 |
0 - 0.75 |
0 - -0.7 |
< - 0.7 |
Jan 31st, |
27.1% |
39.6% |
20.7% |
6.4% |
4.7% |
Feb 28th |
10.3% |
45.2% |
24.4% |
11.9% |
7.5% |
Mar 31st |
39.2% |
25.5% |
19.1% |
9.0% |
6.4% |
Apr 30th |
49.1% |
21.1% |
14.8% |
8.0% |
6.2% |
May 31st |
29,2% |
23.6% |
19.9% |
12.3% |
14.2% |
Jun 30th |
2.1% |
31.0% |
23.2% |
22.0% |
20.9% |
Jul 31st |
8.2% |
33.5% |
29.0% |
13.3% |
15.2% |
Aug 30th |
1% |
15% |
46.4% |
19.3% |
17.5% |
Sep 30th |
1% |
13.8% |
42.3% |
23.0% |
19.1% |
Nov 1st |
13.3% |
48.3% |
21.8% |
12.5% |
3.3% |
Dec 1st |
14.6% |
42.7% |
24.2% |
13.3% |
4.3% |
Dec 31st |
19.3.% |
45.5% |
22.0% |
11.3% |
2.9% |
2014 |
|
|
|
|
|
Jan 31st |
8.0% |
49.3% |
20.7% |
12.7% |
7.6% |
Feb 28th |
18.9% |
48.4% |
18.1% |
6.2% |
6.8% |
Mar 31st |
4.9% |
40.2% |
38.8% |
13.3% |
3.1% |
Apr 30th |
11.1% |
33.9% |
40.2% |
11.3% |
1.8% |
May 31st |
12.5% |
46.5% |
27.7% |
7.6% |
6.0% |
Jun 30th |
53.4% |
33.7% |
14.2% |
2.5% |
0.8% |
Aug 29th |
20.3% |
45.2% |
22.8% |
10.5% |
5.3% |
Sep 30th |
6.6% |
26.9% |
30.2% |
24.0% |
18.5% |
Oct 31st |
2.9% |
17.9% |
38.8% |
17.7% |
26.3% |
Nov 30th |
3.1% |
25.7% |
25.1% |
22.8% |
27.9% |
Dec 31st |
3.7% |
29.2% |
24.8% |
15.6% |
31.2% |
2015 |
|
|
|
|
|
Jan 31st |
7.2% |
9.4% |
35.1% |
25.5% |
27.3% |
Feb 28th |
6.4% |
41.1% |
34.5% |
11.5% |
10.9% |
Mar 31st |
2.3% |
24.0% |
46.4% |
19.7% |
12.9% |
April 30th |
1.6% |
13.6% |
69.4% |
15.0% |
5.7% |
May 30th |
5.5% |
37.4% |
41.5% |
14.8% |
4.7% |
June 30th |
1.4% |
15.8% |
48.5% |
29.0% |
10.7% |
July 30th |
0% |
7.2% |
49.7% |
39.0% |
9.4% |
Aug 31st |
0% |
0.4% |
7.6% |
49.7% |
42.3% |
The strong move toward neutrality that I’ve been pointing out for several months has now broken as 92% of the ETFs we track are either in bear territory or strong bear territory. Since we have been keeping records, last month was the first time where no ETFs were in strong bull territory and that continued this month.
Be careful to base your actions upon what is happening, not what you think might happen.
And right now that action is very obvious — down, down, down.
Until the September SQN Report this is Van Tharp.
The markets always offer opportunities, but to capture those opportunities, you MUST know what you are doing. If you want to trade these markets, you need to approach them as a trader, not a long-term investor. We’d like to help you learn how to trade professionally because trying to navigate the markets without an education is hazardous to your wealth.
All the beliefs given in this update are my own. Though I find them useful, you may not. You can only trade your own beliefs about the markets.
NEW! Swing Trading Systems E-Learning Course
 We are excited to announce that our new Swing Trading Systems home study course is now available! Learn with Dr. Ken Long as he teaches his Swing Trading Systems Workshop via streaming video! We are excited to announce that our new Swing Trading Systems home study course is now available! Learn with Dr. Ken Long as he teaches his Swing Trading Systems Workshop via streaming video!
This new e-learning course includes Ken Long's Swing Trading Workshop, 5 swing trading systems and a bonus workshop featuring Van Tharp on Tharp Think principles. The course also includes extensive downloadable files to support your learning.
You can complete this course at your own pace, from the comfort of your own home or office, and access the materials as many times as you wish during your 1 year subscription period.
Take a look at this video from Ken to learn more about this course.

We have extensive information about the Swing Trading System e-learning course, including how to purchase...click the link below!
Learn More....
In the following 5 minute video, Ken highlights his swing trade of the week. Recognizing the broader trend in price, watching the regression line crossover, and getting a 5 days down failure signal generated a short entry in EWZ on July 22. Ken goes on to detail how the trade has been working out through this most recent Monday—August 24th.

Matrix Contest
 Enter the Matrix Contest Enter the Matrix Contest
for a chance to win a free workshop!
We want to hear about the one most profound insight that you got from reading Van's new book, Trading Beyond the Matrix, and how it has impacted your life. If you would like to enter, send an email to [email protected].
If you haven't purchased Trading Beyond the Matrix yet, click here.
For more information about the contest, click here.
Ask Van...
Everything we do here at the Van Tharp Institute is focused on helping you improve as a trader and investor. Consequently, we love to get your feedback, both positive and negative!
Send comments or ask Van a question by clicking here.
Also, Click here to take our quick, 6-question survey.
Back to Top
Contact Us
Email us at [email protected]
The Van Tharp Institute does not support spamming in any way, shape or form. This is a subscription based newsletter.
To change your e-mail Address, e-mail us at [email protected].
To stop your subscription, click on the "unsubscribe" link at the bottom left—hand corner of this email.
How are we doing? Give us your feedback! Click here to take our quick survey.
Call us at: 800-385-4486 * 919-466-0043 * Fax 919-466-0408
SQN® and the System Quality Number® are registered trademarks of the Van Tharp Institute and the International Institute of Trading Mastery, Inc.
Be sure to check us out on Facebook and Twitter!
 
Back to Top |
|
September 2, 2015 #749

Our Mission
Van's Top-Twelve Favorite Trading Books
Van's Favorite Non-Trading Books
Viewing on-line eliminates spacing, and formatting problems that may be unique to your email program.
Ongoing Contest: Learn how you could win a $50 coupon and a grand prize of a free workshop!
www.youtube.com/vantharp

"I base my long-term, monthly rebalancing [core] strategies on research into relative strength and momentum as it relates to broad asset classes."-K Long

A Must Read for All Traders
Super Trader
How are we doing?
Give us your feedback!
Click here to take our quick survey.
From our reader survey...
"I think the newsletter is extremely generous and it is a resource I utilize constantly. I have saved every single one since I first subscribed."
Trouble viewing this issue?
View Online. »
Van Tharp You Tube Channel
Tharp Concepts Explained...
-
Trading Psychology
-
System Development
-
Risk and R—Multiples
-
Position Sizing
-
Expectancy
-
Business Planning
Learn the concepts...
Read what Van says about the mission of his training institute.
The Position Sizing Game Version 4.0
Have you figured out yet how to pick the right stocks? Are you still looking for a high win-rate trading system? When you’re ready to get serious about your trader education, download the Position Sizing Game to learn some true fundamentals of trading success. Learn more.
To Download for Free or Upgrade Click Here

Download the first three levels of Version 4.0 for free:
Register now. »
Trouble viewing this issue?
View Online. »

Dr. Tharp is on Facebook

Follow Van through
Twitter »

Check out our home study materials, e-learning courses, and best-selling books.
Click here for products and pricing
What Kind of Trader Are You? Click below to take the test.
Tharp Trader Test
Back to Top

Introduction to Position Sizing™ Strategies
E-Learning Course
Perfect for auditory/visual learners who learn more effectively from an instructional format that is full of interactive features!
Only $149
Learn More
Buy Now
SQN® and the System Quality Number® are registered trademarks of the Van Tharp Institute
|