Tharp's Thoughts Weekly Newsletter
-
Article:
Starting Signal For Major FX Trends, by Gabriel Grammatidis
-
Workshops: Early Registration Discount Expires Next Week for Sydney, Australia
-
Tip: Rate Operating U.S. Oil Rigs Plummet:
The End of Cheap Gas?
by D.R. Barton, Jr.
-
Video: Did You Miss Ken Long's Latest Trading Video?
EARLY REGISTRATION DISCOUNT EXPIRES NEXT WEEK!
The Peak Performance 101 workshop has been the core of Van Tharp's instruction for 25 years.
 Join Van Tharp in Sydney, Australia for this life-changing workshop! Join Van Tharp in Sydney, Australia for this life-changing workshop!
Plus, Dr. Tharp will be presenting his new Mental Strategies workshop and his Blueprint for Trading Success.
Read below for more information
Check the combo discounts if you would like to attend more than one Sydney event.

Starting Signal For Major FX Trends
by Gabriel Grammatidis
Click to view in browser for better formatting
In a recent article Opportunities in the Current Market, Van and I wrote about how the Central Banks’ policies were laying the groundwork for long term volatility and extended currency trends. In this context, how can traders view the recent Swiss National Bank (SNB) release of its currency’s peg to the EUR? In an early retrospect of that action, I believe this action will be seen as the “starting signal” for an extended period of consistent FX trends. That is, Forex will be a very attractive trading environment for the years to come. Meanwhile, however, the SNB move also reminds traders that managing their risks should remain the primary goal of trading.
Swiss NB’s Peg
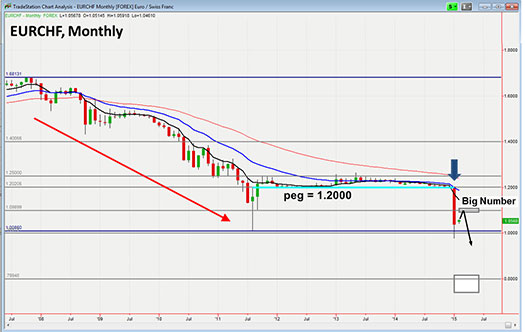
Traditionally, the Swiss Franc (CHF or Swissy) has long been seen as a safe harbor for international capital in times of turbulence. Capital started moving into CHF during the Global Financial Crisis in 2008 and that flow became a strong trend over the years since. In this period, the EURCHF was a great pair to trade short but the more the Swissy strengthened, the more the large exporting portion of Swiss economy suffered. In the summer of 2011, the SNB decided to peg the CHF to the EUR at a minimum rate of 1.2000.
How can such a peg be operationalized in practical terms when the currencies are openly traded in the market? Well, the SNB had to create new Swiss francs (ie by “printing” money) so that they could be sold in the market by buying Euros. This naturally led to a devaluation of the CHF against the EUR, establishing the peg. In order to be effective, however, the SNB had to continue this sell-CHF/buy-EUR process on a frequent basis.
For a number of years in my workshops, I have been saying that no Central Bank in the world can intervene against the free markets in the long run. During the three years of the peg, the SNB had to spend more than 300bn USD to maintain the target exchange rate. For a small country like Switzerland, the mounting costs (and monetary risks) became unbearable. As a result, on January 15th, the SNB decided to unpeg the Swissy from the Euro and the market had to find a new natural equilibrium. The EURCHF found that the balance after it dropped around 20%. That drop hurt many people positioned on the wrong side of the market. Whereas the SNB itself had to cover losses of around 80bn USD, the Swiss equities index dropped by around 10% with more considerable losses in the prices of companies with significant export based revenues. This event should act as a strong reminder for traders to focus on risks and let the market decide when to grant profits.
Could the SNB action have been foreseen? Yes and rather obviously - no market actor (even a central bank) is stronger than free market forces in the long-term. The timing on this decision, though, was a surprise and in the markets, surprises can bring a heavy cost. A few of the consequences were - a hedge fund liquidation (Everest Capital), the insolvency of Alpari (a UK spread-betting broker) as well as some heavy stock price losses for FXCM (a US based FX broker).
Why The Gap?
Stock traders experience price gaps on a regular basis but in the currency market, they are extremely rare. Bear in mind, even the suddenness of the Fukushima Tsunami in Japan did not cause a gap in the Yen. The CHF peg, however, was an exceptional situation: something I would call the Central Bank trap. The SNB had become the only seller of CHF in a market that had already dried up considerably (due to the peg). Once the decision to unpeg occurred, everybody knew that the SNB had a problem (the trap) and liquidity anywhere close to the peg level dried up even further. Obviously, nobody was prepared to sell the Swissy but only buy it at a much higher level, thus the market gap occurred.
Are there other pegged currencies? There are only a few – and none are very liquid, namely: the Danish Krone, the Hong Kong Dollar and the Chinese Yuan. None of these are attractive for active trading and should generally be avoided.
The Unpeg Charting Perspective
I like to look at what the charts tell me without being biased by outside opinion – actually I tend to ignore news opinion and good advice. Below, the monthly chart of the EURCHF shows a clear downtrend since the middle of 2008. You can clearly see the official peg at 1.2000 (the horizontal turquoise line) where the SNB kept the EUR exchange rate through frequent interventions. For more than 3 years, the peg helped create a tight and precise consolidation pattern respecting moving average lines (8 period EMA in black and 21 period EMA in blue). The large red January candle under the arrow clearly shows the breakout after the dissolution of the peg.
Click here to view a larger image
This chart pattern is a standard short setup identified by my System #2 - the “Flat-Level Breakout”. The system provides a price target at 0.8000 (the rectangle in the lower right) that should be achieved in the next 12-18 months. Currently, a healthy pullback is developing towards the Big Number 1.1000 (the upper thin rectangle). Once achieved, this location might offer a good opportunity to join the newly re-established downtrend on its way to the target.
During the peg, the EURCHF offered a huge downside potential with only a limited upside risk. Was the CHF unpeg a tradable pattern of System 2? Would it have been possible and advisable to do so? The answers to these questions (yes and perhaps) are not as simple as they might seem.
Trying to make such a trade would have depended on individual goals, the time horizon, and the instrument. The biggest unknown of all for such a trade, however, was the timing of the unpeg.
That aspect would have played a critical role in any trade because the right call for the timing would have to have been paired with the right Forex instrument for any hope of success.
Avoiding the Bullet
Van likes to point out that there is “one bullet in the market that has your name on it” and one of your jobs is to avoid allowing it to find you. Trading a pegged currency against the market with leverage is generally a poor idea: the small profits from going Long the EURCHF were countered by a huge potential downside risk. Some market actors got hit last month with the bullet Van talks about.
Having learned from making many trading mistakes myself, I have always told my workshop attendees over the years that applying several practical safeguards in risk management only makes sense. For one thing, there is no need to keep all your trading capital in your brokerage account – usually 30% of the full amount can be sufficient to trade well. Also, using leverage of 1:20 or less is sufficient enough to make good returns trading currencies - there is no need to leverage 1:400 as some brokers advertise. Second, the MF Global bankruptcy shows how important broker selection is. Brokers should keep your account funds segregated from its balance sheet. Any brokerage that dodges this standard industry practice should be eliminated from your selection pool. Appreciate your broker as a business partner - look for good service & competence rather than for the lowest transaction costs. More than anything, you want your money to remain safe and secure.
What’s Next?
I believe the SNB’s recent action was only the starting point for a new phase in the currency markets. We are likely to see continued longer term volatility in the major currency pairs because of the increasingly competitive monetary policies of the major Central Banks. With CHF now converting freely again, Forex traders have more trading opportunities with one more liquid currency – an important factor with the increased volatility.
Well prepared Forex traders can look forward to a great period of trading opportunities in the coming years. Equity traders and markets – I’m not so sure about.
All the best,
Gabriel Grammatidis
About the Author: Gabriel Grammatidis is a successful full-time trader and graduate of the Super Trader program. He has extensive experience trading Forex and shares his knowledge at his Forex and Live Forex Trading workshops, held regularly at VTI. Gabriel can be reached at gabriel "at" vantharp.com.
Workshops
Combo Discounts available for all back-to-back workshops!
See our workshop page for details.
Trading Tip

Operating U.S. Oil Rigs Plummet:
The End of Cheap Gas?
by D. R. Barton, Jr.
View in browser
At various times, certain economic numbers become hot and then go cold. Around election time, the hot numbers are always the weekly and monthly employment numbers. Back in the seventies, money supply figures were quite the hot numbers — trading rooms even made side bets on the announcements.
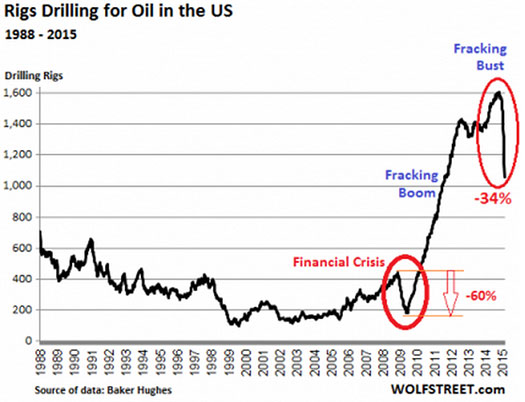
For the last few weeks, the hot number to watch has been the Baker Hughes Rig Count. Even though Baker Hughes has been counting U.S. and Canadian rigs since 1944 (and international rigs since 1975), it’s only recently that the number has caught the attention of the media.
And what does this hot number say? The U.S. rig count is plummeting. Since hitting the high of 1609 operating rigs in October, 2014, active rigs are down 34% as of Feb. 13. In fact, last week saw 98 more rigs drop out of service. This chart shows the current plunge quite well.
Pundits are now looking for a bottom in oil prices — but they’re not going to get one anytime soon. Why? Despite the recent (and modest) price recovery to the upside, let’s look at some data to find out why any low for oil may still be quite some time off.
Fewer Rigs (but More Oil?)
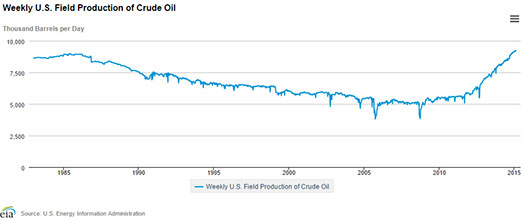
While the blogosphere and news articles have been loudly awash in stories about collapsing rig counts, a funny thing has been quietly happening out in the oil fields — production has continued increasing! But you don’t have to take my word for it. Here’s a self-explanatory graph from the U.S. Energy Information Administration (EIA) that include data up through the first week of February 2015.
 > >
Click here to view a larger image
And not to beat a dead horse, but my left-brained compatriots out there who love the data can dig into the following chart. Please note that since the rig count started falling off a cliff in October 2014, every single week has continued to bring a month-over-month increase in oil production. Up, up and away!

Click here to view a larger image
The reasons that crude is continuing to be extracted at increasing rates are many but here are two major ones.
| • |
|
The high debt load that many small and medium drillers have to service means that they have to keep the spigots open even at lower prices. |
| • |
|
Countries that are dependent on oil for a large part of their GDP have to maintain or even increase production to keep the needed funding going to social programs. |
Natural Gas – A Useful Comparison
And lest you think we are seeing just a rig count drop and temporary production increase in the face of falling prices, take a quick gander at this most informative Bloomberg long term chart of natural gas figures.
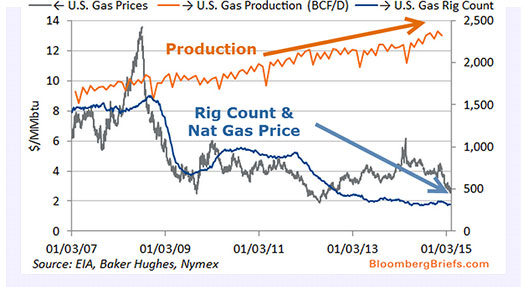
How can this be happening? There’s a combination of forces at work — technology advances, drilling skills, and strategy improvements. Tighter oil drilling techniques continue to improve at a rapid pace both in terms of efficiency (lower breakeven prices) and productivity (higher output per well). We saw these rapid improvements in natural gas first and now we’re seeing the same phenomenon in crude production. Until the innovation process slows down, natural gas and crude oil prices are likely to remain depressed for some time to come.
Your thoughts and comments are always welcome. Please send them to drbarton “at” vantharp.com — I always enjoy hearing from you!
Great Trading,
D. R.
Great Trading,
D. R.
About the Author: A passion for the systematic approach to the markets and lifelong love of teaching and learning have propelled D.R. Barton, Jr. to the top of the investment and trading arena. He is a regularly featured analyst on Fox Business’ Varney & Co. TV show (catch him most Thursdays between 12:30 and 12:45), on Bloomberg Radio Taking Stock and MarketWatch’s Money Life Show. He is also a frequent guest analyst on CNBC’s Closing Bell, WTOP News Radio in Washington, D.C., and has been a guest on China Central Television - America and Canada’s Business News Network. His articles have appeared on SmartMoney.com MarketWatch.com and Financial Advisor magazine. You may contact D.R. at "drbarton" at "vantharp.com".
Video
Join Ken Long in Just A Few Weeks for His Dynamic Day Trading Systems Workshop! $700 Discount Expires Soon.
One setup, for multiple trades: In this 16 minute video, Ken Long explains a series of trades he took over the last two days using a number of his market methodologies. First, he gives a thorough review of his overall market health check chart, then provides a swing trade setup, and finally shows how a specific chart pattern offered a low risk opportunity. You can see and hear how these different elements fit together for a profitable day trade on February 2 that then evolved into a swing trade overnight. Then, on February 3, he closed the swing trade while the chart revealed another RLCO intra-day trade opportunity in the opposite direction.
Join Ken in 6 weeks for his popular Day Trading Workshop, followed by two days of live trading. Click here to learn more.
To register or to see our full workshop schedule, click here.
 Enter the Matrix Contest Enter the Matrix Contest
for a chance to win a free workshop!
We want to hear about the one most profound insight that you got from reading Van's new book, Trading Beyond the Matrix, and how it has impacted your life. If you would like to enter, send an email to [email protected].
If you haven't purchased Trading Beyond the Matrix yet, click here.
For more information about the contest, click here.
Ask Van...
Everything we do here at the Van Tharp Institute is focused on helping you improve as a trader and investor. Consequently, we love to get your feedback, both positive and negative!
Send comments or ask Van a question by clicking here.
Also, Click here to take our quick, 6-question survey.
Back to Top
Contact Us
Email us at [email protected]
The Van Tharp Institute does not support spamming in any way, shape or form. This is a subscription based newsletter.
To change your e-mail Address, e-mail us at [email protected].
To stop your subscription, click on the "unsubscribe" link at the bottom left-hand corner of this email.
How are we doing? Give us your feedback! Click here to take our quick survey.
Call us at: 800-385-4486 * 919-466-0043 * Fax 919-466-0408
SQN® and the System Quality Number® are registered trademarks of the Van Tharp Institute and the International Institute of Trading Mastery, Inc.
Be sure to check us out on Facebook and Twitter!
 
Back to Top |
|
February 18, 2015 #721

Our Mission
Van's Top-Twelve Favorite Trading Books
Yahoo and Gmail Users:
Viewing on-line eliminates spacing, and formatting problems that may be unique to your email program.
Ongoing Contest: Learn how you could win a $50 coupon and a grand prize of a free workshop!

"I base my long-term, monthly rebalancing [core] strategies on research into relative strength and momentum as it relates to broad asset classes."-K Long

A Must Read for All Traders
Super Trader
How are we doing?
Give us your feedback!
Click here to take our quick survey.
From our reader survey...
"I think the newsletter is extremely generous and it is a resource I utilize constantly. I have saved every single one since I first subscribed."
Trouble viewing this issue?
View Online. »
Tharp Concepts Explained...
-
Trading Psychology
-
System Development
-
Risk and R-Multiples
-
Position Sizing
-
Expectancy
-
Business Planning
Learn the concepts...
Read what Van says about the mission of his training institute.
The Position Sizing Game Version 4.0
Have you figured out yet how to pick the right stocks? Are you still looking for a high win-rate trading system? When you’re ready to get serious about your trader education, download the Position Sizing Game to learn some true fundamentals of trading success. Learn more.
To Download for Free or Upgrade Click Here

Download the first three levels of Version 4.0 for free.
Register now. »
Trouble viewing this issue?
View Online. »

Dr. Tharp is on Facebook

Follow Van through
Twitter »

Check out our home study materials, e-learning courses, and best-selling books.
Click here for products and pricing
What kind of Trader Are You? Click below to take the test.
Tharp Trader Test
Back to Top

Introduction to Position Sizing™ Strategies
E-Learning Course
Perfect for auditory/visual learners who learn more effectively from an instructional format that is full of interactive features!
Only $149
Learn More
Buy Now
SQN® and the System Quality Number® are registered trademarks of the Van Tharp Institute
|