Tharp's Thoughts Weekly Newsletter
-
Article:
Don’t Believe the Hype: The January Barometer is Broken, by D.R. Barton, Jr.
-
Workshops: March has two locations: Cary, NC and Sydney, Australia
-
Tip: Extreme Price Moves - What Part Is For You?
by Ken Long
 Ken Long's High Calibre Ken Long's High Calibre
Day Trading Workshop Coming In March
In this workshop, Ken Long teaches the FROG trading system and the RLCO day trading systems.
Ken has been an a long-time, active trader and observer of the markets. He's noticed the consistent habit of prices for particular issues to move a certain amount. Much like a frog jumps when it hears a loud noise, prices tend to move a certain amount before they pause or move again. Different frogs are able to jump different distances, but each one tends to jump about the same distance as it did last time. Would it be possible to know about how far a stock’s price would move on any given day? Ken’s frog system is a useful – and tradable - guide.
Attend the day trading systems workshop and learn the frog and RLCO systems. Stay on for two more days and trade those systems live alongside Ken!
For more information about both systems, click here.
To register or to see our full workshop schedule, click here.
Article
Don’t Believe the Hype:
The January Barometer is Broken
by D. R. Barton, Jr.
View in browser
History is of full of strategies that worked for a time, became ineffective and were subsequently abandoned.
Modern day examples can be found in product development, marketing, and even comedy. But the easiest place to understand this phenomenon might be on the military battlefield.
For the thousands of years before gunpowder was employed in the 13th century, military tactics using swords, spears, shields, bows and arrows were of paramount importance on the battlefield. Of all those tactics, one of the most famous, effective and enduring formations was the Greek phalanx. In this formation soldiers packed densely together with interlocking shields and used long spears. The unified, and seemingly impenetrable, front gave the phalanx its legendary strength.
Military leaders made many variations to the original rectangular formation over time and the phalanx as a dominant military formation reached its peak effectiveness under the command of Alexander of Macedon (better known as Alexander the Great). His use of unbalanced phalanx formations, his ability to move troops quickly and his brilliant field leadership brought this military strategy to its zenith.
Then following closely behind the death of Alexander came the death of the phalanx. The phalanx became ineffective in the face of the faster and more flexible three-line Roman Legion. The Roman conquest of the Greek city states and the rest of the known world followed.
Like the rise and fall of the phalanx as a military strategy, we have a famous indicator that once worked well, but has come to the end of its useful life—the January Barometer. Just as the agile Roman Legion overwhelmed the phalanx, quick and volatile markets have killed off the January Barometer as well.
The January Barometer – Many Will Discuss It, Few Will Understand It
As we head into the end of January in the coming ten days, pundits will write and talking heads will talk about the January Barometer in glowing terms. Don’t be sucked in by their hype.
The indicator was first presented by Yale Hirsch in 1972 and lives on in the Stock Trader’s Almanac authored by Hirsch and his son. I keep an up-to-date copy on my desk and find it has many useful references. But this particular indicator has gone the way of the phalanx—once useful but now only of historic interest. Let’s dig into the numbers to see why.
On the surface, the January Barometer has had an impressive track record with an 87.7% accuracy claim over the past 65 years. That’s the number you’ll hear quoted over and over again. It is calculated quite simply in this way—if January generates a positive return for the S&P 500, the January Barometer predicts that the full calendar year will be positive, and vice versa for a down January.
That indicator makes an exception for any year that the market moves less than 5% in either direction—in which case those years are called neutral or flat; the flat year is then not counted for or against the track record (which is a reasonable exception). Given that caveat, the January Barometer has only been wrong eight times in the last 65 years, a credible job of predicting up and down years. That is, until we look at its recent performance.
If we break down the January Barometer signals into decades and look at how many times it was correct in those 10 year sets, we start to see a problem. Let’s look at how many misses (an up January in a down year or vice versa) and how many flat years there have been per decade. Once we subtract misses and flat years from 10, the remaining years in the decade are the ones that the indicator can claim to be helpful:
Decade |
Misses |
Flat Years |
# Helpful Years |
1951-1960 |
0 |
2 |
8 |
1961-1970 |
2 |
1 |
7 |
1971-1980 |
0 |
1 |
9 |
1981-1990 |
1 |
2 |
7 |
1991-2000 |
0 |
2 |
8 |
2001-2010 |
4 |
2 |
4 |
2011-2014 |
1 |
1 |
2 |
As you can see, the usefulness or efficacy of the indicator has dropped off drastically in the last fourteen years. In fact, the indicator has only been useful in 6 years since 2000.
A sample of fourteen data points is not a statistically significant size, but it does raise the question as to whether a once robust indicator has any effectiveness in predicting market direction now. It would seem not. Perhaps there has been a change in the investment behaviors that drive markets. Perhaps the tax selling of stocks from December that turns into January buying is no longer a significant factor. Regardless of whether underlying investing practices have changed, the structural nature of the markets has changed. Since 2000, markets have become more volatile and large scale direction changes occur more quickly and go further.
But let’s dig one level deeper into the January Barometer. There’s a logic flaw lurking within that makes the indicator broken.
The January Barometer’s Flawed Logic
The Stock Trader’s Almanac judges the January Barometer by using calendar year results. Those gains (or losses), however, contain the January returns. It’s a bit like saying football teams who outscore their opponents in the first quarter are likely to win the game (and vice versa).
To trade the January Barometer strategy idea more effectively, you would have to buy or sell on the first trading day of February and exit on the last day of December every year. You would sit out of the market for the month of January every year. Using that strategy would have earned you a whopping 40.1% return in 2008 but over the last 14 years, you would have lost 8.5% of your original investment.
“Back in the day”, the January Barometer may have had a good run but in today’s market, driven by the faster news media cycle, it’s not even useful for cocktail talk anymore . . .
I’d love to hear your thoughts and feedback – just send an email to drbarton “at” vantharp.com. Until next week…
Great Trading,
D. R.
About the Author: A passion for the systematic approach to the markets and lifelong love of teaching and learning have propelled D.R. Barton, Jr. to the top of the investment and trading arena. He is a regularly featured guest on both Report on Business TV, and WTOP News Radio in Washington, D.C., and has been a guest on Bloomberg Radio. His articles have appeared on SmartMoney.com and Financial Advisor magazine. You may contact D.R. at "drbarton" at "vantharp.com".
Workshops
Combo Discounts available for all back-to-back workshops!
See our workshop page for details.
Trading Tip

Extreme Price Moves - What Part Is For You?
by Ken Long
Click to view in browser for better formatting
Every extreme price move that pauses for a moment contains sufficient emotionally charged potential energy for a rapid follow-on directional move. The pause, however presents a challenge in that it creates two simultaneous trade frames: a continuation in the direction of the trend after the pause or a reversion to the mean. This is mathematically true.
If you want to trade this critical moment, you must have a clear plan.
Below is an example of one of these extreme price moves, VXX Hourly Price Chart on Dec. 31, 2014:
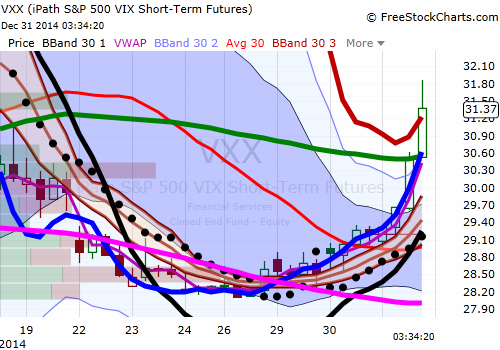
By planning to trade such a move when you are in a calm mental state, you reduce the stress of deciding in the moment of rapidly changing prices. For these kinds of moves, consider four possible templates:
(1) Do nothing, these moves are too volatile for your comfort level;
(2) Wait for the pause or reversion to stall and then rejoin the trend as it begins to resume;
(3) Counter-trend reversion to the mean for a quick hit;
(4) Trade both directions (ie 2 and 3).
Will you avoid any stress by following Template 1? Actually, that approach can create stress because you see these moves taking place and believe you should be trading. For the least stress, my general advice would be to trade Template 2. Template 3 has less opportunity for long moves. If you choose to enter this way, understand that there is a lot of emotion and money invested in the primary trend. The key with the counter-trend trade is to respect the R in hand by harvesting measured moves, getting to no lose quickly and mastering rules for reentry in the case that the count-trend shifts to become the prevailing trend.
Once you have defined a clear strategy for how to deal with each part of the price curve, next consider how market conditions may impact the direction and duration of trade. For example -
• The shift in trend in a stock’s sector may shift the direction of a stock.
• The low market volatility indicated by a Risk-Z score (statistical measurement of relative volatility) greater than one standard deviation may limit the extent and duration of a stock’s trend.
• A high slopestat value (statistical measurement of the slope of prices) that is beginning to rollover may indicate a change in the overall market trend.
• A RLCO Pattern #1 (Regression Line Crossover price pattern) could be evidence of a change in market and trend condition.
Depending on market conditions and specific information, you may prefer trading one template over another and/or choose to adjust your trade management of an open position.
Since the market provides us with an infinite number of opportunities—and will continue to do so as long as human nature remains what it is, only fill your bowl with what you can carry on each trade. You don’t have to be remotely close to perfect; you just have to have a thick skin in order to survive your own self talk and lack of confidence. Then work on your proficiency at capturing the moves you can envision, frame, measure and act upon.
About the Author: Dr. Ken Long retired from the Army as a Lieutenant Colonel and teaches at the U.S. Army Staff College. He is a proud father of three, a husband, teacher, student, martial artist and active trader. Ken also instructs dynamic trading workshops for the Van Tharp Institute. Watch this video to hear two testimonials from students of Ken Long. His next workshop is just around the corner, Day Trading Systems in March.
 Enter the Matrix Contest Enter the Matrix Contest
for a chance to win a free workshop!
We want to hear about the one most profound insight that you got from reading Van's new book, Trading Beyond the Matrix, and how it has impacted your life. If you would like to enter, send an email to [email protected].
If you haven't purchased Trading Beyond the Matrix yet, click here.
For more information about the contest, click here.
Ask Van...
Everything we do here at the Van Tharp Institute is focused on helping you improve as a trader and investor. Consequently, we love to get your feedback, both positive and negative!
Send comments or ask Van a question by clicking here.
Also, Click here to take our quick, 6-question survey.
Back to Top
Contact Us
Email us at [email protected]
The Van Tharp Institute does not support spamming in any way, shape or form. This is a subscription based newsletter.
To change your e-mail Address, e-mail us at [email protected].
To stop your subscription, click on the "unsubscribe" link at the bottom left-hand corner of this email.
How are we doing? Give us your feedback! Click here to take our quick survey.
Call us at: 800-385-4486 * 919-466-0043 * Fax 919-466-0408
SQN® and the System Quality Number® are registered trademarks of the Van Tharp Institute and the International Institute of Trading Mastery, Inc.
Be sure to check us out on Facebook and Twitter!
 
Back to Top |


