Tharp's Thoughts Weekly Newsletter (View On-Line)
-
Article Reading Psychological Footprints by Gabriel Grammatidis
-
-
Trading Tip Understanding Market Volatility in 3 Charts by D. R. Barton, Jr.
New! Tharp Think Essentials Workshop
September 6-7
Presented by Van K. Tharp and Janie Guill
This workshop covers the key concepts that you need to thoroughly understand to become a great trader, such as:
- Creating strong trading objectives,
- The key levels of transformation,
- Reward to risk ratio,
- Identifying and avoiding trading mistakes,
- Meeting your objectives through position sizing strategies, and more.
We do not plan to present this workshop again, so if you would like to attend this is your only opportunity. Register soon to take advantage of the $700 early enrollment discount (you pay only $1,295)!
Click here to learn the benefits of attending this unique workshop.
Or, go the workshop schedule page to register....
Article
Reading Psychological Footprints for Low-Risk Ideas
A Follow Up to May's Yen Crossing Opportunities
by Gabriel Grammatidis
View On-line
 For traders and investors, finding low risk ideas is one of the most important tasks no matter what asset class you trade — stocks, bonds, forex, commodities or real estate. Looking back a couple of hundred years ago, this task has not changed much: Native Americans read footprints in order to provide for their families. Being able to read these tracks well (pattern recognition) represented a major edge for their survival. Back then and today, the key was/is to find a large reward for a minimum amount of risk. For traders and investors, finding low risk ideas is one of the most important tasks no matter what asset class you trade — stocks, bonds, forex, commodities or real estate. Looking back a couple of hundred years ago, this task has not changed much: Native Americans read footprints in order to provide for their families. Being able to read these tracks well (pattern recognition) represented a major edge for their survival. Back then and today, the key was/is to find a large reward for a minimum amount of risk.
In the context of modern capital markets, we try to identify opportunities having a large reward-to-risk ratio or simply being a low-risk idea. Today, finding distinct, repeating, and profitable footprints or patterns in the charts is still an edge. Has so much really changed over the centuries?
Being able to read the footprints in the charts requires a calm mind, a large amount of experience, and a good portion of intuition can be helpful. Based on past experience, one can draw valuable conclusions (e.g. a set of useful beliefs) and deduct probabilities that form the basis for trading systems with an edge that produce a sufficient stream of low-risk ideas.
“Psychological Footprints” — Left By Market Actors
A “footprint” is a specific constellation (or pattern) at a certain moment in time that can be described by selected indicators, specific price patterns, certain multi-timeframe constellations, and other factors. At specific points in charts, strong emotions of both buyers and sellers converge and the interaction leaves a distinct trace in the chart. The more emotional pain involved, the clearer the trace (Native Americans would sometimes detect traces of blood). These same points yield good predictive powers as to how market participants will behave once they approach these emotionally-loaded levels again.
A Practical Example — Yen Busted Breakout
In my last article on 21st of May titled “Yen Crossing Opportunities”, the charts made a good case for a short trade in the Yen. Based on the psychological footprints at that point, the Busted Breakout (System 1 from the Forex Workshop) triggered short for the EURJPY (15min chart, 14th May). What were the first footprints in the chart that generated attention at the higher timeframes? Let’s have a quick look —
- Overextension of price from the MAs (Monthly chart)
- Bar close breaking below the 21MA (Weekly chart)
- Trend change down with the MAs stacked correctly on top of each other (Daily chart)
- Triple price top (240min chart)
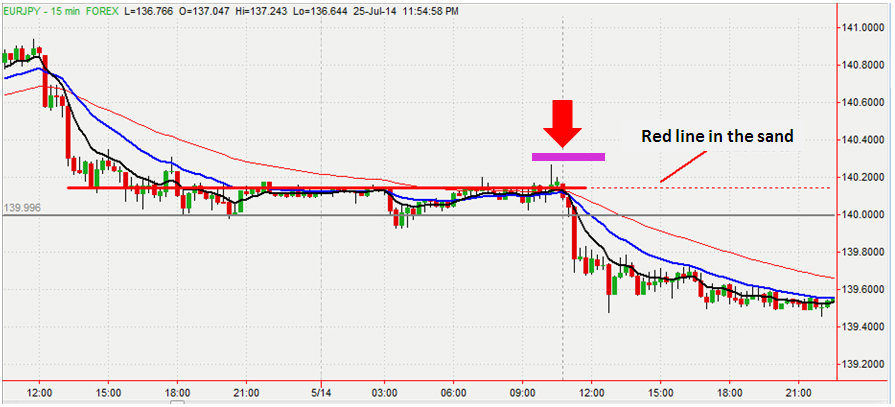
Now, zooming into lower timeframes is needed (like with a microscope) to identify the psychological dynamics of buyers & sellers of that currency pair. The real “big footprints” were found with the Busted Breakout pattern that initiated the EURJPY short in the 15min chart. In the chart below, see the entry indicated by the red arrow and the initial stop indicated by the purple line:
(To see a larger version of this chart, click here.)
Two requirements (of several) for a Busted Breakout pattern are a good price consolidation with a horizontal level on the top (thick red line) and a breakout above the line that fails and re-breaks the line (two green breakout bars just prior to red arrow). The re-break of the line is the point of entry and the stop is positioned at the breakout failure high.
Red Lines in The Sand
Active buyers and sellers make a market. In the above example we have a situation in which buyers and sellers have been stalking each other for quite some time (see horizontal thick red line). Let’s take a look at the psychology in the footprints found in the pattern above. This description of what happens in the pattern is based on a set of my beliefs.
The longer a price consolidation goes on, the more convinced buyers become that a long breakout of this horizontal level will be successful. (Please keep in mind that in general the majority of breakouts fail.) After a quick 2 bar breakout, prices re-break the line to the negative side resuming the overall downtrend. In this situation buyers are “trapped” in a breakout that fails to go up – their stops are hit and this generates emotional pain.
On the other hand, sellers had been shorting the EURJPY already and moved their stops to some level above the horizontal red line where they thought their short was “well-protected” (based on their beliefs). When the long breakout was attempted, those short stops got triggered, and the sellers were “trapped” too. As prices start to go lower finally after the failed breakout, sellers feel emotional pain as they are now out of their short positions. They see the lost opportunity and want (need?) to get short again.
This situation “double traps” buyers and sellers and is associated with a lot of pain (or blood, to continue the metaphor) in the markets. As a result, observant traders can identify a major resistance level that remains valid in the future and draw a “red line in the sand” (the dashed red line in the chart above).
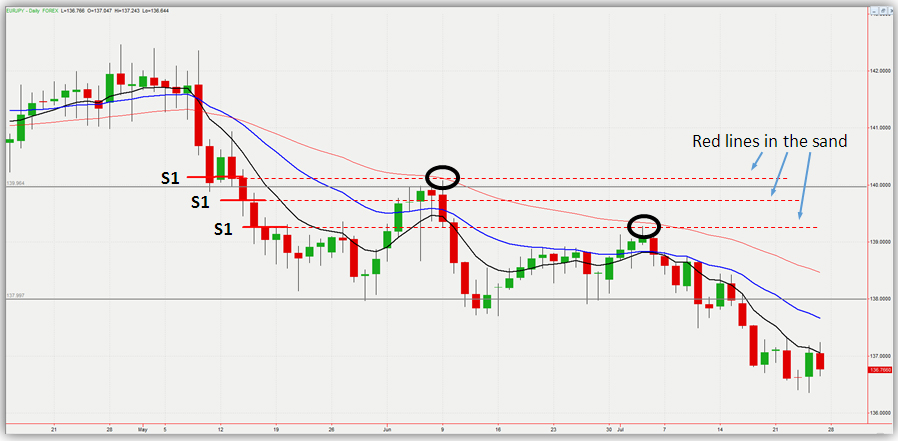
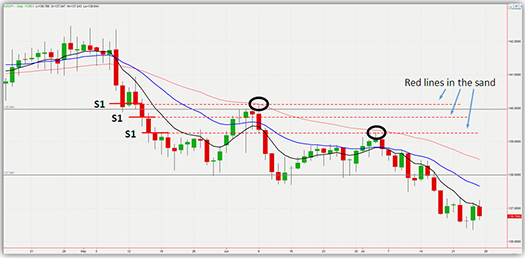
Actually, the price pattern in the 15min chart above was the first of three consecutive Busted Breakouts (and very good trades) for the EURJPY pair. The daily chart below shows the levels at the exact positions where the three Busted Breakout patterns occurred— see thick red lines labeled S1. The associated dashed red lines (lines in the sand) represent three major resistance levels.
(To see a larger version of this chart, click here.)
One can observe how these three levels — three double traps — established themselves as major levels of resistance. The first strong pullback upwards went right through the first two lines, but stopped at the 3rd line of resistance on June 9 (see the first black circle). This was the point in the chart where a major lower high was generated, and from which prices went for a new low.
In mid-June, I made a short video about framing a good reward to risk trade based on that second Busted Breakout pattern. The second pullback from the downtrend did not go very high at all and was rejected at the 1st line of resistance (second black circle) in early July which provided another sign of further EURJPY weakness to come.
For any additional pullbacks to happen, please be aware that these levels still remain important. Psychological footprints remain “reality” until the emotional pain that generated them has dissolved. Very similarly, footprints in nature can only be detected for a certain amount of time after an animal left them.
With a slightly different twist, I hope you found this article interesting & helpful.
All the best, Gabriel
Image credit: blackhawkproductions.com
About the Author: Gabriel Grammatidis is a successful full-time trader and graduate of the Super Trader program. He has extensive experience trading Forex and will share his knowledge at a three-day Forex Workshop being held October 11-13, followed by two days of Live Trading, October 14-15. Gabriel can be reached at gabriel "at" vantharp.com.
Disclaimer
Workshops
Forex Trading Systems Workshop...Coming in October!
Gabriel, a professional Forex Trader and graduate of Van's Super Trader Program, will be back soon to teach a three-day Forex Trading Systems Workshop, followed by two days of live trading sessions. Gabriel will discuss Forex trading ideas and teach three specific trend-based trading systems. These systems can be traded in various timeframes and can be traded across a wide range of currency pairs. Gabriel’s preferred style is swing trading using primarily 15-minute, 60-minute and 240-minute candle charts.
Learn More.... |
| September: USA |
| Sept 6-7 |
New! Tharp Think Essentials
with Van Tharp and Janie Guill |
| September: Berlin, Germany |
| Sept 19-21 |
Peak Performance 101
with Van Tharp and co-instructor Janie Guill |
| Sept 23-26 |
Peak Performance 202
with Van Tharp and Libby Adams and co-instructor Janie Guill |
| Sept 28-30 |
Peak Performance 203
with Van Tharp and co-instructor Janie Guill |
| October |
| Oct 11-13 |
Forex Trading
with Gabriel Grammatidis |
| Oct 14-15 |
Live Forex Trading
with Gabriel Grammatidis |
| Oct 17-19 |
Swing Trading Systems
with Ken Long |
November |
| Oct 30-Nov 1 |
Peak Performance 101
with Van Tharp and co-instructors RJ Hixson and Janie Guill |
| Nov 3-6 |
Peak Performance 202
with Van Tharp and Libby Adams
and co-instructors RJ Hixson and Janie Guill |
| For Super Trader Only Events, click here. |
Combo Discounts available for all back-to-back workshops!
See our workshop page for details.
Trading Tip
Understanding Market Volatility in Three Charts
Plus an Institutional Trading Desk Insight
by D. R. Barton, Jr.
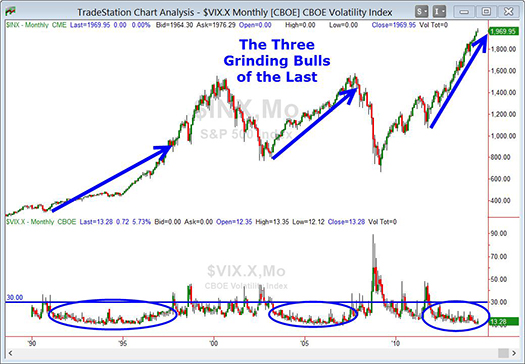
The persistently low market volatility has been an unending source of discussion for analysts, pundits and traders. And rightfully so — the low volatility environment that is a major characteristic of grinding bull markets (mid-1990s, 2003–2007, and late 2011–present; see chart below) has not only changed the trading strategies for options writers but has also given equities traders a seeming carte blanche to pile into the markets.
The sometimes wacky, sometimes useful Business Insiders website has just put out its “Most Important Charts” roundup, where serious analysts and a few traders send in their contributions. Not surprisingly, low volatility visuals often show up along with Chinese debt & housing, Fed QE explanations and several on the U.S. housing market and employment picture. I’ve included a couple of my favorites below (yes I did slog through all 91 charts for you loyal readers…!).
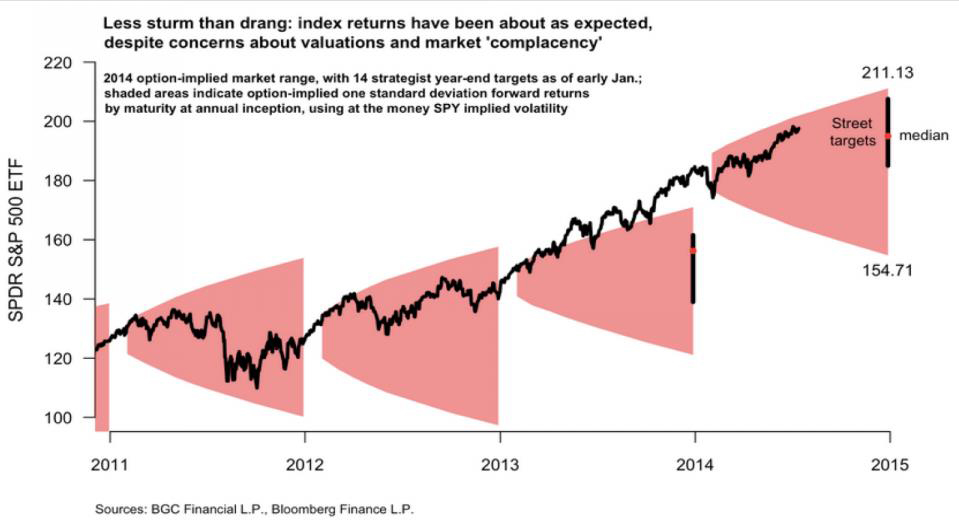
2014 Market Performance VS. Implied Volatility Forecast
First up is a chart that I found interesting because it shows, in a very useable format, a visual interpretation of implied volatility. Implied volatility is a mathematical forecast of price’s future variability. In this chart, Jared Woodard, Equity Derivatives Strategist at BGC Partners took the beginning-of-the-year price projections from a group of analysts for each of the past four years and projected them out as pink parabolic cones. These cones represent the implied range based on options prices at the beginning of the year:
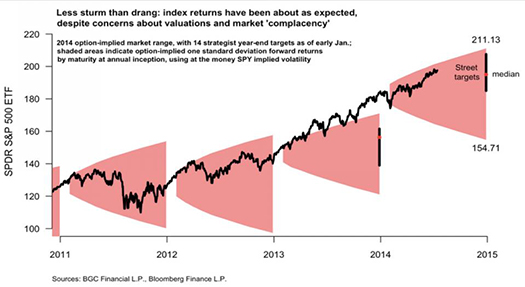
(To see a larger version of this chart, click here.)
A few observations:
- This year’s market movement so far has been well within the implied range.
- There is some upside still available along with some significant downside possible.
- We’ve already exceeded the 14 analysts’ median target for the year.
- Last year, the market showed true outperformance.
- Even the huge drop in 2011 when U.S. debt was downgraded amid the early stages of the European debt crisis was contained within this definition of implied annual range.
Small Caps & Large Caps Volatility Ratio
In our last chart (below) you can see the ratio of the Russell 2000 Volatility Index divided by the S&P 500 Volatility Index. The chart shows the 30-day implied volatility between small cap and large cap stocks. David Marquart, Portfolio Manager at Quad Capital contributed this chart and note that it ends right on July 17th. The Malaysian airliner was tragically shot down earlier that day over eastern Ukraine which sent equity prices down across the board. The ratio is significantly lower now at 1.475, though still in the upper end of the range:
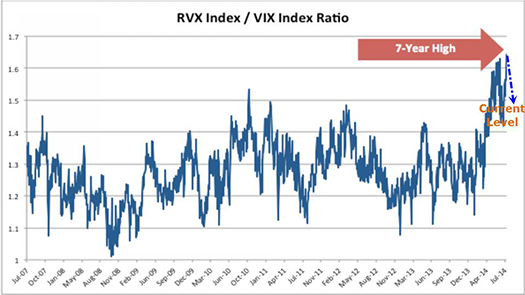
Observations:
- Marquart interprets this divergence as a shift in risk sentiment from higher-beta assets.
- His second insight is that this chart highlights the correlation opportunities that volatility traders look to exploit until implied volatilities begin to realize historical levels again.
- Both of these are very astute interpretations; remember that implied volatility goes up as price goes down. This means the Russell has retreated significantly from its record highs while the S&P has not…
Insights from an Institutional Trading Desk
Here are a few closing thoughts on a lesser known aspect of volatility. An institutional trading desk that we work with told us that the implied volatility skew is at the highest levels seen since the real estate / credit bubble burst.
Volatility skew is the difference between the price for out-of-the-money (OTM) puts vs. OTM calls. Since the 1987 Black Monday crash, this skew has been persistent and significant but the trading desk reports that the skew on the S&P 500 is currently at an extreme. That is, puts are very expensive and calls are relatively cheap. A primary impact on institutional investors is that the buy-write strategy (where a firm sells or “writes” a call option to produce income and hedge the position) has dwindled to almost nothing.
The trading desk manager cautioned us that volatility really is creeping into the market but not showing up in traditional VIX calculations. All investors and traders should heed this warning.
As always, your thoughts and comments are always welcome — please send them to drbarton “at” vantharp.com.
Great Trading,
D. R.
About the Author: A passion for the systematic approach to the markets and lifelong love of teaching and learning have propelled D.R. Barton, Jr. to the top of the investment and trading arena. He is a regularly featured guest on both Report on Business TV, and WTOP News Radio in Washington, D.C., and has been a guest on Bloomberg Radio. His articles have appeared on SmartMoney.com and Financial Advisor magazine. You may contact D.R. at "drbarton" at "vantharp.com".
Disclaimer
New
 Streaming Video: Core Trading Systems Workshop Streaming Video: Core Trading Systems Workshop
Learn five trading systems in your own space, at your own pace!
One of the primary objectives of longer-term systems is that they require less management than shorter term systems. Ken Long's Core Systems can be operated outside of market hours in less than an hour per month.
You can now stream the digitally recorded Core Trading Systems Workshop and download the companion documents for a special introductory price.
The price of the workshop is $2,295 but the recorded home study is only $1,295. However...for a limited time we are offering this new product for only $995!
Buy Now for only $995
There is a lot more to learn about this new home study. Go to www.vantharp.com/products/core-workshop-video-home-study.asp
Click here for a short video overview about the Core home study option.
Ask Van...
Everything we do here at the Van Tharp Institute is focused on helping you improve as a trader and investor. Consequently, we love to get your feedback, both positive and negative!
Send comments or ask Van a question by clicking here.
Also, Click here to take our quick, 6-question survey.
Back to Top
Contact Us
Email us at [email protected]
The Van Tharp Institute does not support spamming in any way, shape or form. This is a subscription based newsletter.
To change your e-mail Address, e-mail us at [email protected].
To stop your subscription, click on the "unsubscribe" link at the bottom left-hand corner of this email.
How are we doing? Give us your feedback! Click here to take our quick survey.
Call us at: 800-385-4486 * 919-466-0043 * Fax 919-466-0408
SQN® and the System Quality Number® are registered trademarks of the Van Tharp Institute and the International Institute of Trading Mastery, Inc.
Be sure to check us out on Facebook and Twitter!
 
Back to Top |