Tharp's Thoughts Weekly Newsletter (View On-Line)
-
Article Monthly Market Update: Strong Bull Quiet by Van K. Tharp, Ph.D.
-
-
Trading Tip June 2014 SQN Report by Van K. Tharp, Ph.D.
-
Matrix Insights: The Short Seller vs The Artist, An Explosive Bombshell/Quiet Truth
 $700 Discount on Day Trading Systems Workshop $700 Discount on Day Trading Systems Workshop
Ends Next Week on July 9th!
VTI has developed a custom trading simulator for the RLCO and Frog systems. You can trade the systems over and over to quickly develop a strong understanding of the rules so you learn how they feel to trade – using real data!
Workshop Dates: July 18-20, Live Trading July 21-22
For more information or to register, click here.
Article

June 2014 Market Update: Strong Bull Quiet
by Van K. Tharp, Ph.D.
View On-line
I always say that people do not trade the markets; they trade their beliefs about the markets. In that same way, I'd like to point out that these updates reflect my beliefs. If my beliefs and your beliefs are not the same, you may not find them useful. I find the market update information useful for my trading, so I do the work each month and am happy to share that information with my readers.
However, if your beliefs are not similar to mine, then this information may not be useful to you. Thus, if you are inclined to do some sort of intellectual exercise to prove one of my beliefs wrong, simply remember that everyone can usually find lots of evidence to support their beliefs and refute others. Just simply know that I admit that these are my beliefs and that your beliefs might be different.
These monthly updates are in the first issue of Tharp's Thoughts each month. This allows us to get the closing month's data. These updates cover 1) the market type (first mentioned in the April 30, 2008 edition of Tharp's Thoughts), 2) the five week status on each of the major US stock market indices, 3) our four star inflation-deflation model plus John Williams' statistics, and 4) tracking the dollar. I will now report on the strongest and weakest areas of the overall market as a separate SQN™ Report. And that may come out twice a month if there are significant market charges.
Part I: Van Commentary—The Big Picture
The S&P 500 has had 14 new high closes in the last two months. We’ve moved from neutral (new high closes with a very small range change percent) to strong bull this month. We have also moved into an inflationary mode. Gold and silver are starting to move up. July could prove to be an interesting month.
And that’s the big picture in a nutshell.
Debt Clock
The State of the United States |
Month Ending |
National Debt |
Federal Tax Revenue |
Federal Spending |
Trade Deficit |
Debt Per Family |
Unfunded Liabilities |
Workforce (taxpayers) |
People supported by them |
July 31 2012 |
$15.93 trillion |
$2.364 trillion |
$3.632 trillion |
$810 billion |
$684,405 |
|
|
|
Dec 30 2012 |
$16.42 trillion |
$2.452 trillion |
$3.540 trillion |
$740.7 billion |
$732,086 |
|
|
|
July 31, 2013 |
$16.89
Trillion |
$2.73
trillion |
$3.535 trillion |
$703 billion |
$748,458 |
Unfunded Liabilities |
115.2 million |
109.9
95.4% |
Dec 31, 2013 |
$17.27 trillion |
$2,82 trillion |
$3,480 trillion |
$692 billion |
$751,294 |
$127.2 trillion |
115.0 million |
108.5M
94.3% |
Jan 31, 2014 |
$17.32 trillion |
$2.84 trillion |
$3.494 trillion |
$676 billion |
$752,026 |
$127.7 trillion |
115.2 million |
108.8M
94.4% |
Feb 28, 2014 |
$17.38 trillion |
$2.86 trillion |
$3.503 trillion |
$683 billion |
$752,554 |
$128.1 trillion |
115.4 million |
108.4M
93.9% |
Mar 31, 2014 |
$17.57 trillion |
$2.89 trillion |
$3.519 trillion |
$683 billion |
$758,057 |
$128.6 trillion |
115.6 million |
107.9M
93.3% |
Apr 30, 2014 |
$17.51
Trillion |
$2.91 trillion |
$3.528 trillion |
$683 billion |
$758,598 |
$128.9 trillion |
115.8 million |
108.8M
94.0% |
May 31, 2014 |
$17.52
Trillion |
$2.93 trillion |
$3.54 trillion |
$689 billion |
$759,341 |
$129.4 trillion |
116.0 million |
104.38M
90.0% |
Jun 30, 2014 |
$17.54 trillion |
$2.95 trillion |
$3.51 trillion |
$697 billion |
$757,392 |
$124.8 trillion |
116.1 million |
104.4M
89.9% |
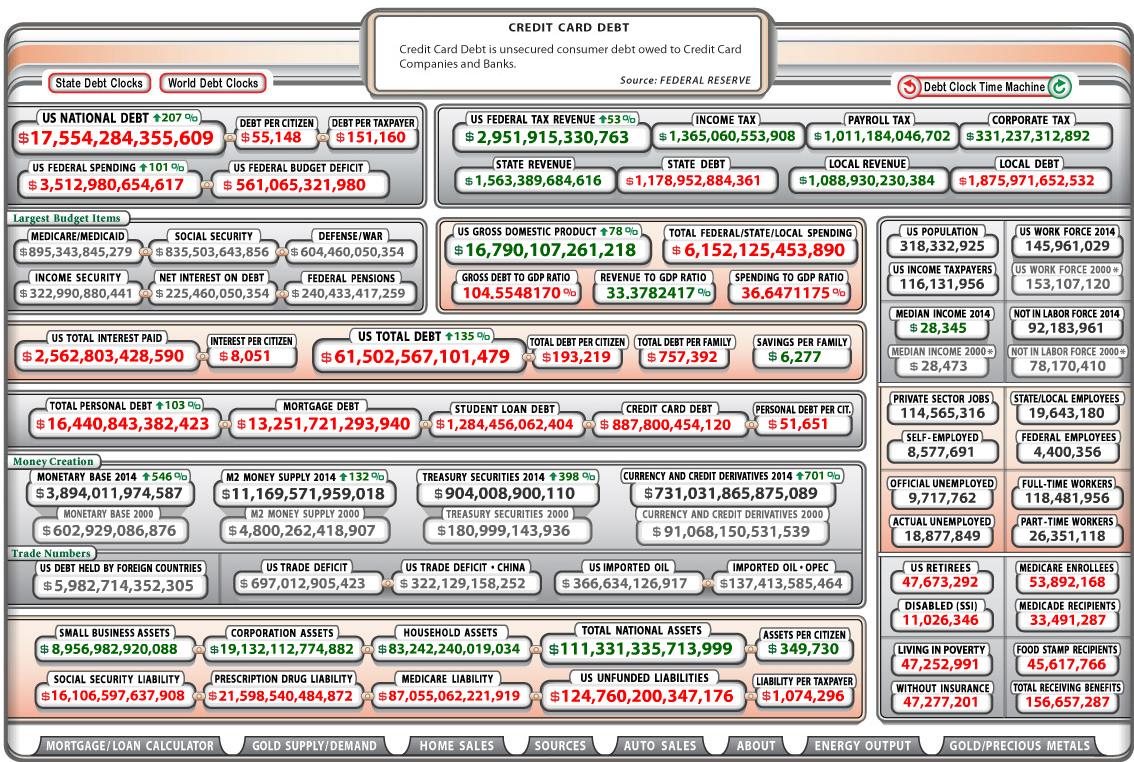
Right now our total unfunded liabilities are $124.8 trillion (with most of that being Medicare and prescription drug liability) at $87.1 trillion and $21.6 trillion, respectively. Social security unfunded liability is only a little less than our total debt at $16.1 trillion. All three of those figures dropped by at least a trillion dollars from last month; however, this could be due to more government statistical changes to make the numbers look better (more on this later).
Today, our official debt is over $17.5 trillion and it goes up almost a trillion dollars every year. Furthermore, the debt situation is so bad that the Federal Reserve has had to drive short term interest rates to almost zero and long term rates to very low numbers. This is killing the U.S. dollar and interest rates have nowhere to go but up. In fact, betting on eventual higher interest rates is about as close to a certain bet (long term) as you could ever make.
According to the debt clock, our official national debt went up $20 billion from the prior month to $17.54 trillion. The US population is at 318.3 million with taxpayers standing at 116.1 million. The Boomer retirement wave has begun and retirees now stand at 47.7million. Disabled people collecting social security stands at 11.0 million, while food stamp recipients total 45.7 million. Those last two figures are down substantially from last month, however, that’s still 108 million people that are supported by the government (or the 116.1 million taxpayers). But truly about 11.6 million taxpayers pay 90% of U.S. taxes. This means that 11.6 million workers are supporting 104 million other people through the government. In addition, the top 1% of American tax payers pay 40% of the tax bill. Do these numbers add up to you? Do they seem sustainable?
The debt clock also has some new numbers. It shows the official unemployment rate at 9.7 million while the actual unemployed is 18.9 million. And these numbers are conservative compared with those published by Shadowstats.com which show unemployment at near depression level statistics.
(To see a larger version of this image, click here.)
Part II: The Current Stock Market Type Is Strong Bull Quiet
Because I was teaching a workshop on the last two days of June and we have the 4th of July weekend coming up as well, I wrote the update on Saturday, June 28th. Thus, I’m reporting these market type statistics as of the close on Friday, June 27th, rather than June 30th.
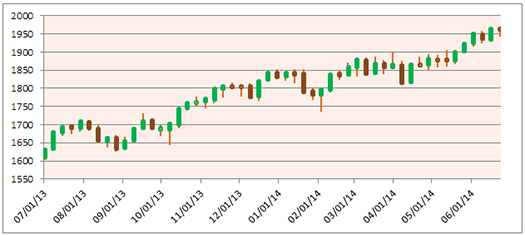
As you know, I look at the Market SQN® score for the daily percent changes in the S&P 500 Index over 200, 100, 50 and 25 days. For our purposes, the S&P 500 Index defines the market. On June 28th, all four figures were in strong bull quiet territory. The 100 day range change percent is 11.72%. That is, the S&P 500 is up 11.72% over the last 100 days ending June 28th. There were 8 new high closes in June, as opposed to 14 new high closes for the first five months of the year. June was a very strong month. And on the 27th we were only 0.1% away from the last all time high close.
Last month, if you remember, I mentioned that we were having new all-time high closes with the range change percent only being about 5% for 100 days which was why the market direction was neutral. As I said last month, even though similar signs occurred in 2000 and 2007 (prior to huge declines) this neutral market type is not predictive. I said the market could collapse, stay the same or become stronger. In this case, the market has become stronger and the weekly bar chart for the S&P 500 below shows that move up.
(To see the three following charts stacked and aligned, click here.)
Below, the second chart shows the SQN 100 Score in strong bull territory.
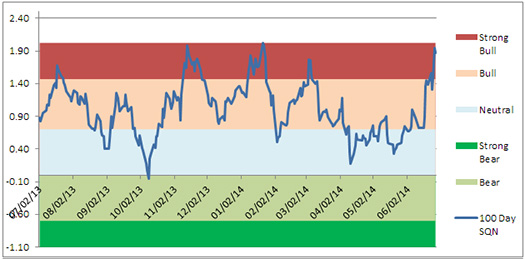
And the third chart shows market volatility which is solidly in the quiet range, which suggests that this bull market may persist for some time.
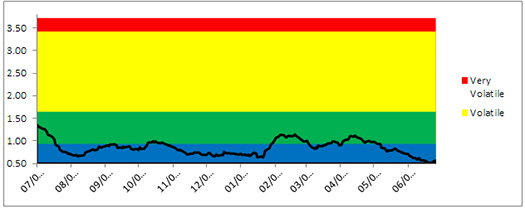
(To see the three previous charts stacked and aligned, click here.)
Below is a chart of the weekly changes in the three major US Indices. All three indices are up for the year, but not by a lot. In the first half of the year we now have 22 record high closes with 8 of them being in June.
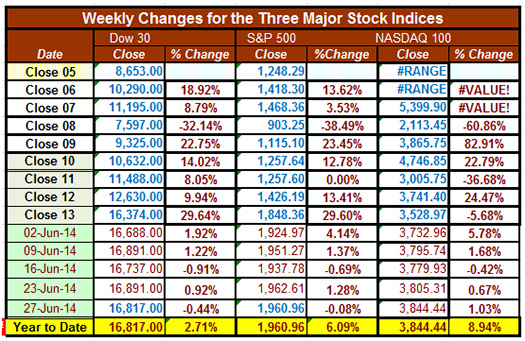
Even though the 100-day range change percent for the S&P 500 is over 10%, much of the market gain for the year is due to performance in early Jan (that is no longer counted in the Market SQN) and in June. The S&P 500 is only up 6% for the year, the NASDAQ is up nearly 9% and the DOW is up just barely at 2.7%.
Part III: Our Four Star Inflation-Deflation Model
In the simplest terms, inflation means that stuff gets more expensive, and deflation means that stuff gets cheaper. There’s a correlation between the inflation rate and market levels, so the inflation rate can help traders understand big-picture processes. Below is the table of the model’s components for the recent months and year-end figures. (Note that the June data shows closing prices for June 30th.)
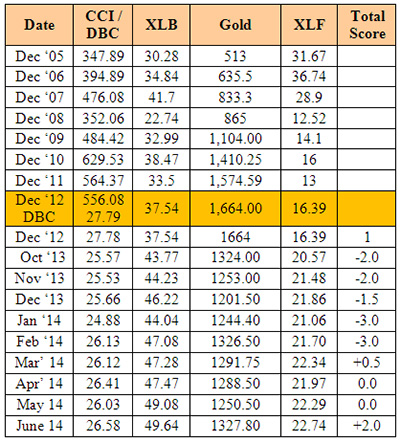
Looking back over the most recent two-month and six-month periods shows how the model derives the current month’s score, given in the table below.
Month |
DBC2 |
DBC6 |
XLB2 |
XLB6 |
Gold2 |
Gold6 |
XLF2 |
XLF6 |
Total Score |
|
Higher |
Higher |
Higher |
Higher |
Higher |
Higher |
Higher |
Higher |
|
Jun 14 |
|
+1 |
|
+1 |
|
+1 |
|
-1 |
+2.0 |
This was the first month in the last 15 that we saw a move toward inflation, although the last two months were neutral. Deflation has been predominant, as we continually point out, largely because banks are not lending. The money multiplier measures bank’s capital leveraging through loans and it's still at 0.7 rather than the normal 3.0 that we saw in the decades prior to the global financial crisis.
Part IV: Tracking the Dollar
US laws are scheduled to take effect in July which basically require foreign financial firms to police US citizens or face a 30% fee on the sale of their U.S. assets. The laws are making it impossible for Americans living abroad to open a bank account (foreign banks are closing local Americans’ accounts saying “we don’t want your business” — even in Canada). The last I heard, over 77,000 foreign financial institutions were in compliance with the new regulations. The U.S. government seems to think it is fighting a tax war against its citizens.
This makes it even harder now for the US to compete in the global economy. In fact, the only solution I can see for American corporations with foreign operations is for them to employ foreigners almost entirely in order to keep operating overseas. That’s not good for the US trade deficit.
Logically, the US appears to have made a very dangerous move. One investment advisory service has been saying that these new laws could cause a massive flow of money out of the U.S. dollar and could even cause countries to move away from US dollar as a reserve currency.
Certainly, the new laws could also cause a massive exit of foreign money out of the U.S. markets. A true mass exodus, however, would have started already and we would not have seen 8 new high closes in the S&P 500 in June. I doubt that anything will happen in July.
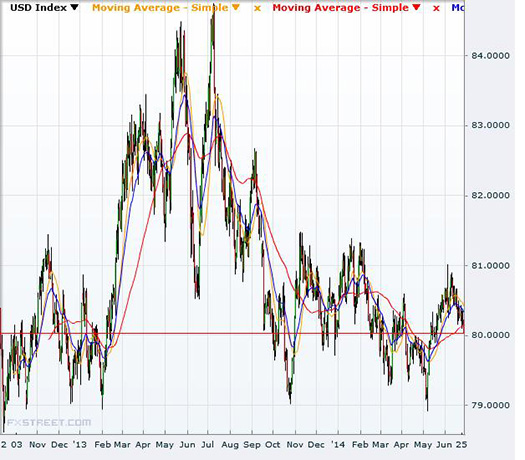
This month, I loaded a 500-day chart of the US dollar. While the dollar is up slightly from setting lows toward the end of the month in the 79 range, over the past year it’s down from about 84.5 to the current range of 80. This range is quite dangerous, but the dollar doesn’t seem to be breaking down and entering new low territory. If it goes below 79, then be very wary of having lots of assets in the US dollar.
General Comments
Just a reminder that this year’s high Market SQN score for 100 day periods was 2.02 – hit on January 14th. Right now it’s about 1.9, so one possibility is that we could see new highs in the Market SQN score for 2014 in the next month. We had six new high closes in May and eight new high closes in June. Overall, we have had 22 new high closes in 2014.
If we get through July safely with the law changes I described taking place, then the rest of 2014 could be fairly good. But I’d expect an inflationary climate for the rest of the year. The Fed has already suggested that it will raise interest rates next year. I would expect that to occur right about the time the public starts to get interested in what is now a very profitable market climate. 2013 was actually the first year since 2006 in which there were more funds going into US equity funds than were going out of them. My guess is the same has continued for the first six months of the year.
By the way, as I mentioned last month, the US government is now doing more statistical manipulations. They wanted the economy to do better. However, the government does everything it can to hinder the economy through stupid laws and deficit spending and thus has no control. As a result, they do the next best thing, they manipulate the statistics to make things seem better. For example, the unfunded Federal deficit dropped by over $3 trillion last month, but that was only a statistical calculation. And now they have added some arbitrary value for new patents and copyrights filed in the US, so that growth now looks better.
I gave this prescription for the US economy last month and I will continue to include in in this update for at least the rest of the year. Politicians please read.
1. Kill deficit spending immediately by stopping wars and spending on what we mistakenly call “defense.” We can’t afford to be the world peace keeper any more. We spend more than a trillion dollars per year on “defense.”
2. Make sure no more deficit spending continues by passing a law calling for a re-election of new politicians any year the government cannot spend within their means (I heard this first from Warren Buffet and borrowed it).
3. Right now the U.S. education system cannot compete with those of many other countries except at the university level. And our best universities are filled with brilliant foreign students. Great, let’s accept the situation as it is and allow the brilliant foreign students who getting masters and Ph.D. degrees to immediately become U.S. citizens instead of forcing them to return to their own countries to use the skills we taught them abroad.
4. Give a $50,000 tax rebate to any US citizen getting a Ph.D. in the United States to help them pay for their education or their education loans.
5. Allow US companies to compete in the world in a big way by eliminating the tax on the foreign earnings of US citizen living abroad. Taxing foreign earnings of US citizens living in the US is fine, but not those who must live abroad to help our corporations grow and who must also pay foreign tax on their earnings.
6. Reduce Corporate Income tax from some of the highest levels in the world to competitive levels. Do this by not taxing foreign earnings from US corporations that are used to stimulate the economy. This would eliminate the US trade deficit fairly quickly.
7. I personally ordered a Tesla model S for delivery in December. Right now the government gives people a $7500 credit for something that could totally eliminate the US dependency on foreign oil and dramatically reduce air pollution. Tesla has actually released their patents to the rest of the world. The model S met two of the criteria that I wanted in a car: great power (0-60 in 4.2 seconds) and great gas mileage (infinite). Initially, I didn’t think a Tesla would meet my third criterion — something I could have fun driving around the US. But now it looks like by the time I get my car, the company will have a ring of charging stations around the US so I will be able to drive around the country for FREE in 2015 and perhaps even do the same in many parts of Canada by the end of 2016. Let’s encourage the US to help Tesla (an American company) with their mission. Obviously, this recommendation has more of a personal bias than my others.
Until next month’s update, this is Van Tharp.
About the Author: Trading coach and author Van K. Tharp, Ph.D. is widely recognized for his best-selling books and outstanding Peak Performance Home Study Program—a highly regarded classic that is suitable for all levels of traders and investors. You can learn more about Van Tharp at www.vantharp.com. His newest book, Trading Beyond The Matrix, is available now at matrix.vantharp.com.
Discount Brokers and Analysts:
Dr. Tharp Wants to Interview You!
For his new book on beliefs, Van Tharp is interviewing people of all different levels of market knowledge and with various backgrounds. Right now, Van is looking to interview a discount broker and an analyst. If you think you fit one of those descriptions and you would like to be interviewed, contact us at [email protected].
Workshops
Combo Discounts available for all back-to-back workshops!
See our workshop page for details.
Trading Tip
June 2014 SQN® Report
by Van K. Tharp, Ph.D.
There are numerous ETFs that now track everything from countries, commodities, currencies and stock market indices to individual market sectors. ETFs provide a wonderfully easy way to discover what’s happening in the world markets. Consequently, I now apply a version of my System Quality Number® (SQN®) score to measure the relative performance of numerous markets in a world model.
The Market SQN score uses the daily percent change for input over a 100-day period. Typically, a Market SQN score over 1.47 is strongly bullish and a score below -0.7 is very weak. The following color codes help communicate the strengths and weaknesses of the ETFs in this report:
- Dark Green: ETFs with very strong SQN® 100 scores > 1.47
- Light Green: ETFs with strong SQN 100 scores (0.70 to 1.47).
- Yellow: ETFs with slightly positive Market SQN scores (0 to 0.70). These are Neutral/Sideways
- Brown: ETFs with slightly negative Market SQN scores (0 to -0.7).
- Red: Very weak ETFs that earn negative Market SQN scores (< -0.7).
This is basically the same ratings that we use for the SQN® Score. The world market model spreadsheet report below contains most currently available ETFs; including inverse funds, but excluding leveraged funds. In short, it covers the geographic world, the major asset classes, the equity market segments, the industrial sectors and the major currencies.
World Market Summary
Each month, we look at the equities markets by segment, region and sector. Most of the world’s countries are now light green or yellow with none being brown. A lot has changed over the last 30 days. All of the US sectors are now almost all green with only one yellow, microcaps. The rest of the Americas have now turned green with very strong improvement in Canada. Europe is mostly green with a few yellow and a few dark green. In Asia, every country is positive with China the only one yellow while India and Thailand are very strong.
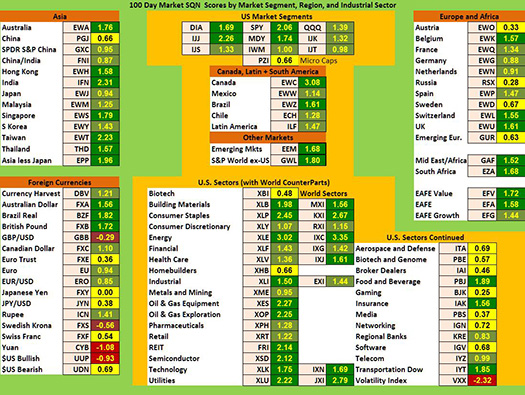
(To see a larger version of this chart, click here.)
Currencies show that the Yuan is extremely weak as was the case last month. In addition, the US Dollar, the British Pound/US Dollar, and the Swedish Krona are all negative. The Brazilian Real, the British Pound and the India Rupee are all bullish.
From a sector standpoint, we are mostly green now with some yellow. Energy, Oil & Gas, Consumer Staples, Utilities, REITs and Semiconductors are all very strong. Everything else is positive with the only negative sector being the Volatility Index.
Commodities, Real Estate, Debt, Top and Bottom Lists
The next chart shows real estate, debt instruments, commodities and the top and bottom ETFs for the past 100 days.
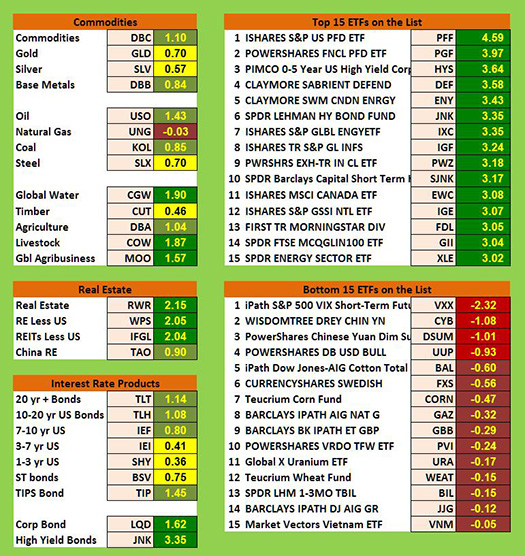
Global Water, Livestock, and Global Agribusiness are the dark green commodities. Oil, Commodities, Agriculture, Coal, and Base Metals are light green. Precious metals, Steel, and Timber are weak with Natural Gas showing as the only negative commodity.
US Real Estate is now super strong, being above 2.0, while Chinese real estate is now in the light green range. All the interest rate sectors are positive, with Junk Bonds and Corporate bonds actually being dark green. Interestingly, long term bonds are again stronger than short term bonds for the fourth month in a row. Some people don’t seem to understand what’s going on in the world or they are making short term plays.
Last month we had 3 ETFs score above a Market SQN of 4.0 and 9 ETFs score above 3.0. This month, the entire list now scores above a 3.0 with only one scoring above 4.0. Particularly strong ETFs include: PFF (preferred stock) and PGF (financial preferred stocks).
Only three of the weakest ETFs score below -1.0 — the volatility index and two different funds for the Chinese Yuan. The next weakest ETF is the US Dollar Bull issue (UUP). There are also several commodity based ETFs on the weakest list as well.
Summary
Now let’s look at our newest table which measures the percentage of ETFs in each of the strength categories. Based upon this, 87% of the ETFs we track are either bullish or very bullish. And only 3.3% are bearish or very bearish. The S&P 500 continues to set new closing highs.
Date |
Very Bullish |
Bullish |
Neutral |
Bearish |
Very Bearish |
|
> 1.5 |
0.75 - 1.5 |
0 - 0.75 |
0 - -0.7 |
< - 0.7 |
January 31st |
27.1% |
39.6% |
20.7% |
6.4% |
4.7% |
Feb. 28th |
10.3% |
45.2% |
24.4% |
11.9% |
7.5% |
March 31st |
39.2% |
25.5% |
19.1% |
9.0% |
6.4% |
April 30th |
49.1% |
21.1% |
14.8% |
8.0% |
6.2% |
May 31st |
29,2% |
23.6% |
19.9% |
12.3% |
14.2% |
June 30th |
2.1% |
31.0% |
23.2% |
22.0% |
20.9% |
July 31st |
8.2% |
33.5% |
29.0% |
13.3% |
15.2% |
August 30th |
1% |
15% |
46.4% |
19.3% |
17.5% |
Sept. 30th |
1% |
13.8% |
42.3% |
23.0% |
19.1% |
Nov. 1st |
13.3% |
48.3% |
21.8% |
12.5% |
3.3% |
Dec 1st |
14.6% |
42.7% |
24.2% |
13.3% |
4.3% |
Dec 31st |
19.3.% |
45.5% |
22.0% |
11.3% |
2.9% |
January 31st |
8.0% |
49.3% |
20.7% |
12.7% |
7.6% |
Feb. 28th |
18.9% |
48.4% |
18.1% |
6.2% |
6.8% |
March 31st |
4.9% |
40.2% |
38.8% |
13.3% |
3.1% |
April 30th |
11.1% |
33.9% |
40.2% |
11.3% |
1.8% |
May 31st |
12.5% |
46.5% |
27.7% |
7.6% |
6.0% |
June 30th |
53.4% |
33.7% |
14.2% |
2.5% |
0.8% |
What's Going On?
The economic fundamentals are still terrible but the stock market seems to be one of the key places to be. Act based upon what is happening, not based upon what you think might happen. And be careful.
Until next month, this is Van Tharp.
The markets always offer opportunities, but to capture those opportunities, you MUST know what you are doing. If you want to trade these markets, you need to approach them as a trader, not a long-term investor. We’d like to help you learn how to trade professionally because trying to navigate the markets without an education is hazardous to your wealth.
All the beliefs given in this update are my own. Though I find them useful, you may not. You can only trade your own beliefs about the markets.
New
 One of the primary objectives of longer-term systems is that they require less management than shorter term systems. Ken's Core Systems can be operated outside of market hours in less than an hour per month. One of the primary objectives of longer-term systems is that they require less management than shorter term systems. Ken's Core Systems can be operated outside of market hours in less than an hour per month.
You can now stream the digitally recorded Core Trading Systems Workshop and download the companion documents for a special introductory price. Learn five trading systems from the dynamic Dr. Ken Long in your own space, at your own pace!
At $1,295 it's half the cost of the live workshop. Plus, for a limited time...
...we are releasing it for only $995!
Buy Now
We've complied all you need to know about this new offering. Go to www.vantharp.com/products/core-workshop-video-home-study.asp
For a short video overview about the course, click here.
Matrix Insights
The Short Seller vs. The Artist
Before describing my profound insights gained from doing the exercises in the book, I wanted to give a little background.
About a year ago, 18 months into my trading career, I was a terrible trader, consistently losing money, frustrated and frightened but also absolutely determined to succeed. When I heard the phrase,
"Our mission of transformation through a trading metaphor"
I understood that I had seen that this was what I wanted, and this was why I had continued to trade.
State of my mind when I discovered Trading Beyond the Matrix
- I believed that stock markets should fall. In my mind this wasn't opinion, it was fact. This was based on the 'fact' that there are good reasons and bad reasons why stock prices rise. I 'knew' that Fed easing was causing the rises, and this being a bad reason meant that prices should not be happening and therefore I should only trade on the short side.
- This very expensive idea proved very hard to shake off and I was baffled why I continued to trade this idea. Except that I had two more facts that could keep me in losing short positions: first, if I closed my short positions and became the last bear to capitulate, stock prices will immediately fall. And second, since prices fall faster than they rise, if I could just hold on I will make huge gains and get all my money back.
- I had made a lot of money in 2008 and then again in 2011 (but lost it all again and much much more) and wanted to repeat this, but my awareness of this as the source of my bearish view didn't lessen the grip that it had on my psyche. I even contributed to blogs to say that perma-bears have a form of psychosis. But still I traded my 'fact' that markets should fall — fast and soon.
- After my first encounter with Van Tharp material, I had to face up to how much I love losing money in the markets since that is what I did, over and over again. This idea felt somehow, bizarrely true, but deepened my confusion. I could also see that the law of attraction was at work: I had an almost obsessive ideation of price collapses which came absolutely and perfectly true — but just in my account.
- This is the state of my mind when I started to read Trading Beyond the Matrix. Normal forms of self analysis weren't working. Now matter how much I analyzed my bearish determination and tried to control my bearish proclivity nothing worked. The first action I took was to take the Sedona Method course as recommended in Trading Beyond the Matrix. I had a hunch that my first step would be to forgive myself for losing money, for getting things so wrong in the markets etc. The Sedona Course helped me achieve that (and much more).
The Insight
After Sedona, and knowing that I really wanted to trade (previously I suspected that my trading was a perverse form of punishment for my losses), I listened to Trading Beyond the Matrix for the fourth time and bingo, I saw it: I could complete a parts negotiation process with this impetuous short seller.
There she was: a wild, red-haired troll who told me things like, "Don't play by the rules! Be a maverick! You don't have to play like everyone else! Take one genius trade, make a ton of money and that'll show them! I don't have to do the dull bit! Be brave! Be crazy!" So this little gremlin had a lot of energy, and a lot of spirit. I saw that there was absolutely no way this energy could be controlled by willpower, by simply telling it to be quiet, to obey the rules, because that just made it rebel more and shout louder. The part it was having a conversation with was the artist (going head to head with the banker part seemed like too big a step). The artist, who appeared as a giant, beautiful egg. kept saying to the impetuous short seller, "But it doesn't work, you're not helping any of us. I really envy your energy and your spirit and wish I had more of it myself but your bombastic behaviour is not helping us." The sense of calm that came over me after this process was incredible. The negotiation brought many surprises; I found that the impetuous short seller was satisfied with the things like buying an almost off-grid cabin in the woods, by not wasting money on frivolous things, by being self-sufficient, free thinking, self determined.
After all the years I had wasted framing this part as my vicious self-sabotor, as lazy, as undisciplined, as stupid when all it wanted was expression of its big bold spirit. It took about 10 minutes of parts analysis during a longer meditation to find it. Literally a miracle.
Now I am doing parts analysis on everything I can find. Today I had another break-through by negotiating with my inner bully who has sucked a lot of energy and fun out of life. It's quick, fun imaginative and incredibly powerful.
Thank you!
Sally U.
(Read more about Parts Negotiation here.)
----------------------------------------------------------------------------------
An Explosive Bombshell and Quiet Truth
It's right there in the Foreword to Trading Beyond the Matrix. The one most important insight that any trader can ever possibly understand is there, only a few pages after the Table of Contents on page xix. It just so happens that it is also the most important insight that any person can ever receive. And this insight applies to all human endeavor, not just trading. And it applies regardless of age, sex, religion, nationality or any of the other “divisions” that we as human beings have uselessly divided ourselves into.
“The external world is a reflection of our internal world.”
WOW! For those of us who have at least begun to “get it,” — that our thoughts really do become external reality, that our beliefs actually do shape our very lives regardless of all else, this one simple sentence is at the same time an explosive bombshell in our lives and a quiet truth—a quiet truth that has always been there serving us, if only humanity can become aware of it, if only more and more of us continue to wake up to it.
So now, if we are truly committed to making something positive out of our trading and of our very lives, we can realize that it starts inside our selves. Success is decidedly NOT a matter of accreting more and more from outside our selves, but instead allowing that which was already placed inside each and every one of us by our Creator to grow, to blossom, so that we may become our true self that was inside each and every one of us all along.
In every chapter of this amazing book, in fact on each and every page, this great insight is generously shared with all of us who have open minds and hearts willing and capable of receiving this message. Dr. Tharp and his students have opened themselves up to us in very personal ways, sharing intimate details of their own inner lives as they traveled along their own paths of becoming world class traders and teachers. Their honesty and openness about their inner journeys to success will inform and inspire all who choose to read with an open heart.
Some of us may still think that certain technical parts of trading such as arithmetical calculations and the details of system design might not be essentially psychologically (internally) driven. But they are, and we learn about the states of mind and useful beliefs that are conducive to success at every step along the way whether it be entries, or exits, stops or add on positions, determining the big picture, or deciding when to stop trading.
I feel much gratitude for Dr. Tharp, VTI, and all of Dr. Tharp's students who have in Trading Beyond the Matrix caused this priceless insight to become real and foremost in my consciousness.
Robert C.
Editor's Note: These letters were sent to us in response to a contest we have been running in which we asked to hear about the one most profound insight that you got from reading Van's new book, Trading Beyond the Matrix, and how it has impacted your life. In the next few weeks, we will pick our favorite submissions and ask you to vote on them. The winner will receive a free workshop! Stay tuned for more information on this phase of the contest. If you haven't purchased Trading Beyond the Matrix yet, you can do so here.
Ask Van...
Everything we do here at the Van Tharp Institute is focused on helping you improve as a trader and investor. Consequently, we love to get your feedback, both positive and negative!
Send comments or ask Van a question by clicking here.
Also, Click here to take our quick, 6-question survey.
Back to Top
Contact Us
Email us at [email protected]
The Van Tharp Institute does not support spamming in any way, shape or form. This is a subscription based newsletter.
To change your e-mail Address, e-mail us at [email protected].
To stop your subscription, click on the "unsubscribe" link at the bottom left-hand corner of this email.
How are we doing? Give us your feedback! Click here to take our quick survey.
800-385-4486 * 919-466-0043 * Fax 919-466-0408
SQN® and the System Quality Number® are registered trademarks of the Van Tharp Institute
Be sure to check us out on Facebook and Twitter!
 
Back to Top |